| Param | Original file | Final file |
|---|---|---|
| Filename | modeM0/AS1A13_017T01_9000006028_44827cztM0_level2.fits | modeM0/AS1A13_017T01_9000006028_44827cztM0_level2_quad_clean.evt |
| Size (bytes) | 664,516,800 | 130,256,640 |
| Size | 633.7 MB | 124.2 MB |
| Events in quadrant A | 6,039,676 | 909,802 |
| Events in quadrant B | 4,559,229 | 932,014 |
| Events in quadrant C | 7,142,829 | 746,054 |
| Events in quadrant D | 6,198,788 | 766,864 |
| Mode M0 | |||
|---|---|---|---|
| Quadrant | BADHDUFLAG | Total packets | Discarded packets |
| A | 0 | 25252 | 0 |
| B | 0 | 19569 | 0 |
| C | 0 | 27704 | 0 |
| D | 0 | 24671 | 0 |
| Mode SS | |||
|---|---|---|---|
| Quadrant | BADHDUFLAG | Total packets | Discarded packets |
| A | 0 | 170 | 0 |
| B | 0 | 170 | 0 |
| C | 0 | 170 | 0 |
| D | 0 | 170 | 0 |
| Quadrant | Total seconds | Saturated seconds | Saturation percentage |
|---|---|---|---|
| A | 8481 | 51 | 0.601344% |
| B | 8481 | 136 | 1.603584% |
| C | 8482 | 1471 | 17.342608% |
| D | 8481 | 597 | 7.039264% |
Noise dominated data is calculated using 1-second bins in cleaned event files. If a bin has >2000 counts, and if more than 50% of those come from <1% of pixels, then it is considered to be noise-dominated and hence unusable.
| Quadrant | # 1 sec bins | Bins with >0 counts | Bins with >2000 counts | High rate bins dominated by noise | Noise dominated (total time) | Noise dominated (detector-on time) | Marked lightcurve |
|---|---|---|---|---|---|---|---|
| A | 8481 | 8481 | 8 | 8 | 0.09% | 0.09% | 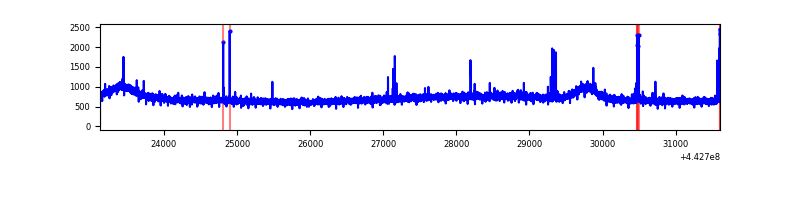 |
| B | 8481 | 8481 | 67 | 67 | 0.79% | 0.79% | 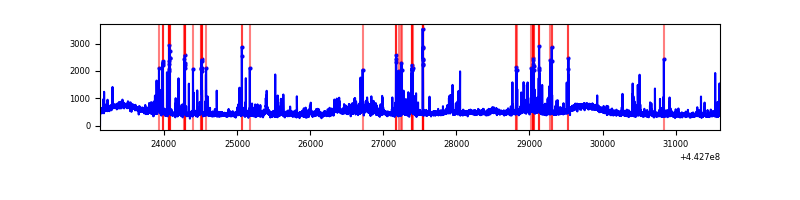 |
| C | 8482 | 8482 | 1218 | 1218 | 14.36% | 14.36% | 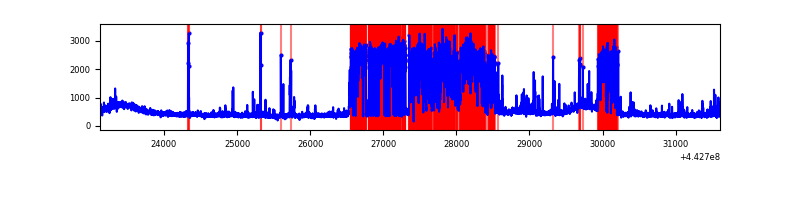 |
| D | 8481 | 8481 | 519 | 519 | 6.12% | 6.12% | 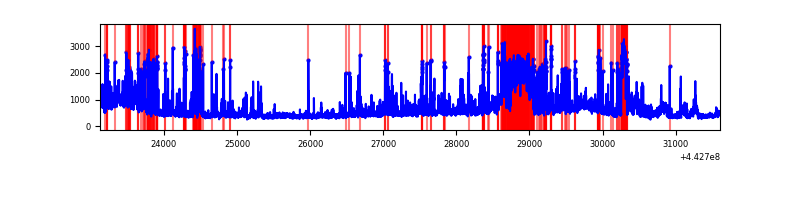 |
Top three noisy pixels from each quadrant. If the there are fewer than three noisy pixels in the level2.evt file, extra rows are filled as -1
| Pixel properties | Quadrant properties | ||||||
|---|---|---|---|---|---|---|---|
| Quadrant | DetID | PixID | Counts | Sigma | Mean | Median | Sigma |
| A | 10 | 83 | 2247100 | 11105.7 | 957 | 936 | 202.3 |
| A | 13 | 248 | 67546 | 329.34 | 957 | 936 | 202.3 |
| A | 7 | 3 | 17835 | 83.55 | 957 | 936 | 202.3 |
| B | 10 | 245 | 178891 | 929.1 | 956 | 925 | 191.5 |
| B | 5 | 172 | 169705 | 881.15 | 956 | 925 | 191.5 |
| B | 5 | 255 | 131605 | 682.24 | 956 | 925 | 191.5 |
| C | 14 | 254 | 2480919 | 12061.84 | 863 | 867 | 205.6 |
| C | 12 | 2 | 1222237 | 5940.18 | 863 | 867 | 205.6 |
| C | 1 | 3 | 29522 | 139.36 | 863 | 867 | 205.6 |
| D | 13 | 171 | 895033 | 3909.19 | 905 | 878 | 228.7 |
| D | 2 | 249 | 751668 | 3282.41 | 905 | 878 | 228.7 |
| D | 13 | 249 | 437132 | 1907.28 | 905 | 878 | 228.7 |
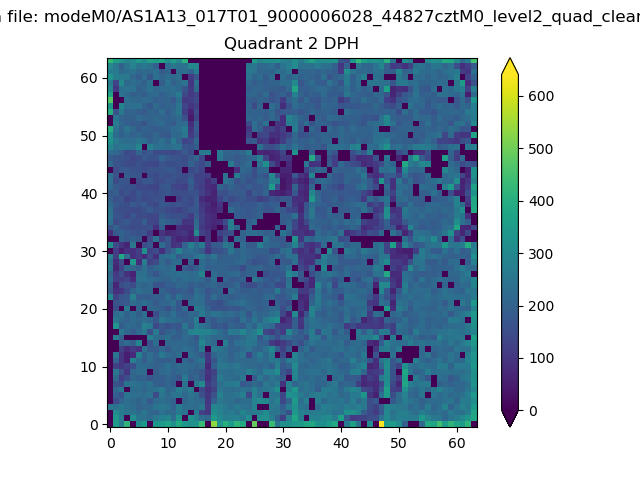
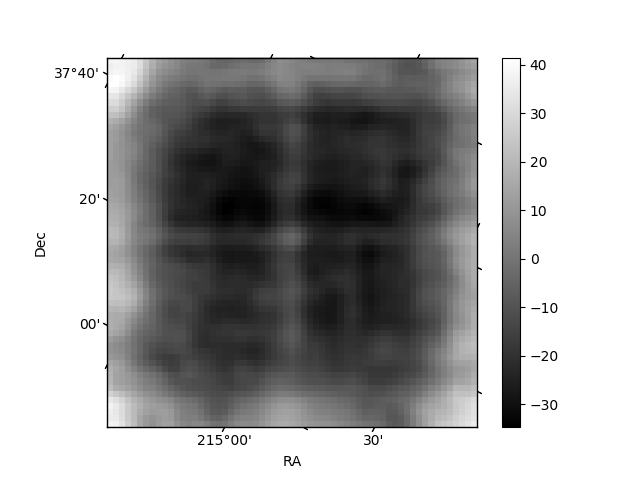
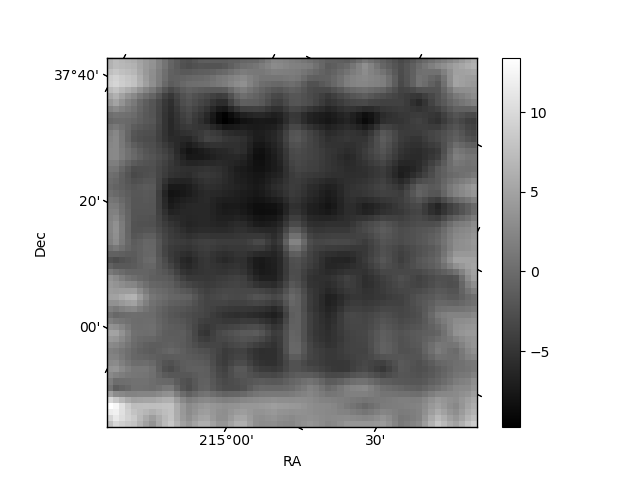
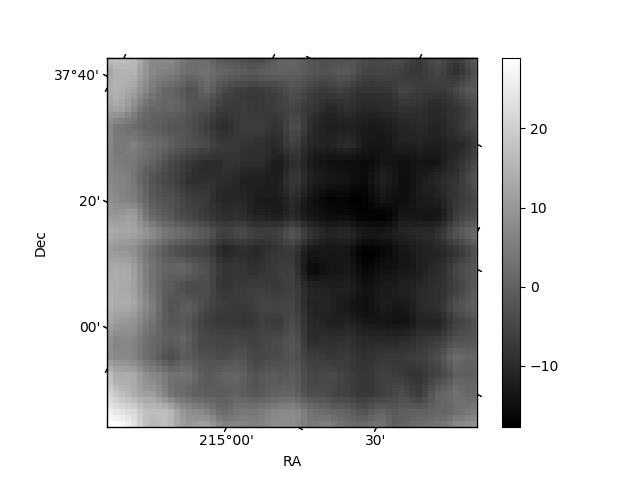
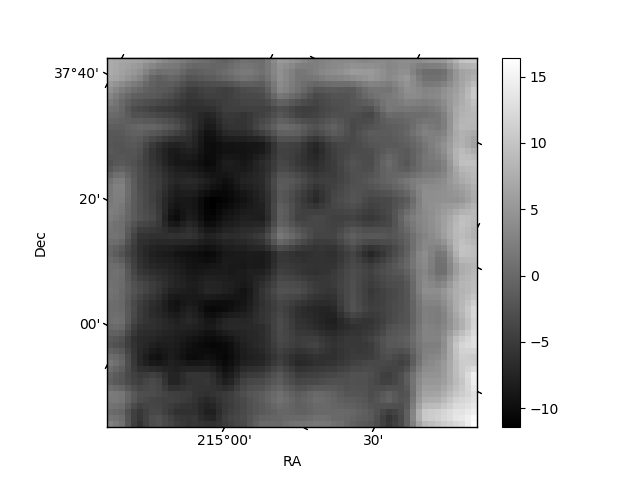
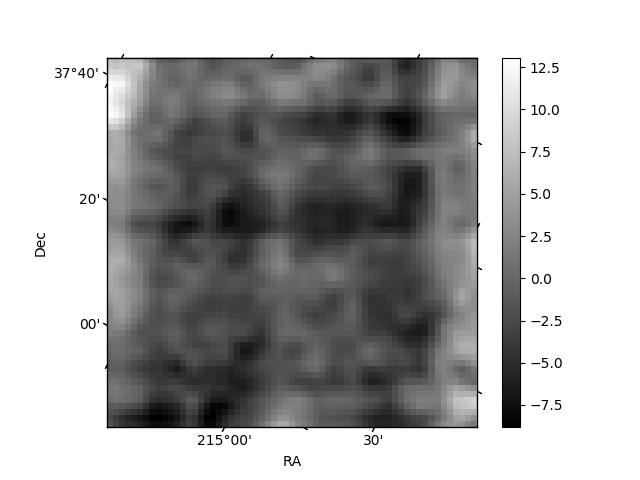
Histogram calculated using DETX and DETY for each event in the final _common_clean file
| Quadrant A | 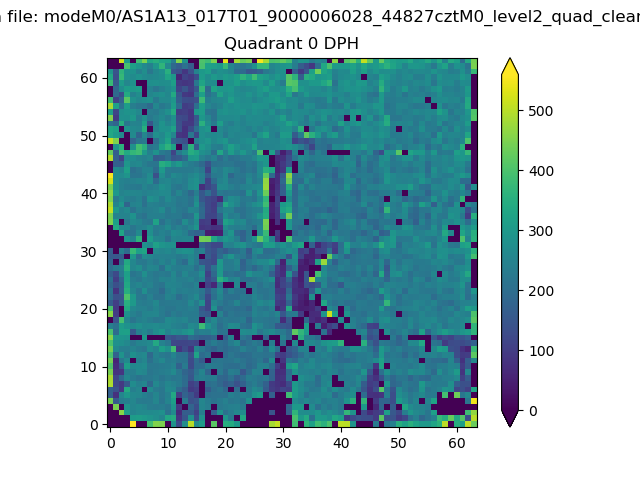 |
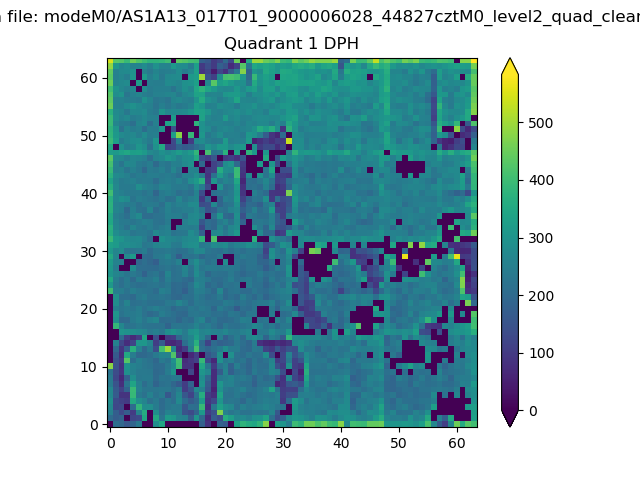 |
Quadrant B |
|---|---|---|---|
| Quadrant D | 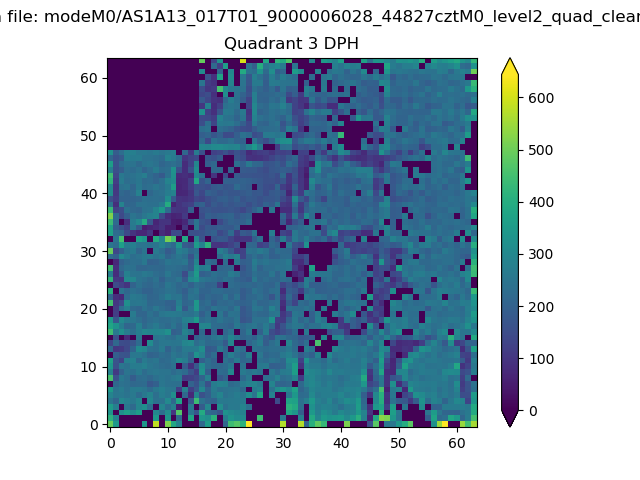 |
 |
Quadrant C |
| Plot type | Count rate plots | Images |
|---|---|---|
| Comparison with Poisson distribution Blue bars denote a histogram of data divided into 1 sec bins. Red curve is a Poisson curve with rate = median count rate of data. |
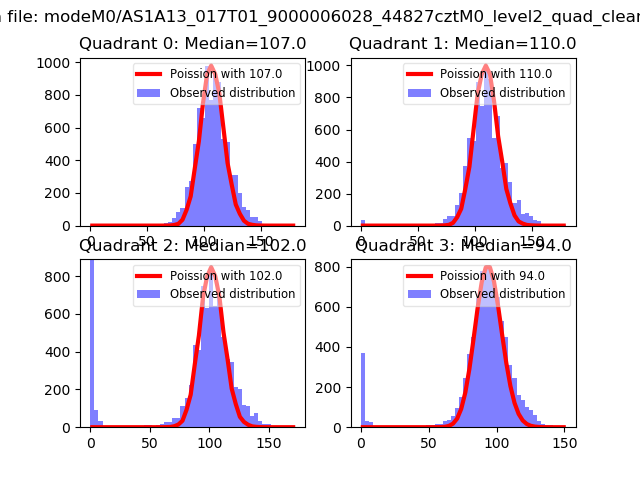 |
 |
| Quadrant-wise count rates Data is divided into 100 sec bins |
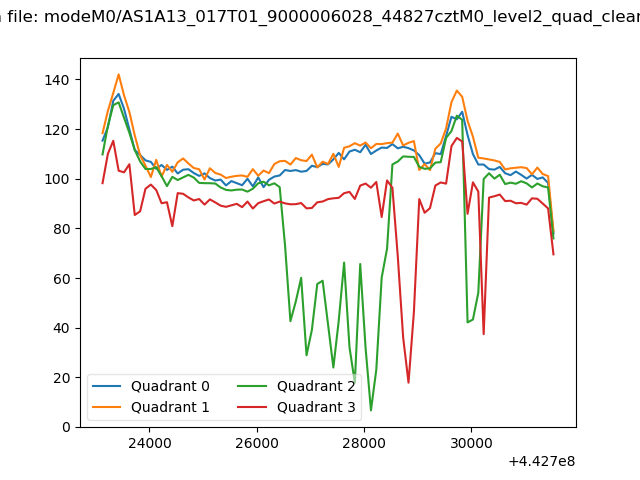 |
|
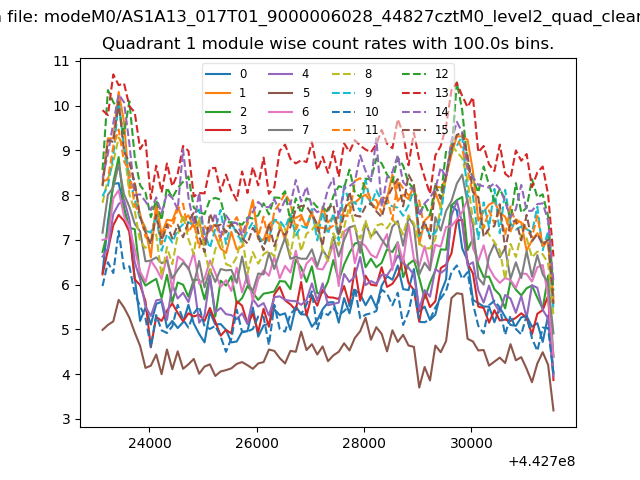
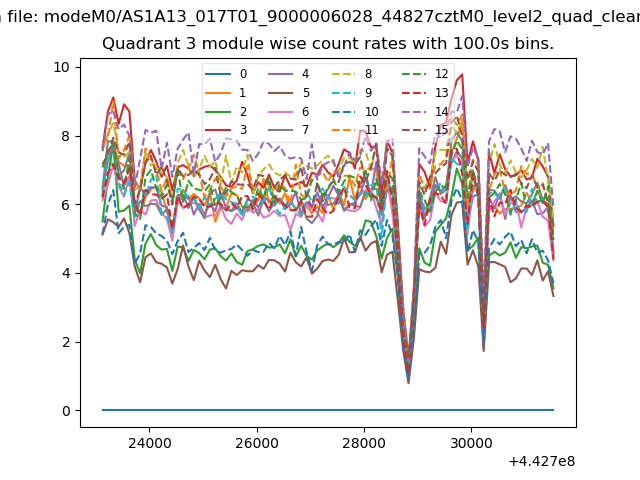
| Module-wise count rates for Quadrant A Data is divided into 100 sec bins |
 |
 |
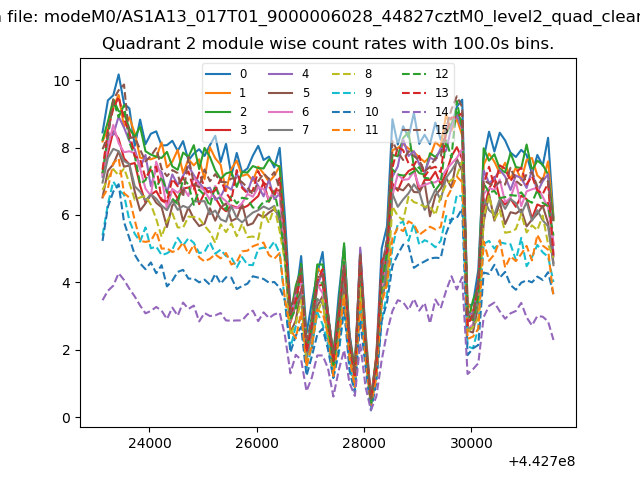
| Module-wise count rates for Quadrant B Data is divided into 100 sec bins |
 |
 |
| Module-wise count rates for Quadrant C Data is divided into 100 sec bins |
 |
 |
| Module-wise count rates for Quadrant D Data is divided into 100 sec bins |
 |
 |
| Parameter | Plot |
|---|---|
| CZT HV Monitor | 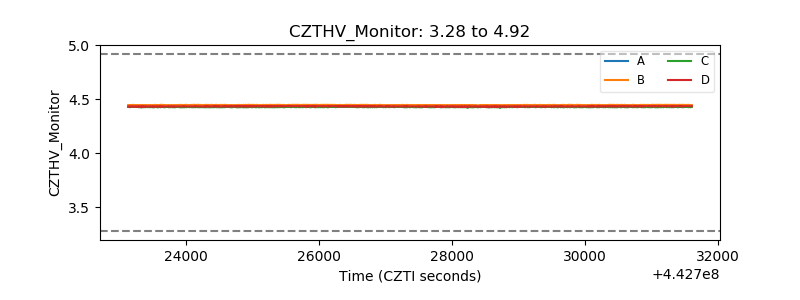 |
| D_VDD | 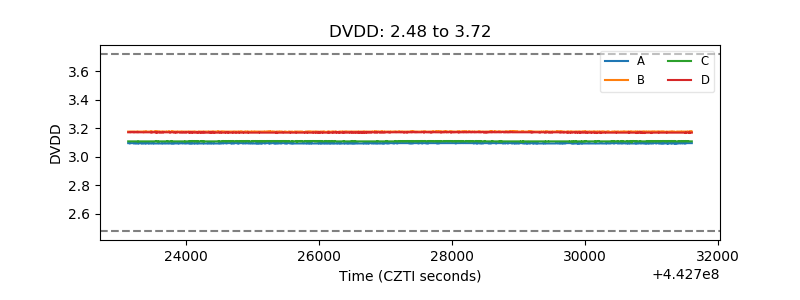 |
| Temperature 1 | 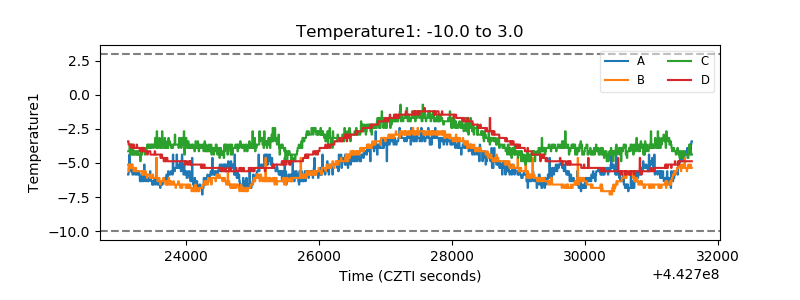 |
| Veto HV Monitor | 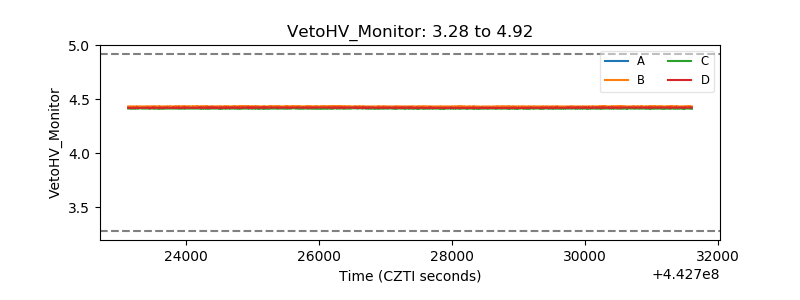 |
| Veto LLD | 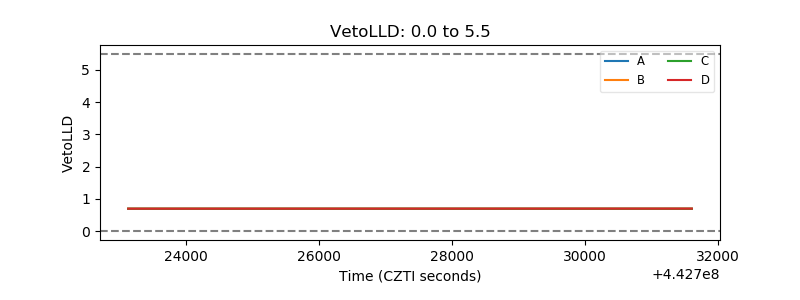 |
| Alpha Counter | 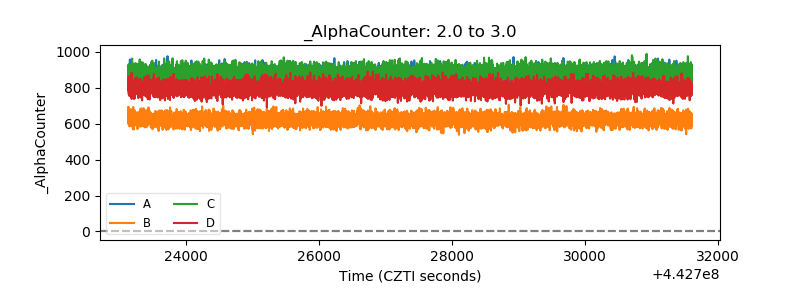 |
| _CPM_Rate | 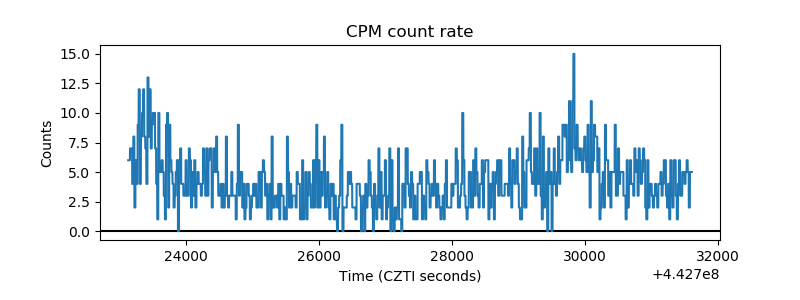 |
| CZT Counter | 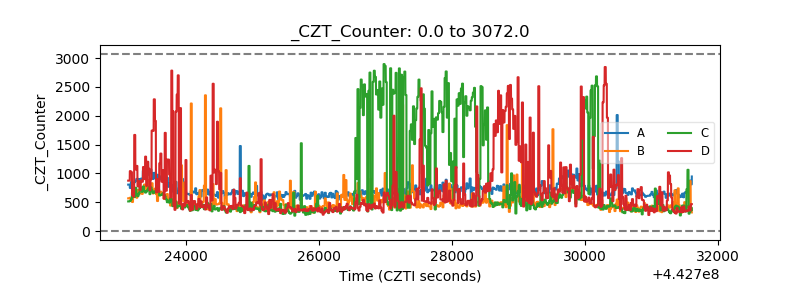 |
| +2.5 Volts monitor | 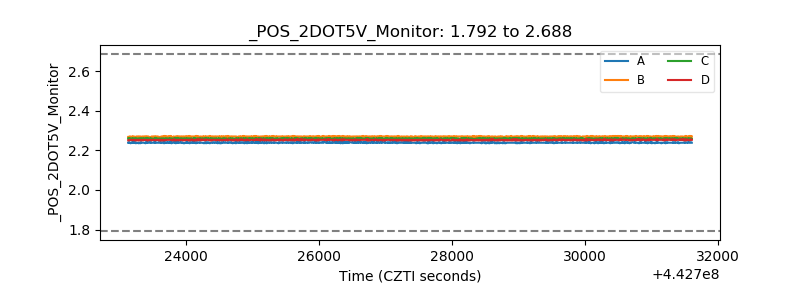 |
| +5 Volts monitor | 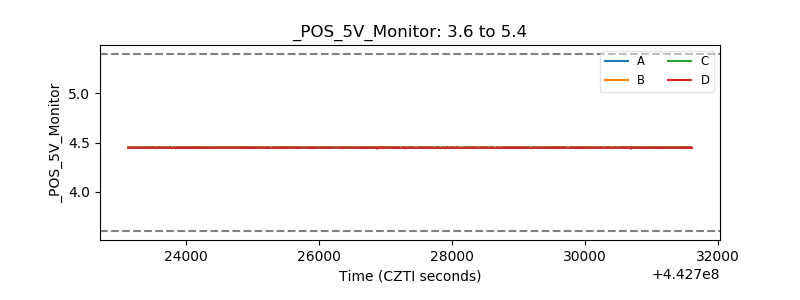 |
| _ROLL_ROT | 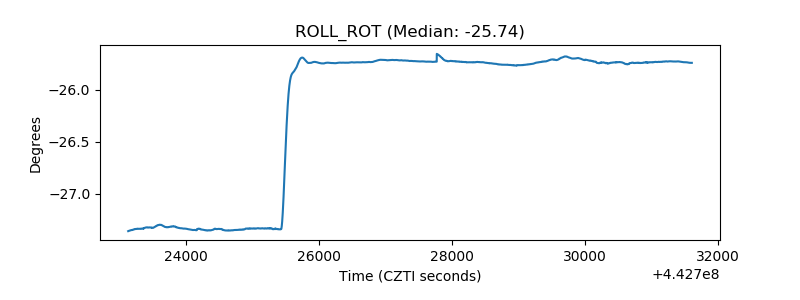 |
| _Roll_DEC | 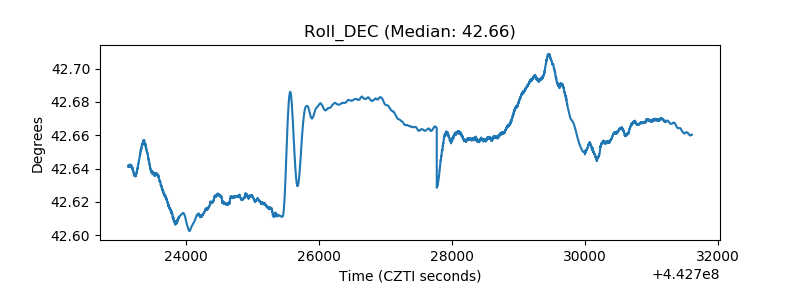 |
| _Roll_RA | 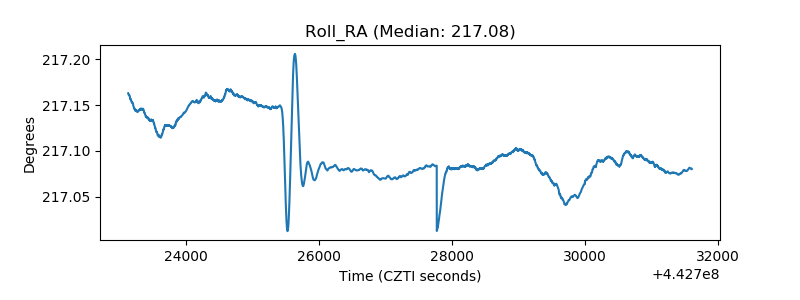 |
| Veto Counter | 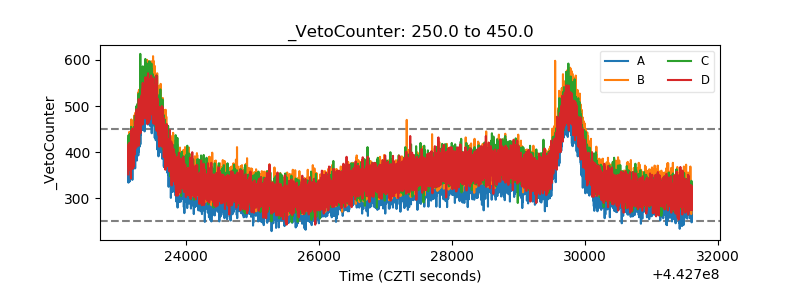 |