| Param | Original file | Final file |
|---|---|---|
| Filename | modeM0/AS1A13_044T02_9000006038_44986cztM0_level2.fits | modeM0/AS1A13_044T02_9000006038_44986cztM0_level2_quad_clean.evt |
| Size (bytes) | 830,327,040 | 112,210,560 |
| Size | 791.9 MB | 107.0 MB |
| Events in quadrant A | 6,357,735 | 851,430 |
| Events in quadrant B | 4,277,087 | 871,168 |
| Events in quadrant C | 3,790,243 | 823,395 |
| Events in quadrant D | 15,706,406 | 308,588 |
| Mode SS | |||
|---|---|---|---|
| Quadrant | BADHDUFLAG | Total packets | Discarded packets |
| A | 0 | 156 | 0 |
| B | 0 | 156 | 0 |
| C | 0 | 156 | 0 |
| D | 0 | 156 | 0 |
| Mode M0 | |||
|---|---|---|---|
| Quadrant | BADHDUFLAG | Total packets | Discarded packets |
| A | 0 | 24540 | 0 |
| B | 0 | 18039 | 0 |
| C | 0 | 17068 | 0 |
| D | 0 | 51956 | 0 |
| Quadrant | Total seconds | Saturated seconds | Saturation percentage |
|---|---|---|---|
| A | 7804 | 71 | 0.909790% |
| B | 7804 | 115 | 1.473603% |
| C | 7804 | 82 | 1.050743% |
| D | 7804 | 4920 | 63.044593% |
Noise dominated data is calculated using 1-second bins in cleaned event files. If a bin has >2000 counts, and if more than 50% of those come from <1% of pixels, then it is considered to be noise-dominated and hence unusable.
| Quadrant | # 1 sec bins | Bins with >0 counts | Bins with >2000 counts | High rate bins dominated by noise | Noise dominated (total time) | Noise dominated (detector-on time) | Marked lightcurve |
|---|---|---|---|---|---|---|---|
| A | 7804 | 7804 | 14 | 14 | 0.18% | 0.18% | 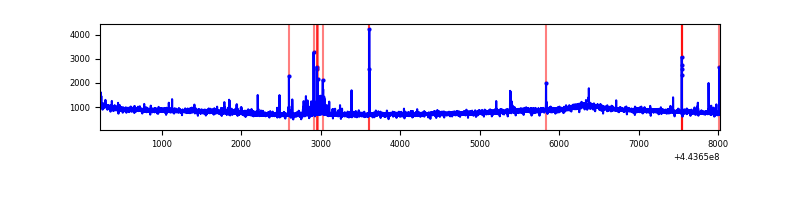 |
| B | 7804 | 7804 | 56 | 56 | 0.72% | 0.72% | 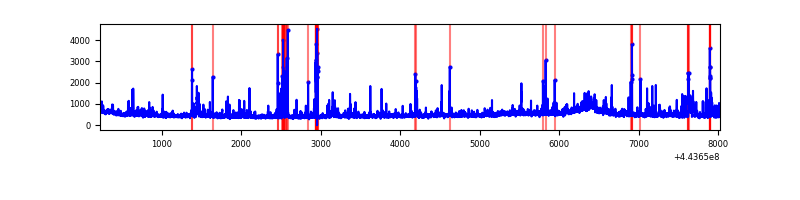 |
| C | 7804 | 7804 | 45 | 45 | 0.58% | 0.58% | 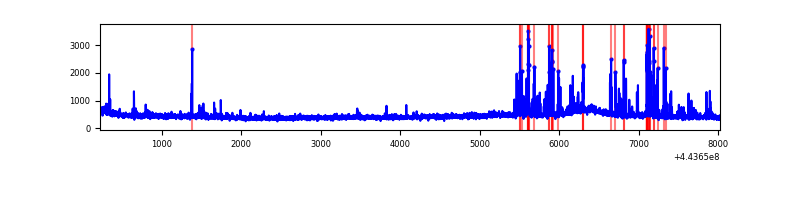 |
| D | 7804 | 7804 | 4429 | 4429 | 56.75% | 56.75% | 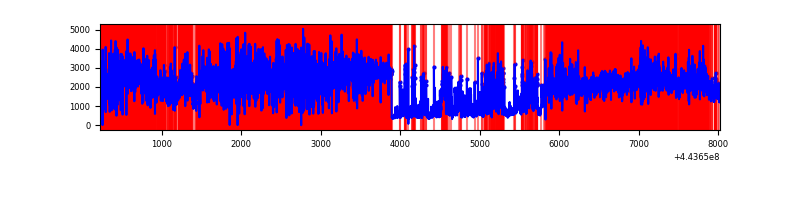 |
Top three noisy pixels from each quadrant. If the there are fewer than three noisy pixels in the level2.evt file, extra rows are filled as -1
| Pixel properties | Quadrant properties | ||||||
|---|---|---|---|---|---|---|---|
| Quadrant | DetID | PixID | Counts | Sigma | Mean | Median | Sigma |
| A | 10 | 83 | 2777044 | 15019.34 | 880 | 861 | 184.8 |
| A | 13 | 248 | 99710 | 534.78 | 880 | 861 | 184.8 |
| A | 0 | 243 | 34034 | 179.47 | 880 | 861 | 184.8 |
| B | 5 | 255 | 284352 | 1643.72 | 879 | 854 | 172.5 |
| B | 0 | 168 | 146593 | 844.99 | 879 | 854 | 172.5 |
| B | 4 | 171 | 58403 | 333.67 | 879 | 854 | 172.5 |
| C | 14 | 254 | 326578 | 1600.82 | 863 | 866 | 203.5 |
| C | 1 | 3 | 37999 | 182.5 | 863 | 866 | 203.5 |
| C | 12 | 2 | 25940 | 123.23 | 863 | 866 | 203.5 |
| D | 13 | 249 | 4063159 | 25994.15 | 610 | 591 | 156.3 |
| D | 13 | 187 | 3561376 | 22783.52 | 610 | 591 | 156.3 |
| D | 12 | 33 | 2458166 | 15724.68 | 610 | 591 | 156.3 |
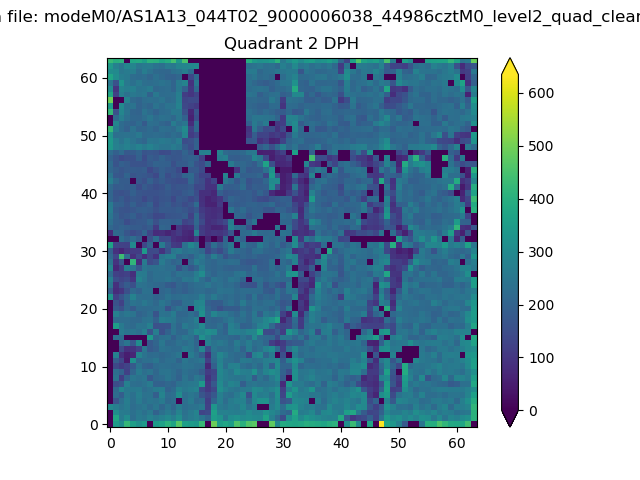
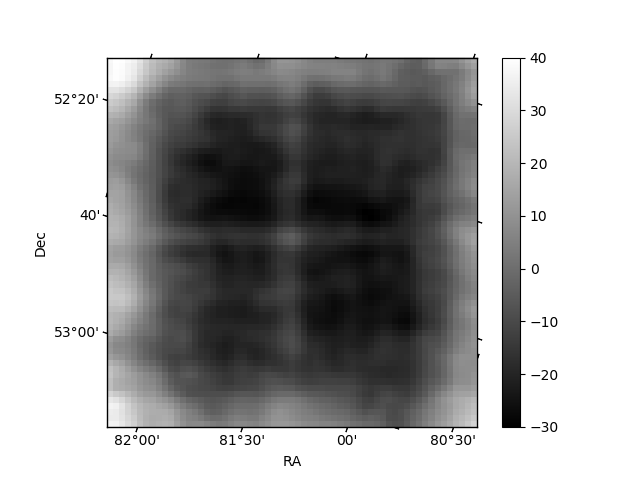
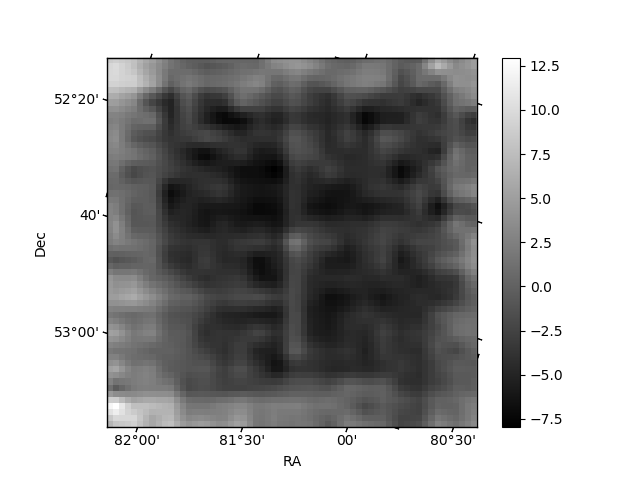
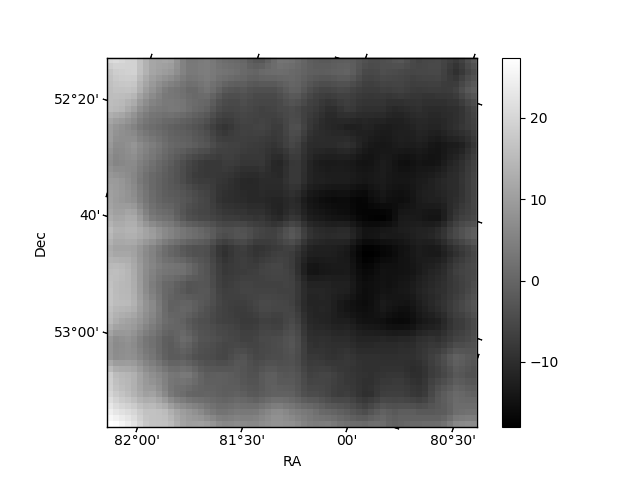
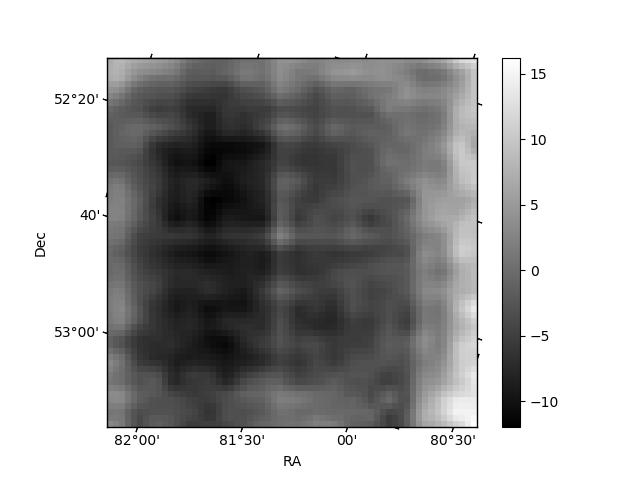
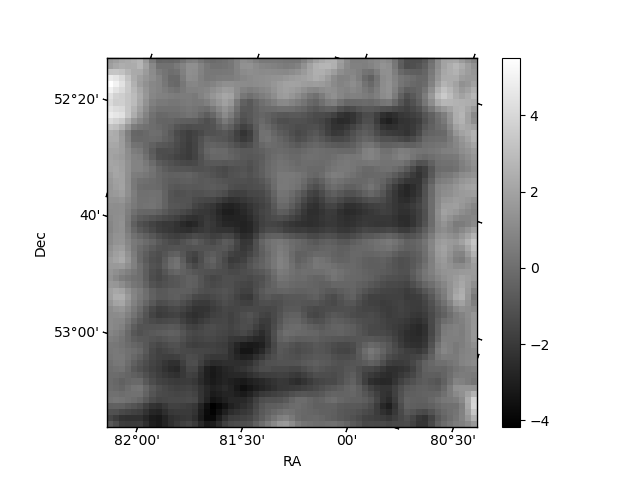
Histogram calculated using DETX and DETY for each event in the final _common_clean file
| Quadrant A | 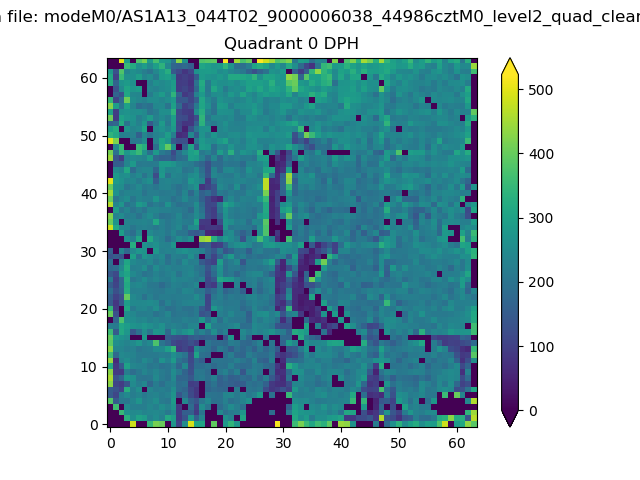 |
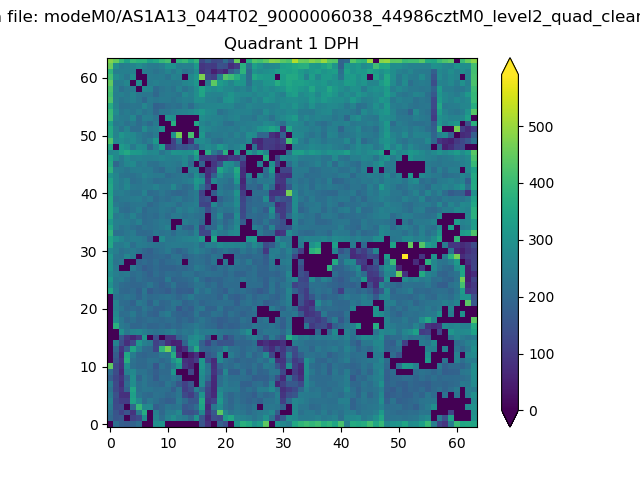 |
Quadrant B |
|---|---|---|---|
| Quadrant D | 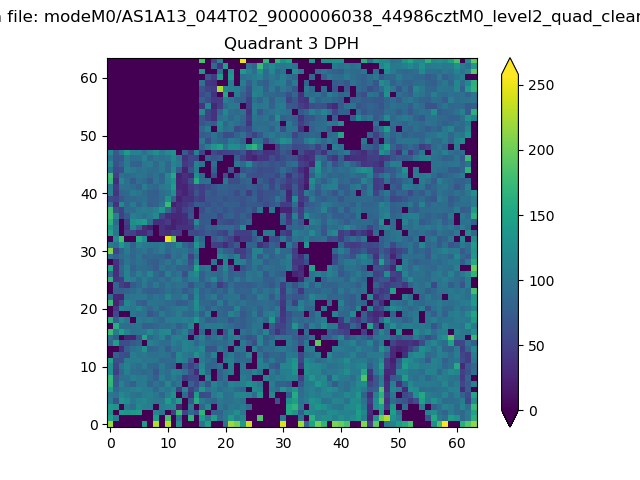 |
 |
Quadrant C |
| Plot type | Count rate plots | Images |
|---|---|---|
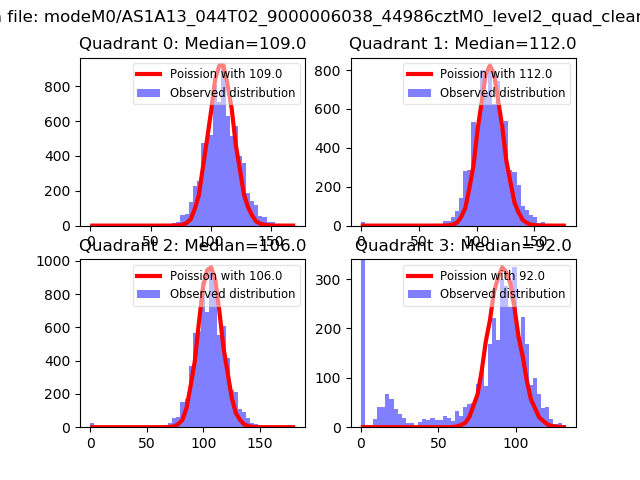
| Comparison with Poisson distribution Blue bars denote a histogram of data divided into 1 sec bins. Red curve is a Poisson curve with rate = median count rate of data. |
 |
 |
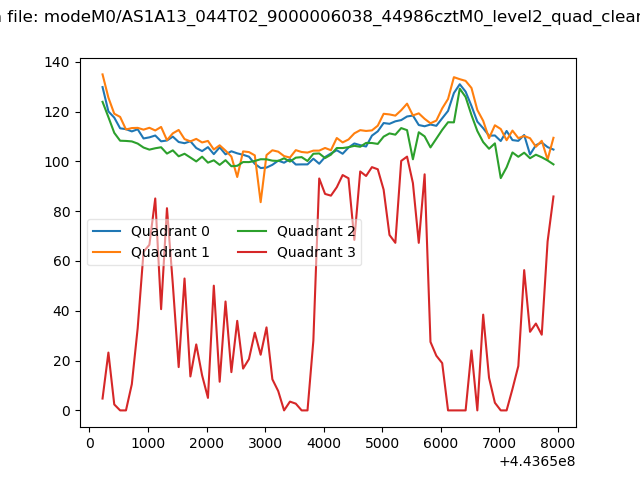
| Quadrant-wise count rates Data is divided into 100 sec bins |
 |
|
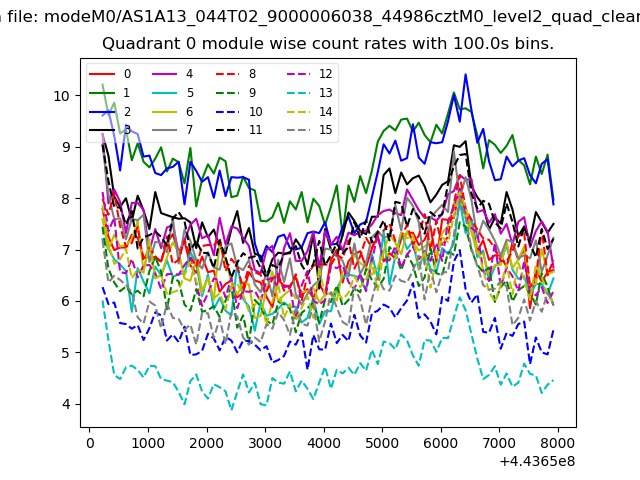
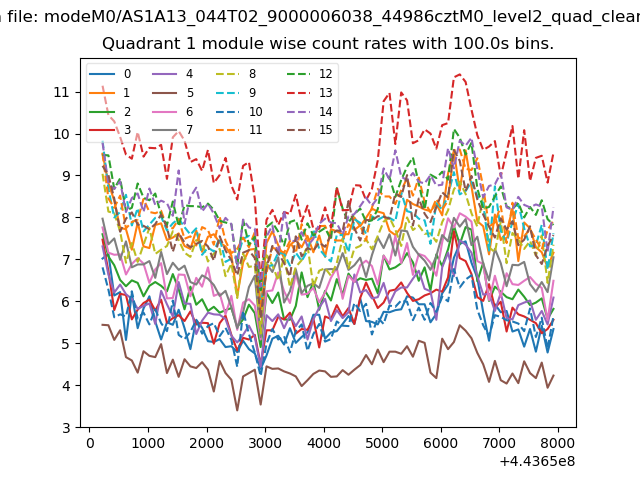
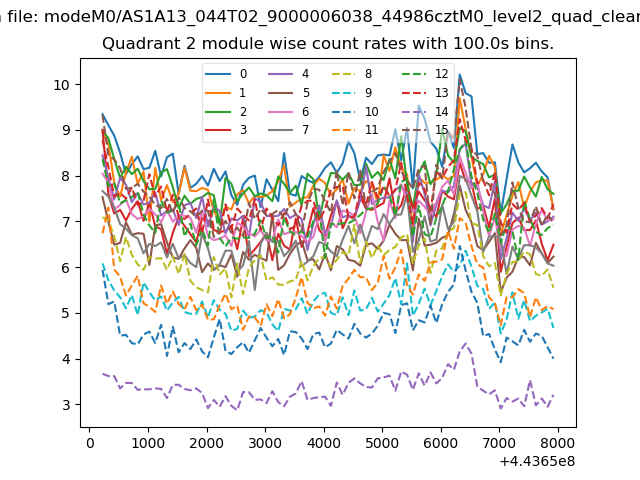
| Module-wise count rates for Quadrant A Data is divided into 100 sec bins |
 |
 |
| Module-wise count rates for Quadrant B Data is divided into 100 sec bins |
 |
 |
| Module-wise count rates for Quadrant C Data is divided into 100 sec bins |
 |
 |
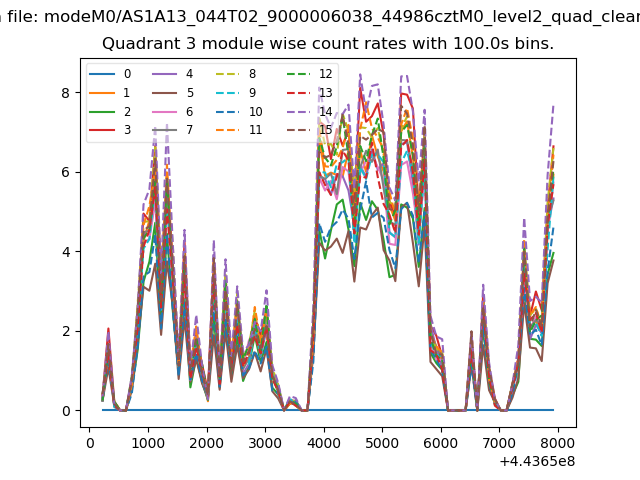
| Module-wise count rates for Quadrant D Data is divided into 100 sec bins |
 |
 |
| Parameter | Plot |
|---|---|
| CZT HV Monitor | 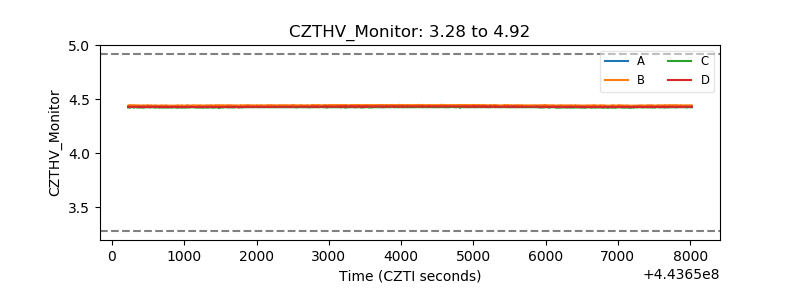 |
| D_VDD | 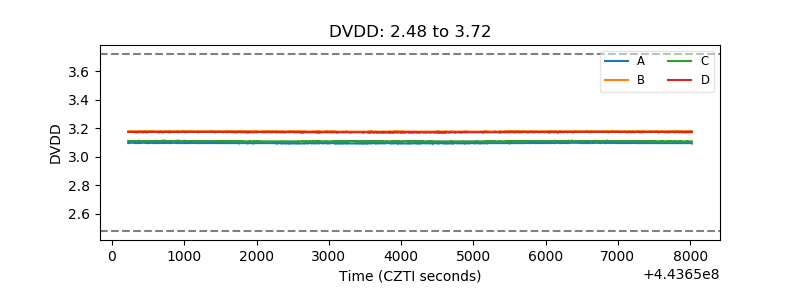 |
| Temperature 1 |  |
| Veto HV Monitor | 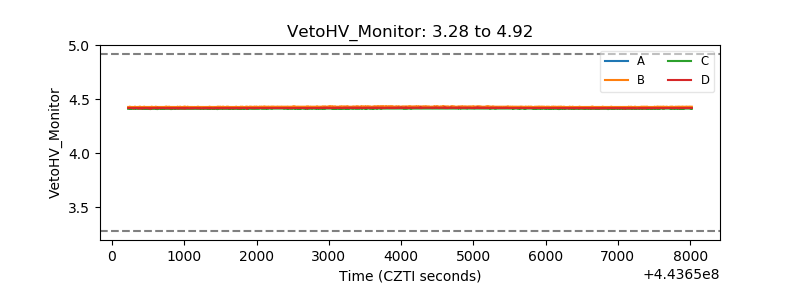 |
| Veto LLD | 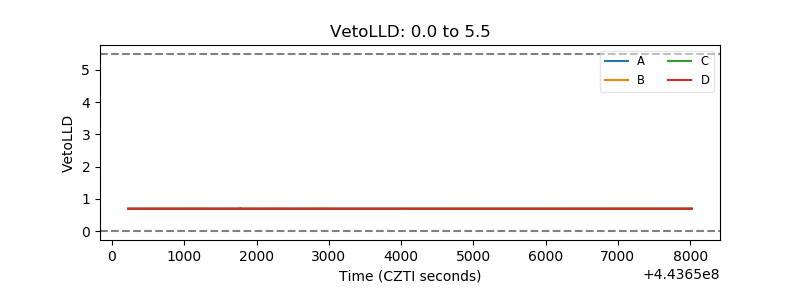 |
| Alpha Counter |  |
| _CPM_Rate | 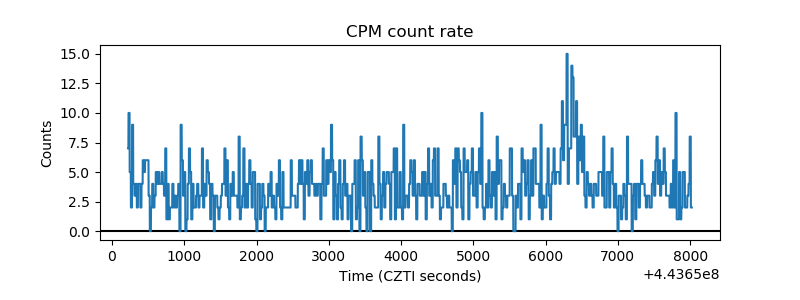 |
| CZT Counter | 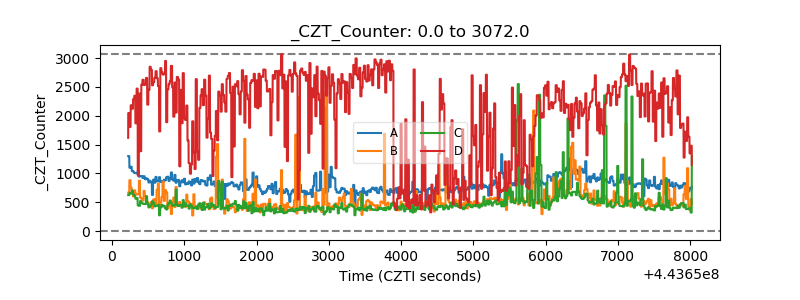 |
| +2.5 Volts monitor |  |
| +5 Volts monitor |  |
| _ROLL_ROT | 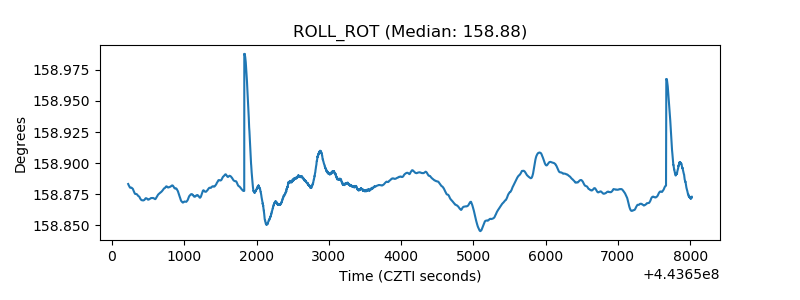 |
| _Roll_DEC | 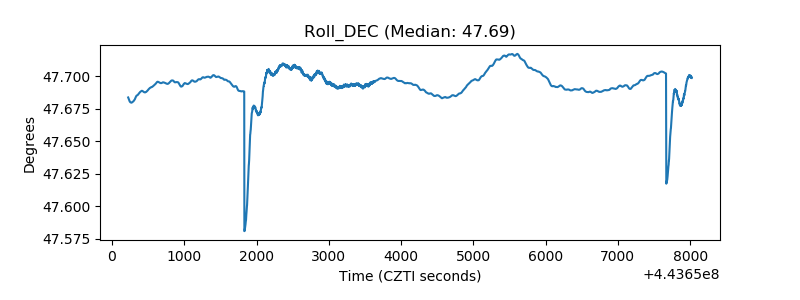 |
| _Roll_RA | 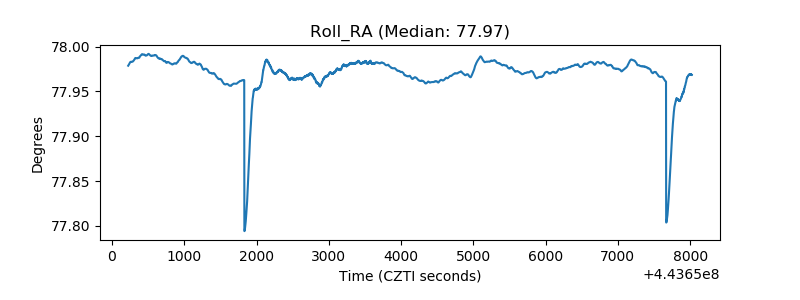 |
| Veto Counter | 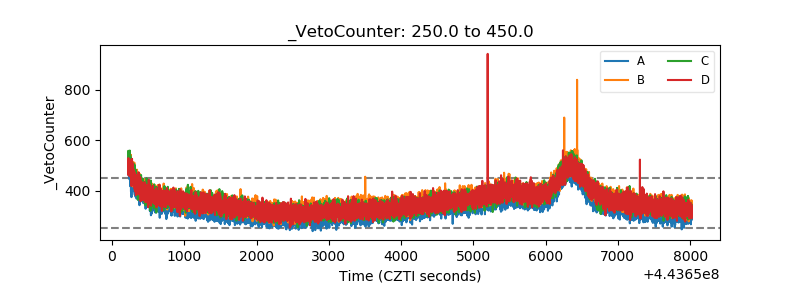 |