| Param | Original file | Final file |
|---|---|---|
| Filename | modeM0/AS1A13_049T06_9000006054_45216cztM0_level2.fits | modeM0/AS1A13_049T06_9000006054_45216cztM0_level2_quad_clean.evt |
| Size (bytes) | 307,203,840 | 56,854,080 |
| Size | 293.0 MB | 54.2 MB |
| Events in quadrant A | 3,017,977 | 389,450 |
| Events in quadrant B | 1,806,509 | 406,418 |
| Events in quadrant C | 1,969,521 | 380,981 |
| Events in quadrant D | 4,291,560 | 285,066 |
| Mode M0 | |||
|---|---|---|---|
| Quadrant | BADHDUFLAG | Total packets | Discarded packets |
| A | 0 | 11589 | 2 |
| B | 0 | 7722 | 0 |
| C | 0 | 8430 | 0 |
| D | 0 | 15263 | 2 |
| Mode SS | |||
|---|---|---|---|
| Quadrant | BADHDUFLAG | Total packets | Discarded packets |
| A | 0 | 74 | 0 |
| B | 0 | 74 | 0 |
| C | 0 | 74 | 0 |
| D | 0 | 74 | 0 |
| Quadrant | Total seconds | Saturated seconds | Saturation percentage |
|---|---|---|---|
| A | 3664 | 42 | 1.146288% |
| B | 3666 | 5 | 0.136388% |
| C | 3666 | 135 | 3.682488% |
| D | 3665 | 873 | 23.819918% |
Noise dominated data is calculated using 1-second bins in cleaned event files. If a bin has >2000 counts, and if more than 50% of those come from <1% of pixels, then it is considered to be noise-dominated and hence unusable.
| Quadrant | # 1 sec bins | Bins with >0 counts | Bins with >2000 counts | High rate bins dominated by noise | Noise dominated (total time) | Noise dominated (detector-on time) | Marked lightcurve |
|---|---|---|---|---|---|---|---|
| A | 3665 | 3665 | 27 | 27 | 0.74% | 0.74% | 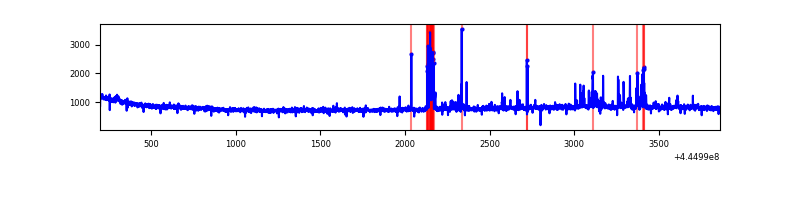 |
| B | 3666 | 3666 | 3 | 3 | 0.08% | 0.08% | 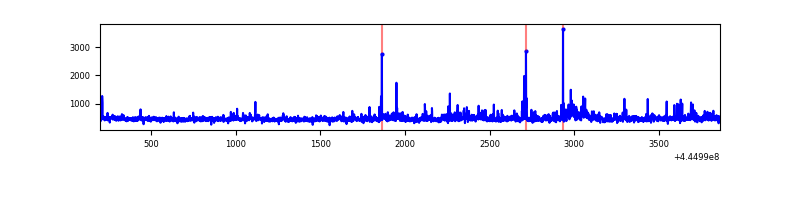 |
| C | 3666 | 3666 | 85 | 85 | 2.32% | 2.32% | 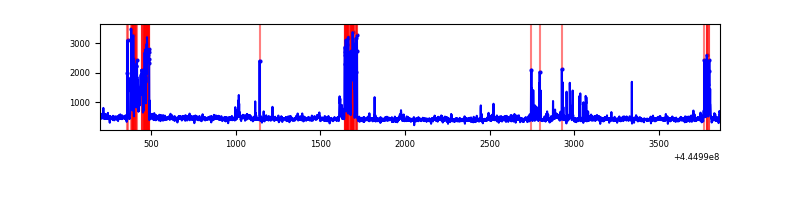 |
| D | 3666 | 3666 | 795 | 795 | 21.69% | 21.69% | 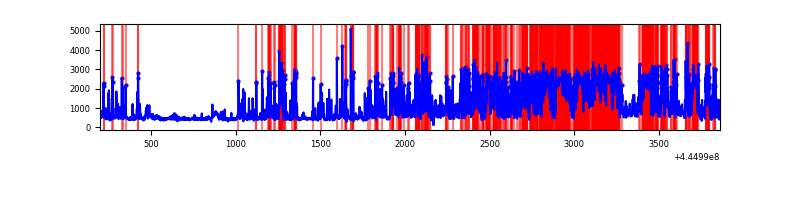 |
Top three noisy pixels from each quadrant. If the there are fewer than three noisy pixels in the level2.evt file, extra rows are filled as -1
| Pixel properties | Quadrant properties | ||||||
|---|---|---|---|---|---|---|---|
| Quadrant | DetID | PixID | Counts | Sigma | Mean | Median | Sigma |
| A | 10 | 83 | 1322888 | 15924.24 | 395 | 386 | 83.0 |
| A | 13 | 248 | 82115 | 984.1 | 395 | 386 | 83.0 |
| A | 15 | 174 | 52455 | 626.96 | 395 | 386 | 83.0 |
| B | 3 | 112 | 169115 | 2183.57 | 395 | 383 | 77.3 |
| B | 4 | 171 | 26967 | 344.02 | 395 | 383 | 77.3 |
| B | 5 | 32 | 17256 | 218.35 | 395 | 383 | 77.3 |
| C | 12 | 2 | 355740 | 3890.86 | 386 | 388 | 91.3 |
| C | 15 | 208 | 52759 | 573.43 | 386 | 388 | 91.3 |
| C | 3 | 233 | 37126 | 402.26 | 386 | 388 | 91.3 |
| D | 13 | 249 | 2406514 | 26481.74 | 353 | 342 | 90.9 |
| D | 1 | 52 | 198815 | 2184.35 | 353 | 342 | 90.9 |
| D | 5 | 235 | 83951 | 920.18 | 353 | 342 | 90.9 |
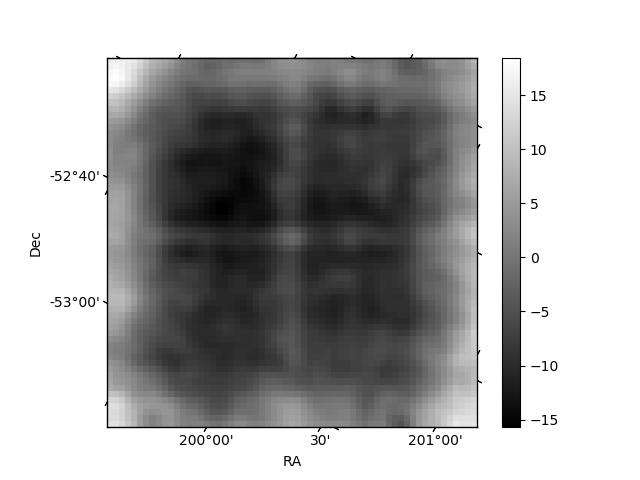
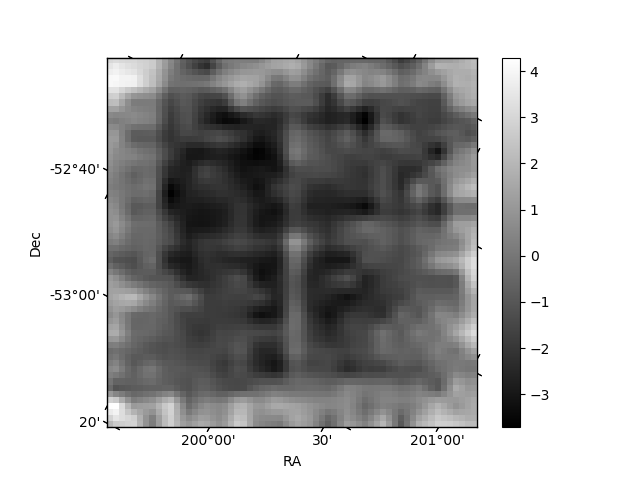
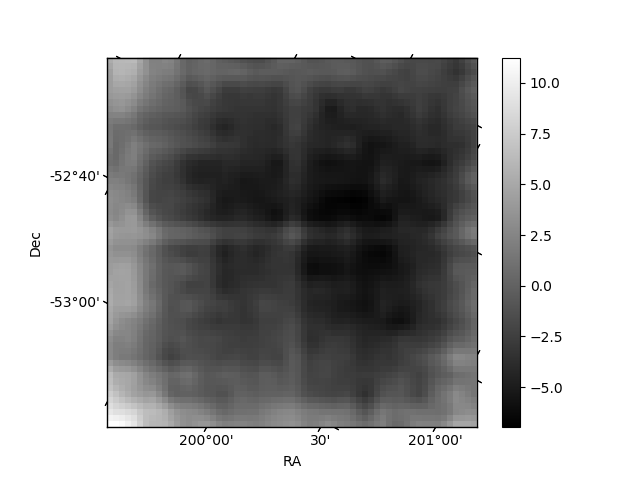
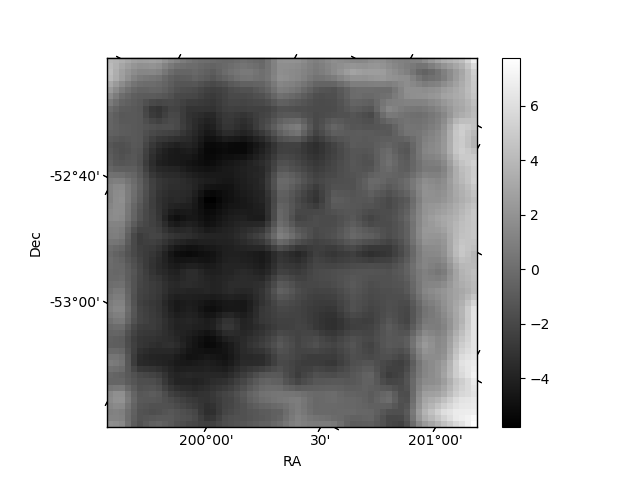
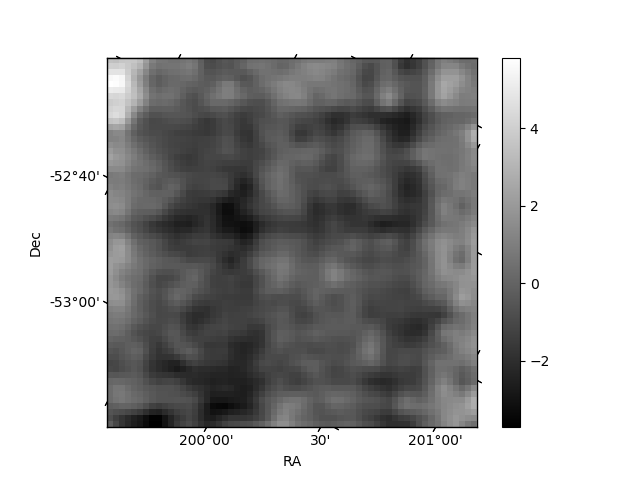
Histogram calculated using DETX and DETY for each event in the final _common_clean file
| Quadrant A | 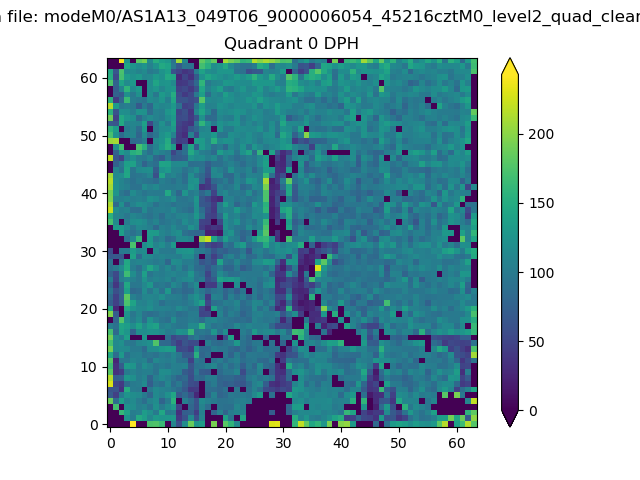 |
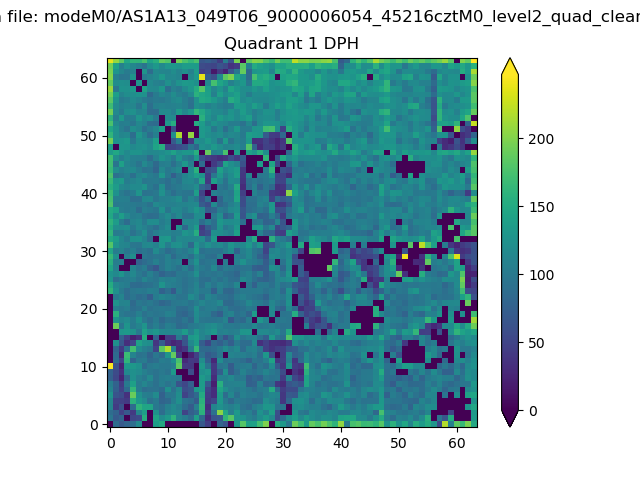 |
Quadrant B |
|---|---|---|---|
| Quadrant D | 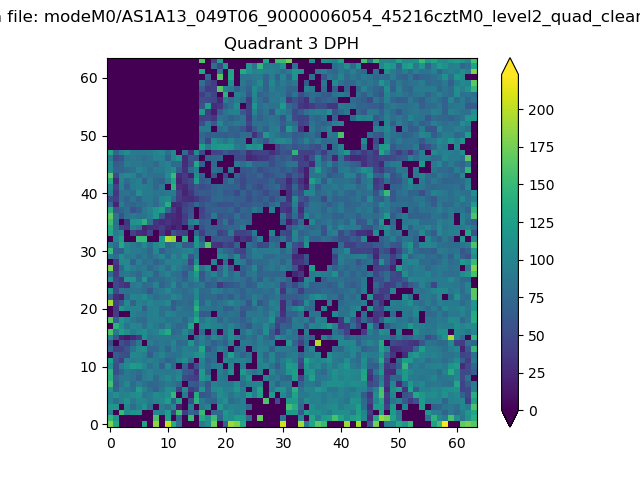 |
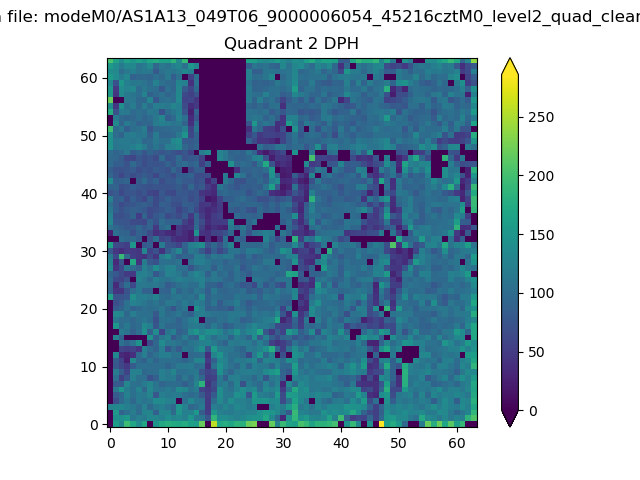 |
Quadrant C |
| Plot type | Count rate plots | Images |
|---|---|---|
| Comparison with Poisson distribution Blue bars denote a histogram of data divided into 1 sec bins. Red curve is a Poisson curve with rate = median count rate of data. |
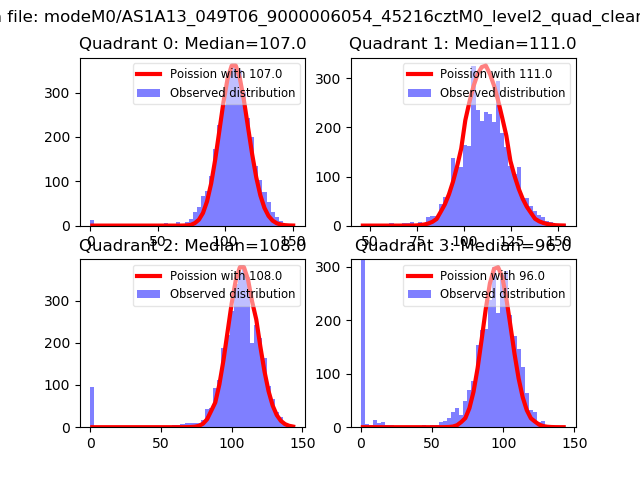 |
 |
| Quadrant-wise count rates Data is divided into 100 sec bins |
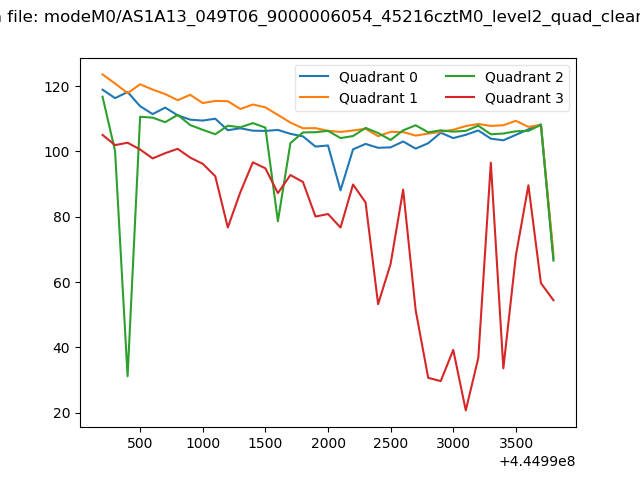 |
|
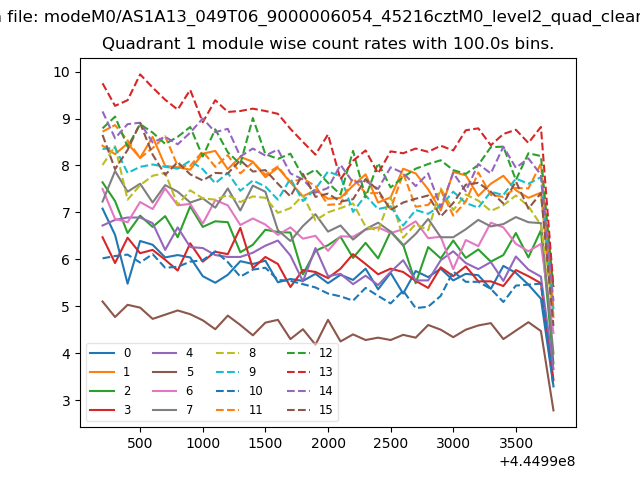
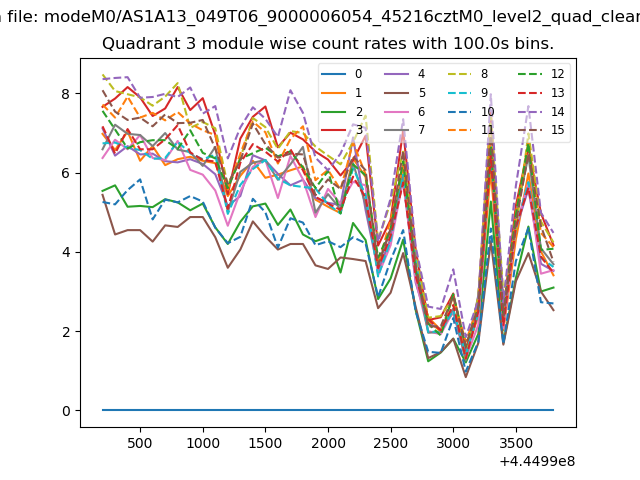
| Module-wise count rates for Quadrant A Data is divided into 100 sec bins |
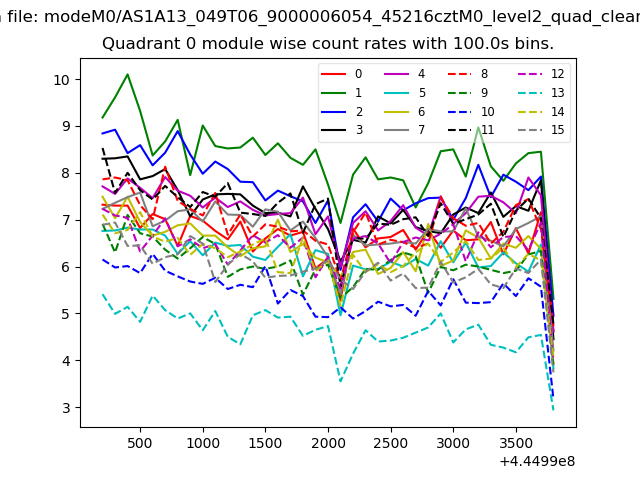 |
 |
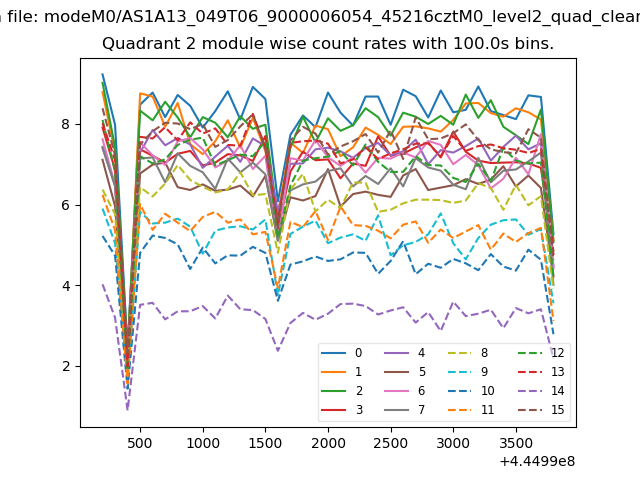
| Module-wise count rates for Quadrant B Data is divided into 100 sec bins |
 |
 |
| Module-wise count rates for Quadrant C Data is divided into 100 sec bins |
 |
 |
| Module-wise count rates for Quadrant D Data is divided into 100 sec bins |
 |
 |
| Parameter | Plot |
|---|---|
| CZT HV Monitor | 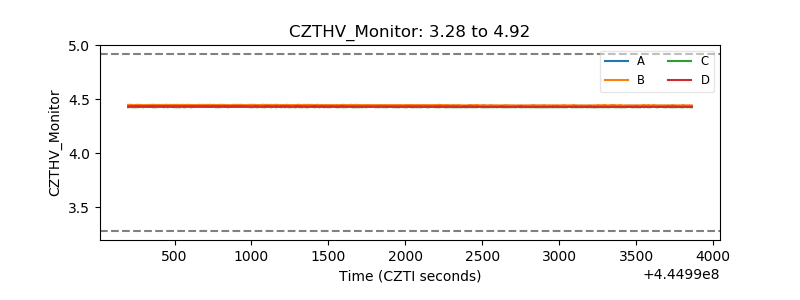 |
| D_VDD | 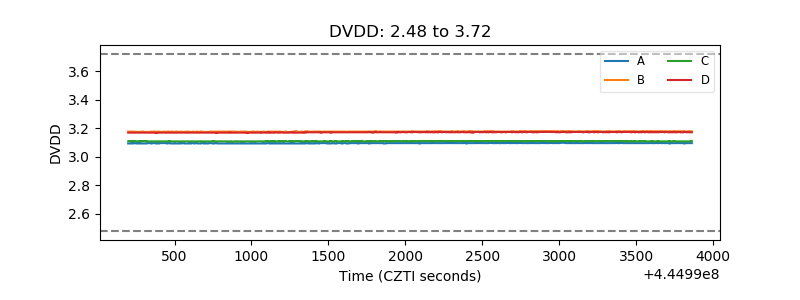 |
| Temperature 1 | 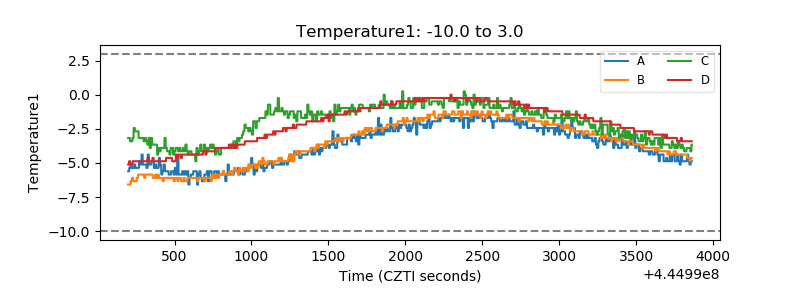 |
| Veto HV Monitor | 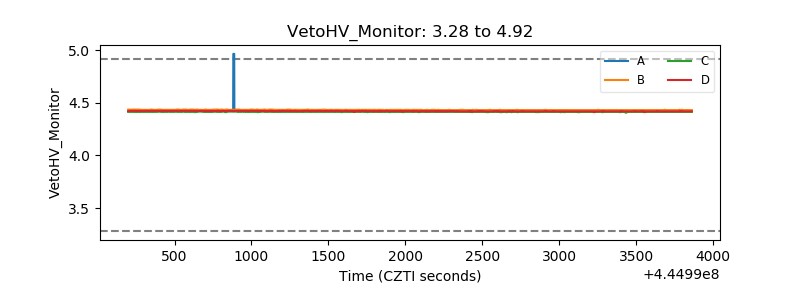 |
| Veto LLD | 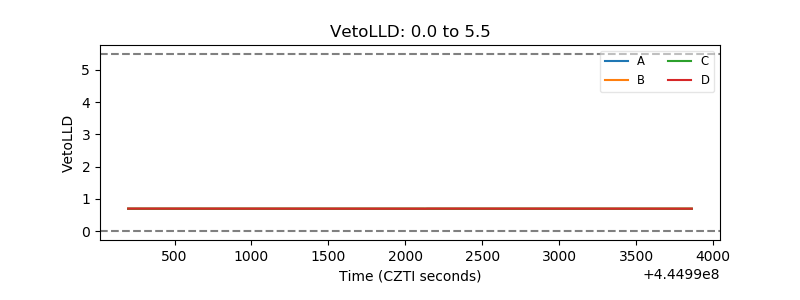 |
| Alpha Counter | 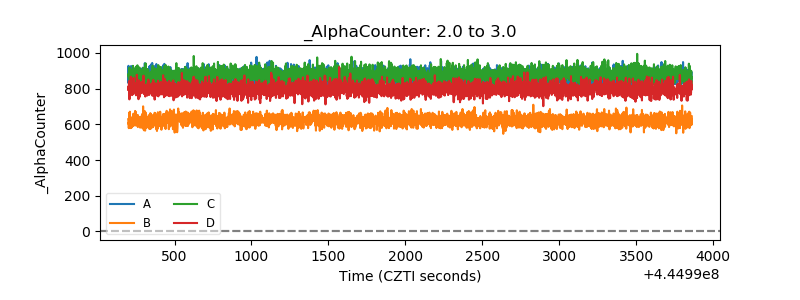 |
| _CPM_Rate | 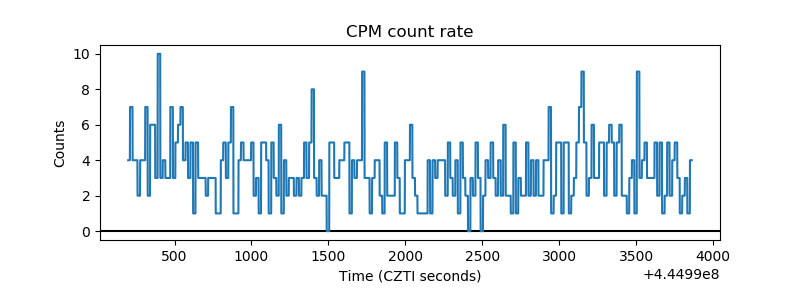 |
| CZT Counter | 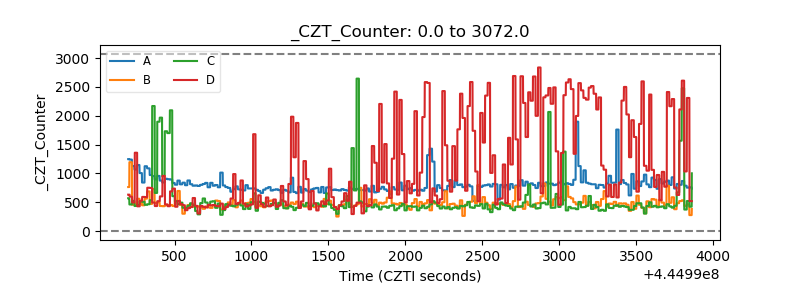 |
| +2.5 Volts monitor | 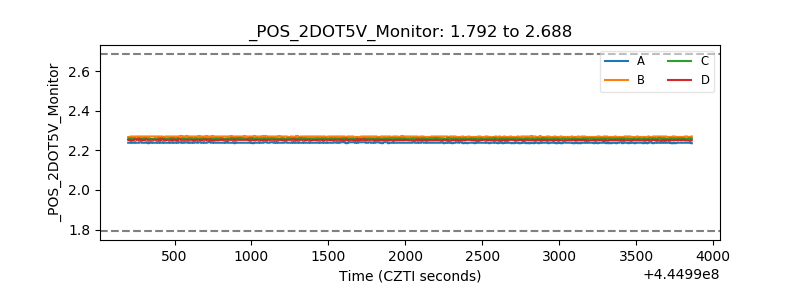 |
| +5 Volts monitor | 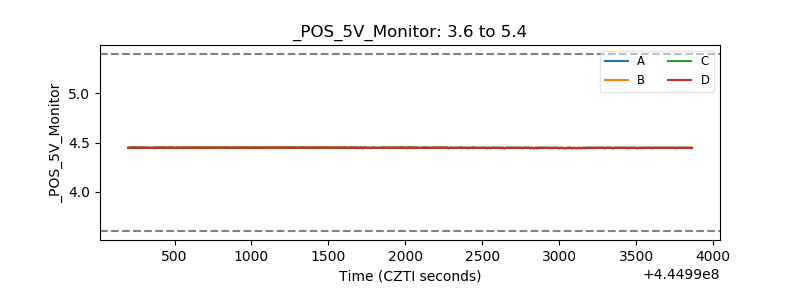 |
| _ROLL_ROT | 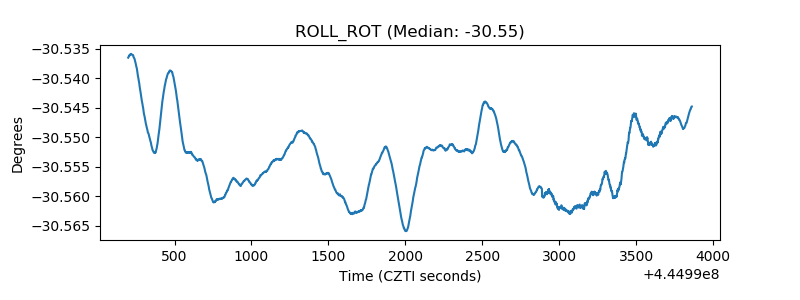 |
| _Roll_DEC | 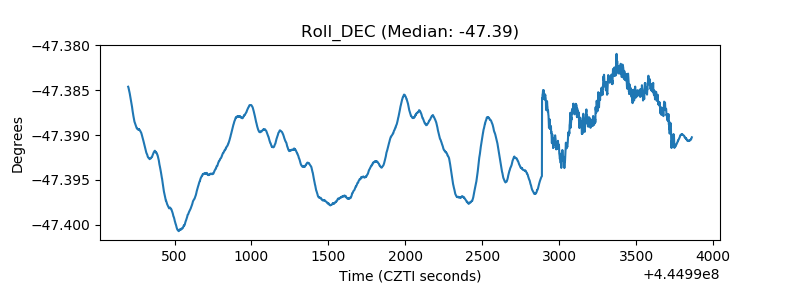 |
| _Roll_RA | 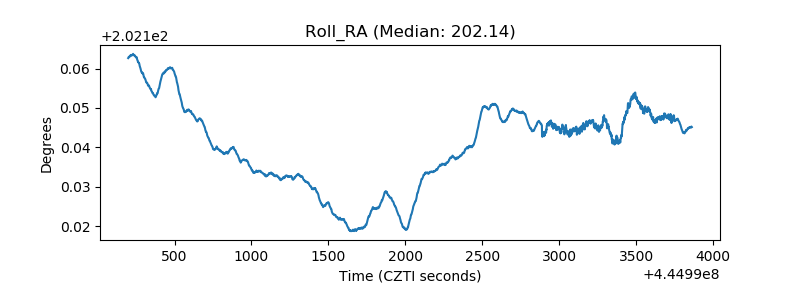 |
| Veto Counter | 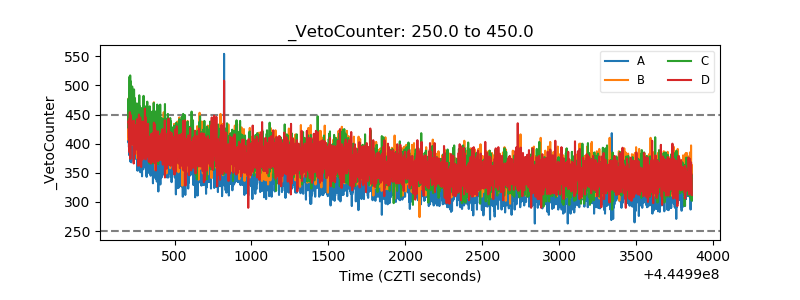 |