| Param | Original file | Final file |
|---|---|---|
| Filename | modeM0/AS1A13_093T12_9000006118_45678cztM0_level2.fits | modeM0/AS1A13_093T12_9000006118_45678cztM0_level2_quad_clean.evt |
| Size (bytes) | 193,098,240 | 43,554,240 |
| Size | 184.2 MB | 41.5 MB |
| Events in quadrant A | 2,289,536 | 301,572 |
| Events in quadrant B | 1,450,164 | 300,856 |
| Events in quadrant C | 1,363,758 | 279,808 |
| Events in quadrant D | 1,848,757 | 257,632 |
| Mode M0 | |||
|---|---|---|---|
| Quadrant | BADHDUFLAG | Total packets | Discarded packets |
| A | 0 | 8119 | 0 |
| B | 0 | 5900 | 0 |
| C | 0 | 5741 | 0 |
| D | 0 | 7198 | 0 |
| Mode SS | |||
|---|---|---|---|
| Quadrant | BADHDUFLAG | Total packets | Discarded packets |
| A | 0 | 50 | 0 |
| B | 0 | 50 | 0 |
| C | 0 | 50 | 0 |
| D | 0 | 50 | 0 |
| Quadrant | Total seconds | Saturated seconds | Saturation percentage |
|---|---|---|---|
| A | 2492 | 29 | 1.163724% |
| B | 2492 | 62 | 2.487961% |
| C | 2493 | 65 | 2.607300% |
| D | 2493 | 103 | 4.131568% |
Noise dominated data is calculated using 1-second bins in cleaned event files. If a bin has >2000 counts, and if more than 50% of those come from <1% of pixels, then it is considered to be noise-dominated and hence unusable.
| Quadrant | # 1 sec bins | Bins with >0 counts | Bins with >2000 counts | High rate bins dominated by noise | Noise dominated (total time) | Noise dominated (detector-on time) | Marked lightcurve |
|---|---|---|---|---|---|---|---|
| A | 2492 | 2492 | 22 | 22 | 0.88% | 0.88% | 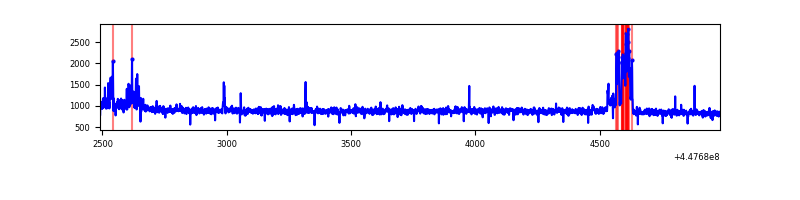 |
| B | 2492 | 2492 | 50 | 50 | 2.01% | 2.01% | 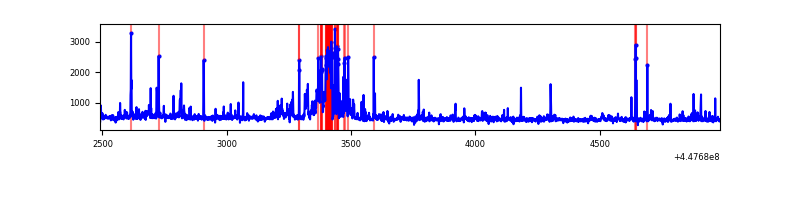 |
| C | 2493 | 2493 | 60 | 60 | 2.41% | 2.41% | 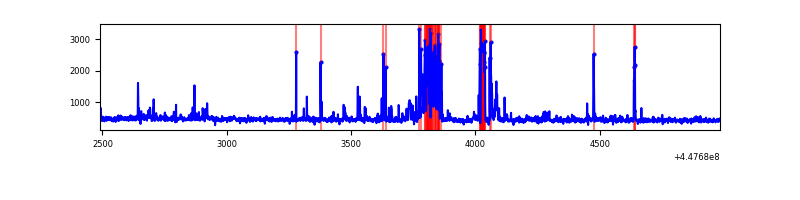 |
| D | 2493 | 2493 | 53 | 53 | 2.13% | 2.13% | 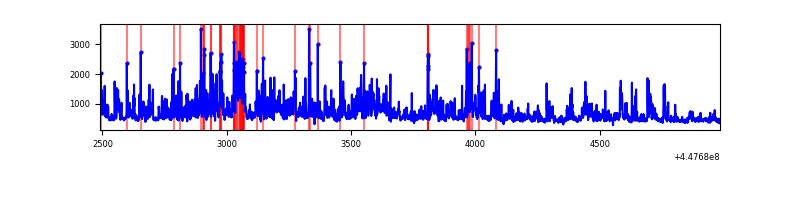 |
Top three noisy pixels from each quadrant. If the there are fewer than three noisy pixels in the level2.evt file, extra rows are filled as -1
| Pixel properties | Quadrant properties | ||||||
|---|---|---|---|---|---|---|---|
| Quadrant | DetID | PixID | Counts | Sigma | Mean | Median | Sigma |
| A | 10 | 83 | 1052261 | 17404.38 | 289 | 284 | 60.4 |
| A | 2 | 79 | 78919 | 1300.97 | 289 | 284 | 60.4 |
| A | 13 | 248 | 36096 | 592.49 | 289 | 284 | 60.4 |
| B | 5 | 172 | 188169 | 3377.71 | 281 | 273 | 55.6 |
| B | 15 | 201 | 38449 | 686.27 | 281 | 273 | 55.6 |
| B | 15 | 54 | 21323 | 378.41 | 281 | 273 | 55.6 |
| C | 14 | 254 | 253009 | 3875.12 | 275 | 277 | 65.2 |
| C | 2 | 14 | 29107 | 442.05 | 275 | 277 | 65.2 |
| C | 8 | 111 | 3174 | 44.42 | 275 | 277 | 65.2 |
| D | 1 | 52 | 507443 | 7064.13 | 279 | 269 | 71.8 |
| D | 13 | 249 | 110065 | 1529.28 | 279 | 269 | 71.8 |
| D | 2 | 249 | 57282 | 794.09 | 279 | 269 | 71.8 |
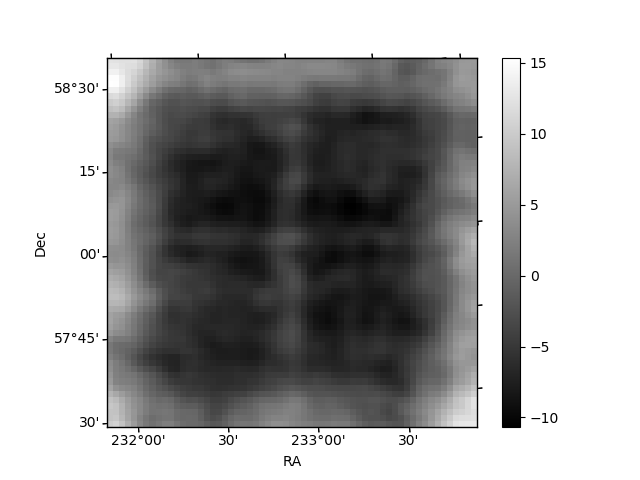
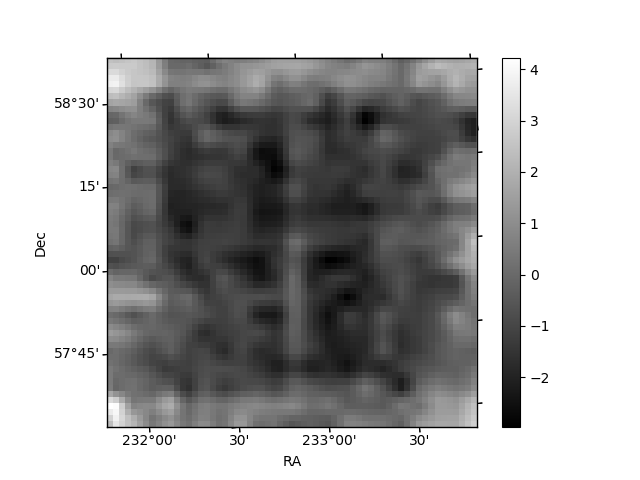
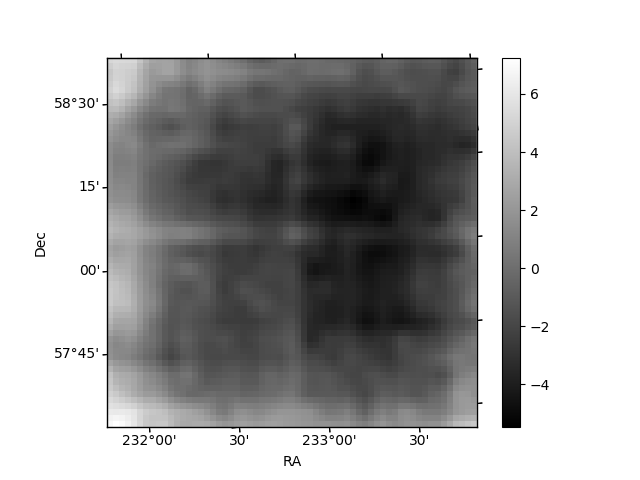
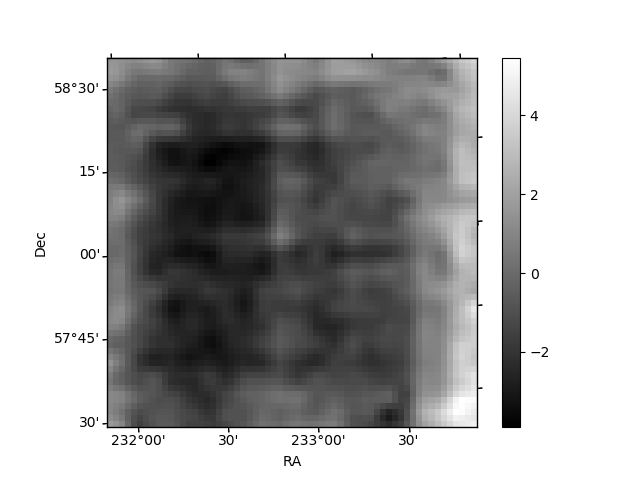
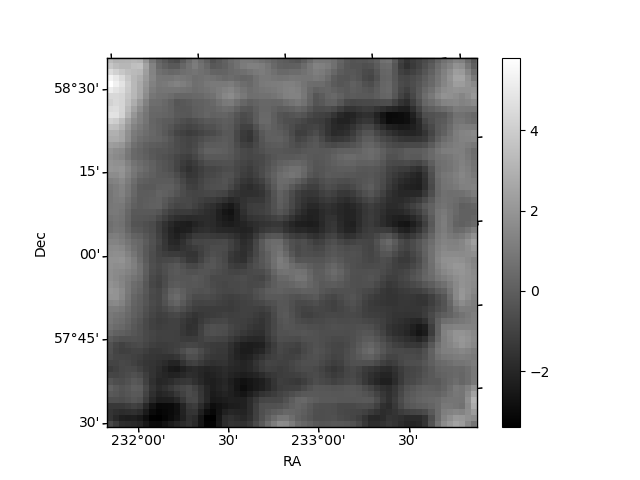
Histogram calculated using DETX and DETY for each event in the final _common_clean file
| Quadrant A | 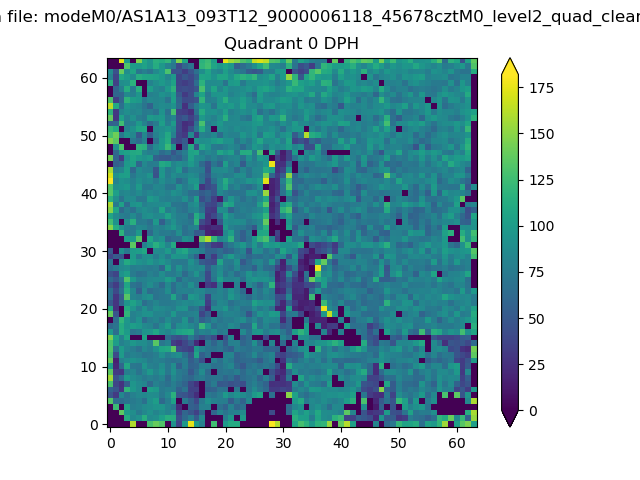 |
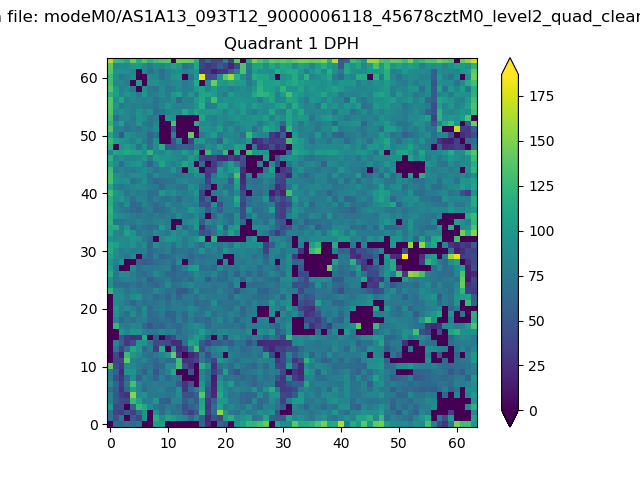 |
Quadrant B |
|---|---|---|---|
| Quadrant D | 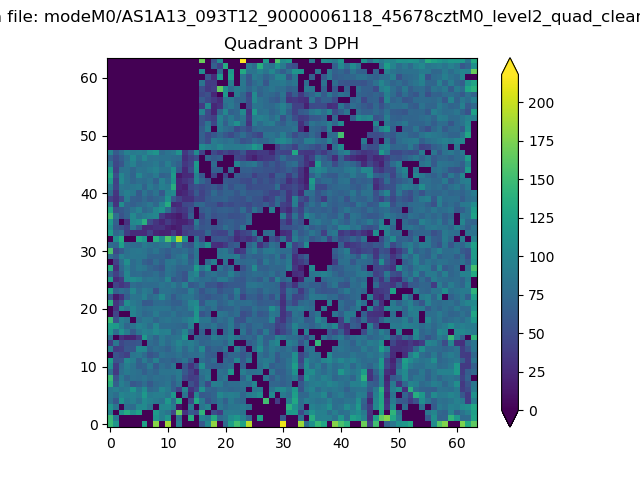 |
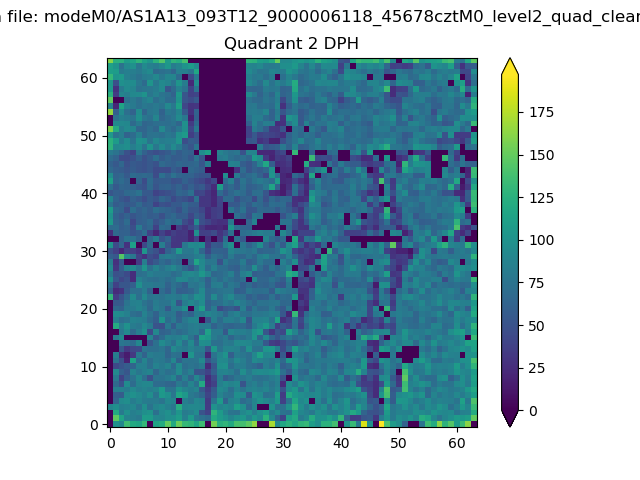 |
Quadrant C |
| Plot type | Count rate plots | Images |
|---|---|---|
| Comparison with Poisson distribution Blue bars denote a histogram of data divided into 1 sec bins. Red curve is a Poisson curve with rate = median count rate of data. |
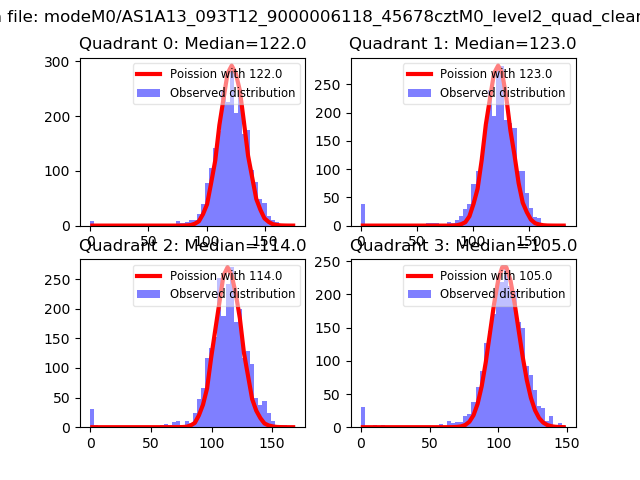 |
 |
| Quadrant-wise count rates Data is divided into 100 sec bins |
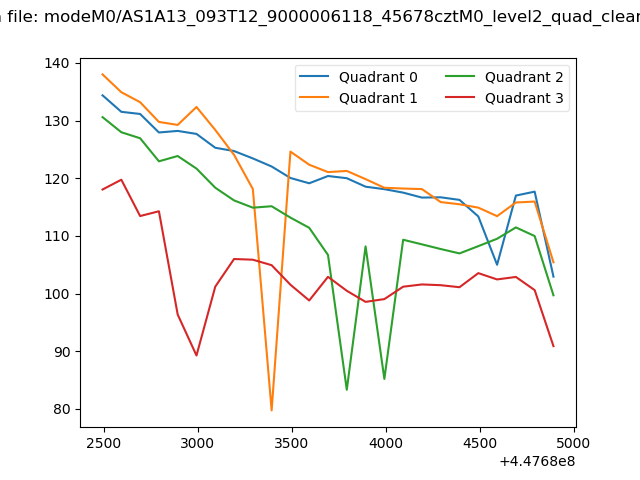 |
|
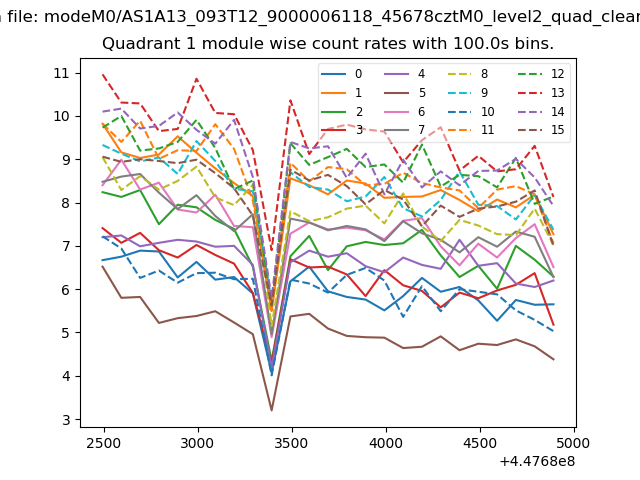
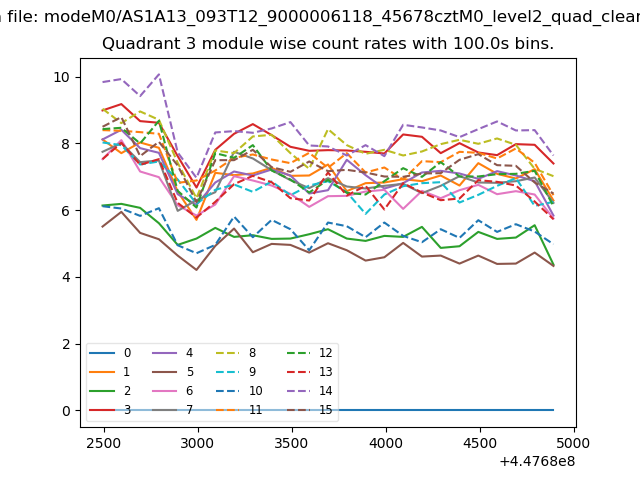
| Module-wise count rates for Quadrant A Data is divided into 100 sec bins |
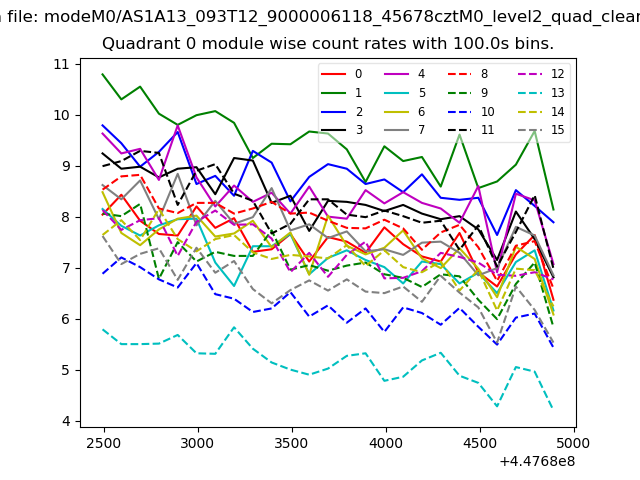 |
 |
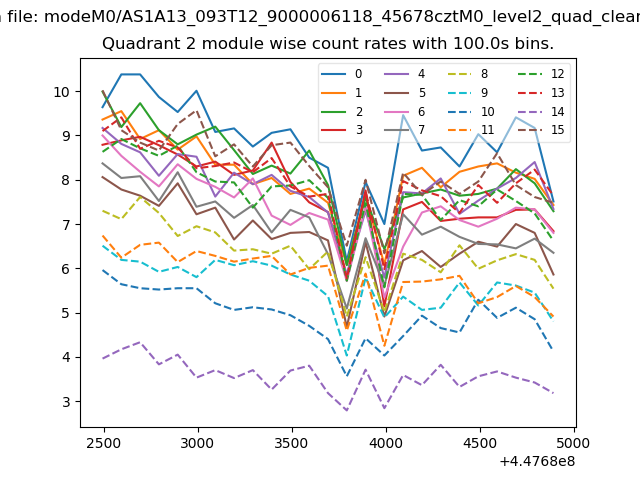
| Module-wise count rates for Quadrant B Data is divided into 100 sec bins |
 |
 |
| Module-wise count rates for Quadrant C Data is divided into 100 sec bins |
 |
 |
| Module-wise count rates for Quadrant D Data is divided into 100 sec bins |
 |
 |
| Parameter | Plot |
|---|---|
| CZT HV Monitor | 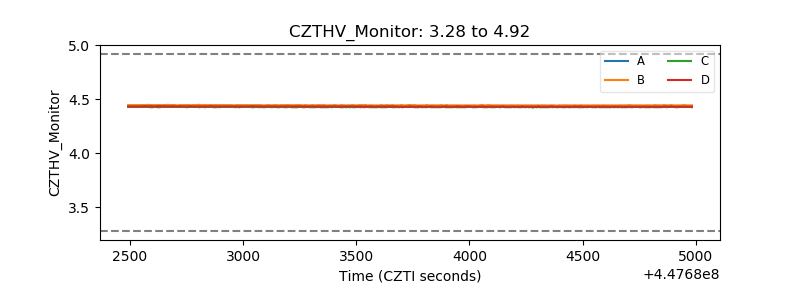 |
| D_VDD | 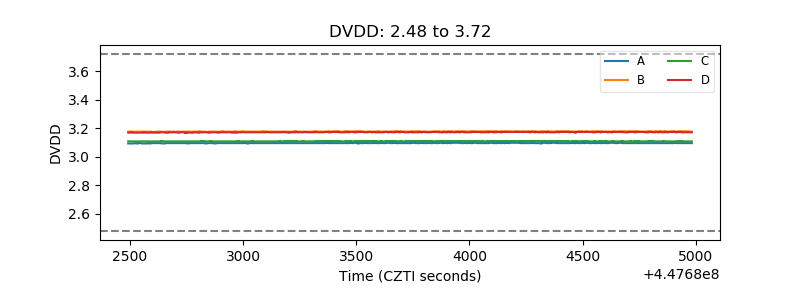 |
| Temperature 1 | 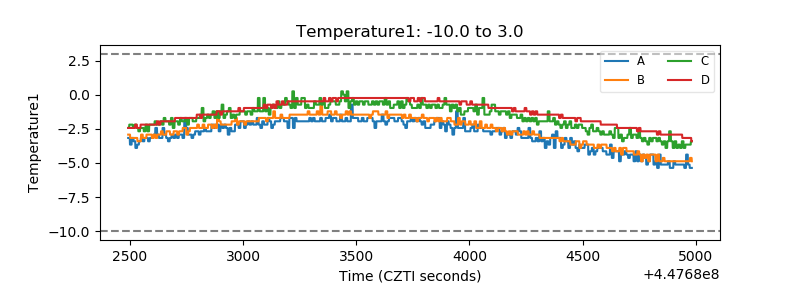 |
| Veto HV Monitor | 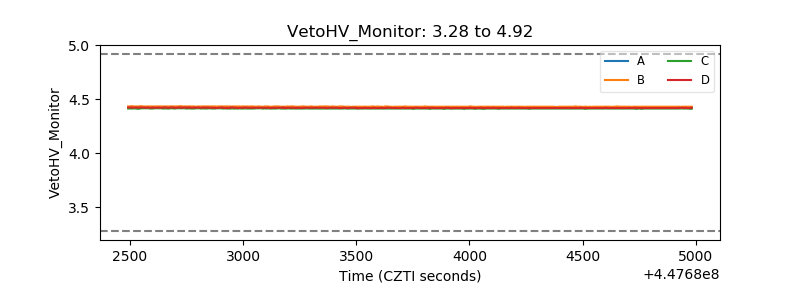 |
| Veto LLD | 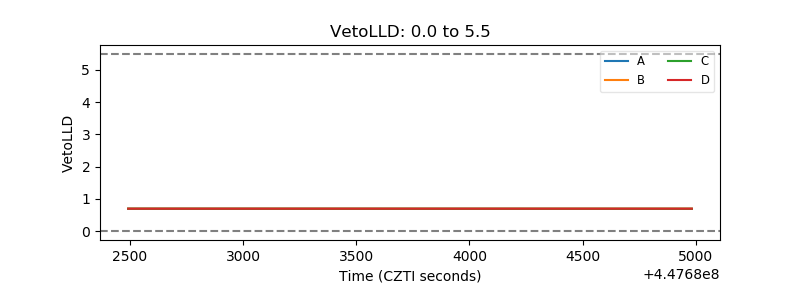 |
| Alpha Counter | 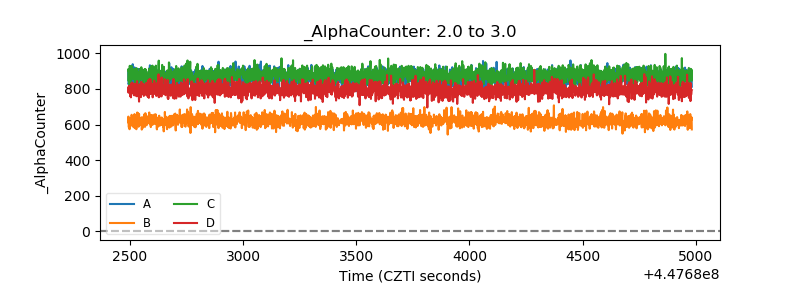 |
| _CPM_Rate | 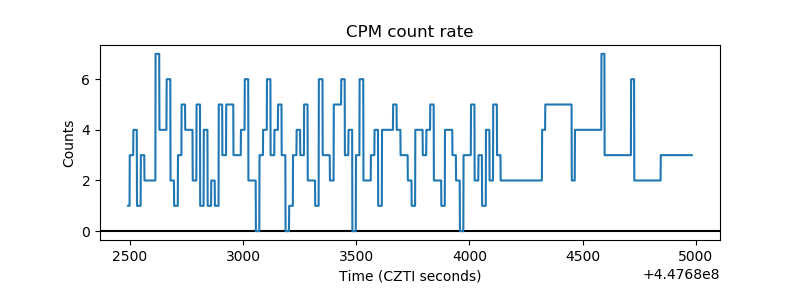 |
| CZT Counter | 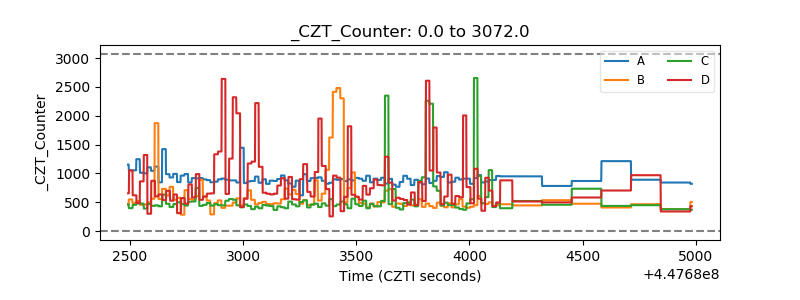 |
| +2.5 Volts monitor | 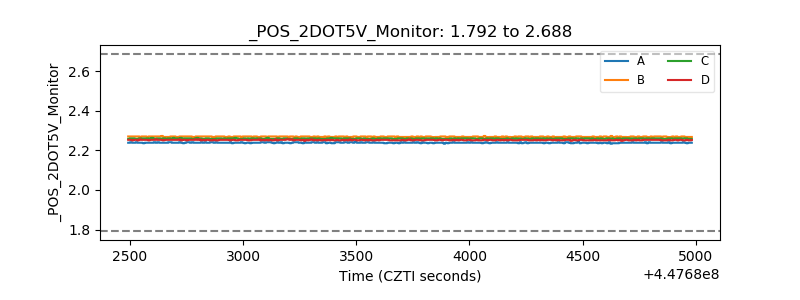 |
| +5 Volts monitor | 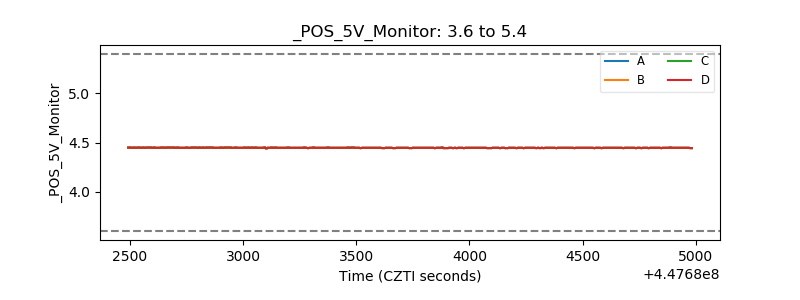 |
| _ROLL_ROT | 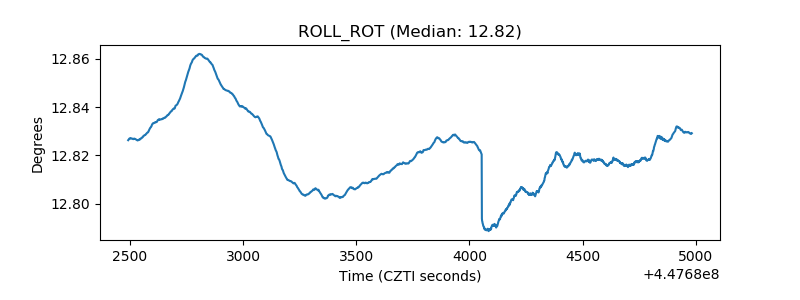 |
| _Roll_DEC | 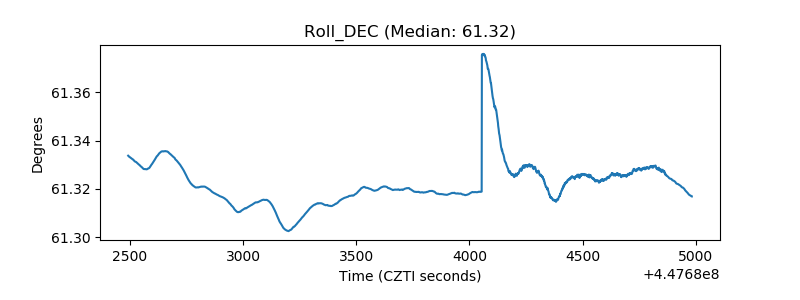 |
| _Roll_RA | 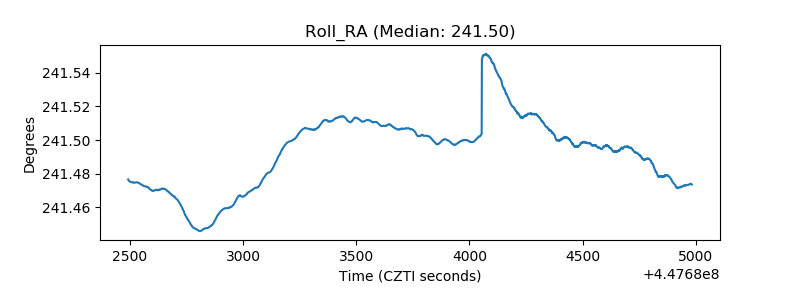 |
| Veto Counter | 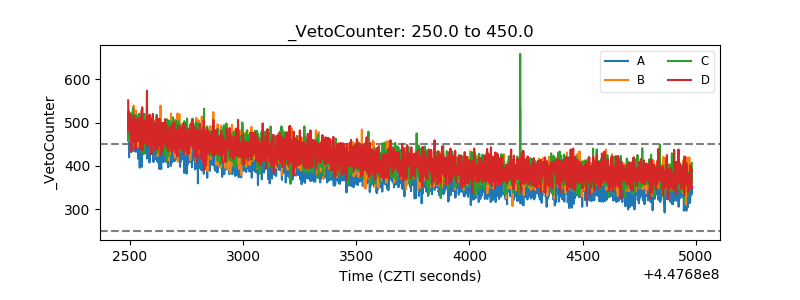 |