| Param | Original file | Final file |
|---|---|---|
| Filename | modeM0/AS1A13_028T01_9000006122_45697cztM0_level2.fits | modeM0/AS1A13_028T01_9000006122_45697cztM0_level2_quad_clean.evt |
| Size (bytes) | 545,106,240 | 121,259,520 |
| Size | 519.9 MB | 115.6 MB |
| Events in quadrant A | 6,485,786 | 813,773 |
| Events in quadrant B | 3,890,478 | 829,045 |
| Events in quadrant C | 3,644,687 | 797,906 |
| Events in quadrant D | 5,573,207 | 706,138 |
| Mode SS | |||
|---|---|---|---|
| Quadrant | BADHDUFLAG | Total packets | Discarded packets |
| A | 0 | 152 | 0 |
| B | 0 | 152 | 0 |
| C | 0 | 152 | 0 |
| D | 0 | 152 | 0 |
| Mode M0 | |||
|---|---|---|---|
| Quadrant | BADHDUFLAG | Total packets | Discarded packets |
| A | 0 | 24308 | 0 |
| B | 0 | 16774 | 0 |
| C | 0 | 16235 | 0 |
| D | 0 | 21705 | 0 |
| Quadrant | Total seconds | Saturated seconds | Saturation percentage |
|---|---|---|---|
| A | 7532 | 105 | 1.394052% |
| B | 7533 | 96 | 1.274393% |
| C | 7533 | 47 | 0.623921% |
| D | 7533 | 387 | 5.137395% |
Noise dominated data is calculated using 1-second bins in cleaned event files. If a bin has >2000 counts, and if more than 50% of those come from <1% of pixels, then it is considered to be noise-dominated and hence unusable.
| Quadrant | # 1 sec bins | Bins with >0 counts | Bins with >2000 counts | High rate bins dominated by noise | Noise dominated (total time) | Noise dominated (detector-on time) | Marked lightcurve |
|---|---|---|---|---|---|---|---|
| A | 7532 | 7532 | 4 | 4 | 0.05% | 0.05% | 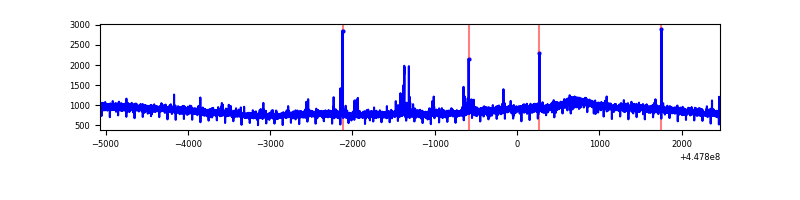 |
| B | 7533 | 7533 | 51 | 51 | 0.68% | 0.68% | 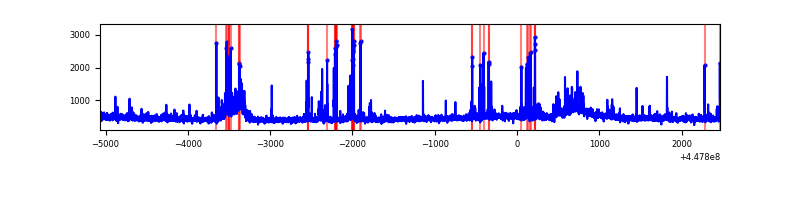 |
| C | 7533 | 7533 | 45 | 45 | 0.60% | 0.60% | 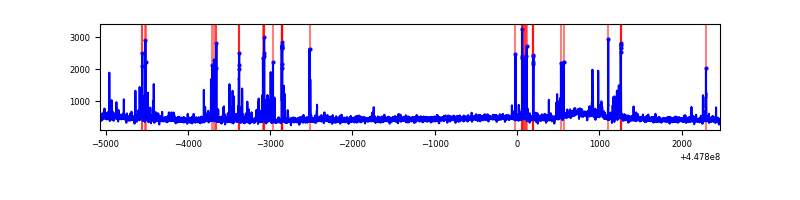 |
| D | 7533 | 7533 | 365 | 365 | 4.85% | 4.85% | 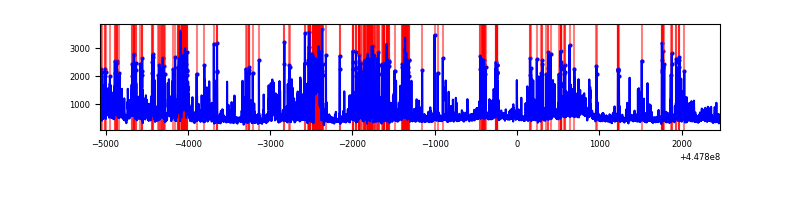 |
Top three noisy pixels from each quadrant. If the there are fewer than three noisy pixels in the level2.evt file, extra rows are filled as -1
| Pixel properties | Quadrant properties | ||||||
|---|---|---|---|---|---|---|---|
| Quadrant | DetID | PixID | Counts | Sigma | Mean | Median | Sigma |
| A | 10 | 83 | 3149370 | 17902.28 | 842 | 824 | 175.9 |
| A | 13 | 248 | 68833 | 386.69 | 842 | 824 | 175.9 |
| A | 13 | 254 | 13198 | 70.36 | 842 | 824 | 175.9 |
| B | 5 | 172 | 206737 | 1258.31 | 840 | 814 | 163.7 |
| B | 12 | 18 | 126467 | 767.81 | 840 | 814 | 163.7 |
| B | 3 | 112 | 110018 | 667.3 | 840 | 814 | 163.7 |
| C | 14 | 254 | 263244 | 1350.66 | 822 | 828 | 194.3 |
| C | 3 | 233 | 107369 | 548.37 | 822 | 828 | 194.3 |
| C | 12 | 2 | 30537 | 152.91 | 822 | 828 | 194.3 |
| D | 1 | 52 | 1612946 | 7936.49 | 806 | 782 | 203.1 |
| D | 13 | 249 | 175179 | 858.54 | 806 | 782 | 203.1 |
| D | 2 | 249 | 169565 | 830.9 | 806 | 782 | 203.1 |
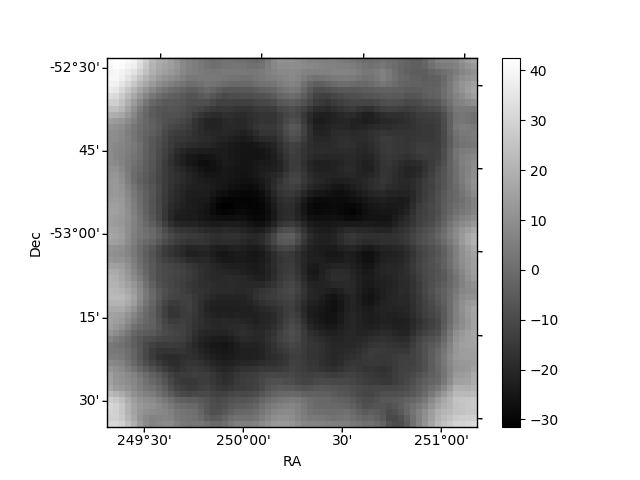
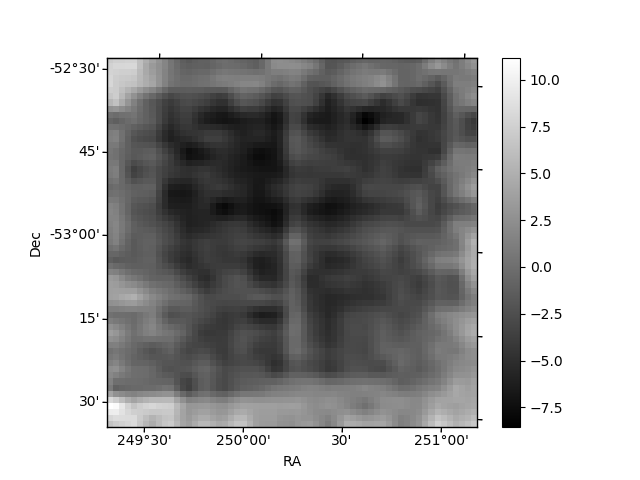
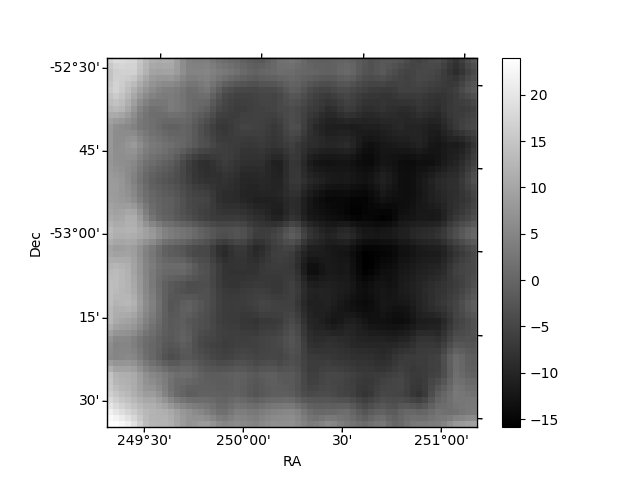
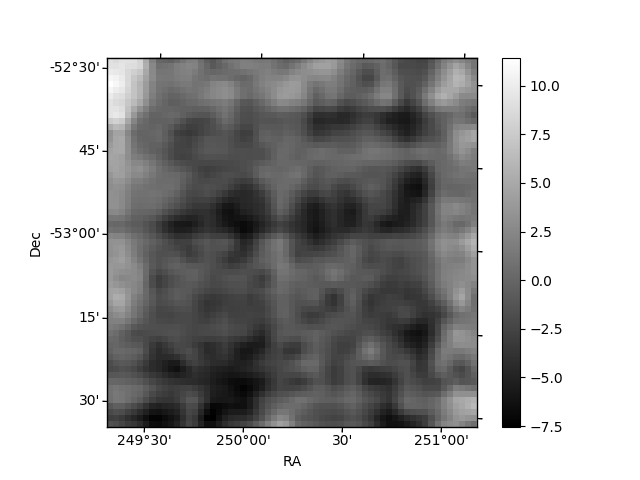
Histogram calculated using DETX and DETY for each event in the final _common_clean file
| Quadrant A | 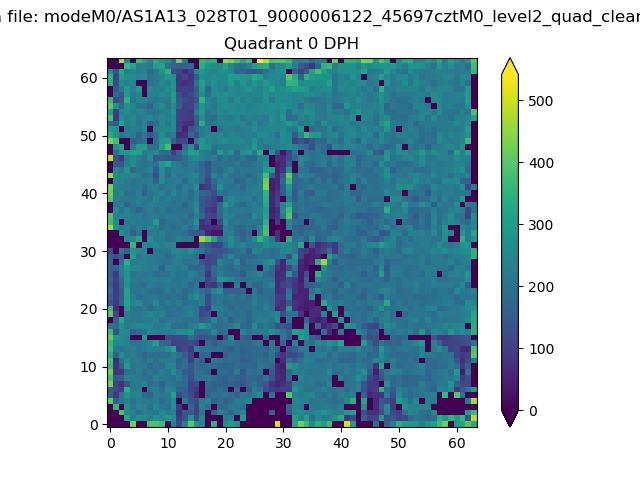 |
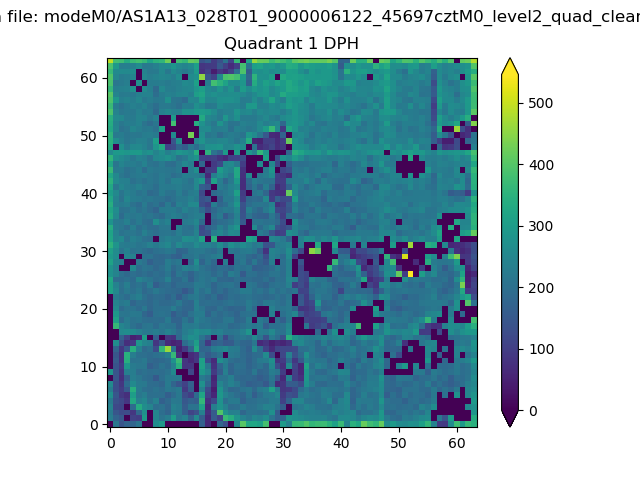 |
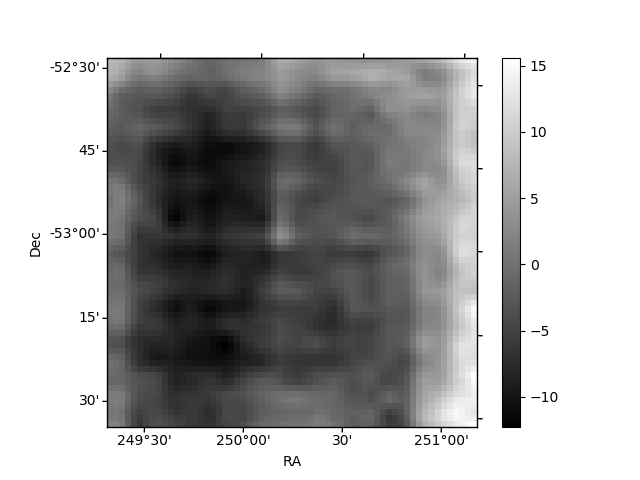
Quadrant B |
|---|---|---|---|
| Quadrant D | 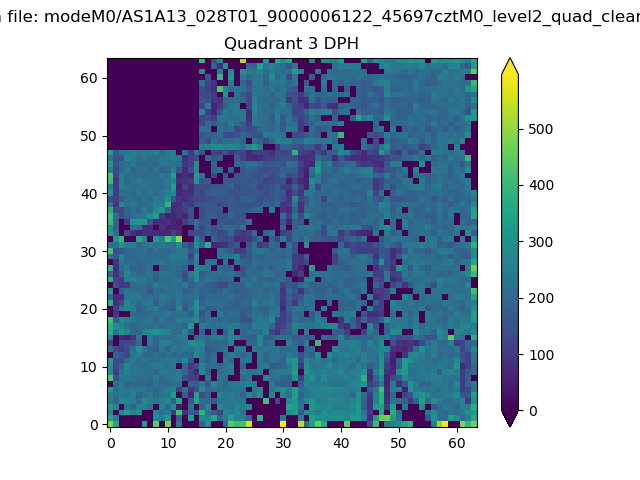 |
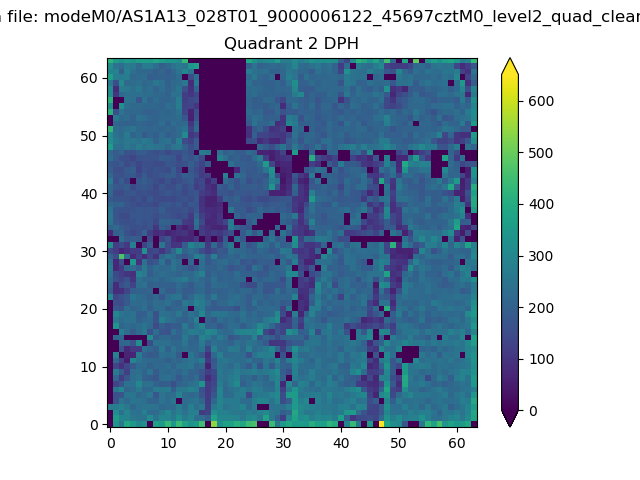 |
Quadrant C |
| Plot type | Count rate plots | Images |
|---|---|---|
| Comparison with Poisson distribution Blue bars denote a histogram of data divided into 1 sec bins. Red curve is a Poisson curve with rate = median count rate of data. |
 |
 |
| Quadrant-wise count rates Data is divided into 100 sec bins |
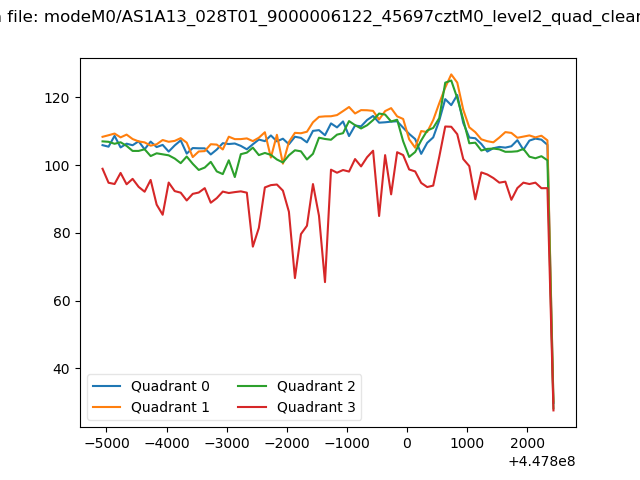 |
|
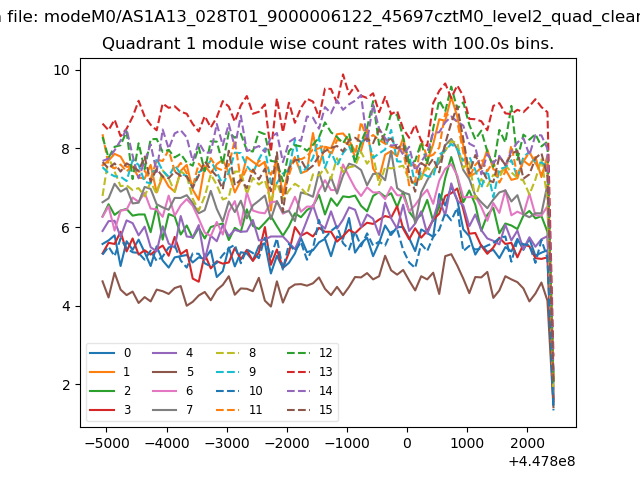
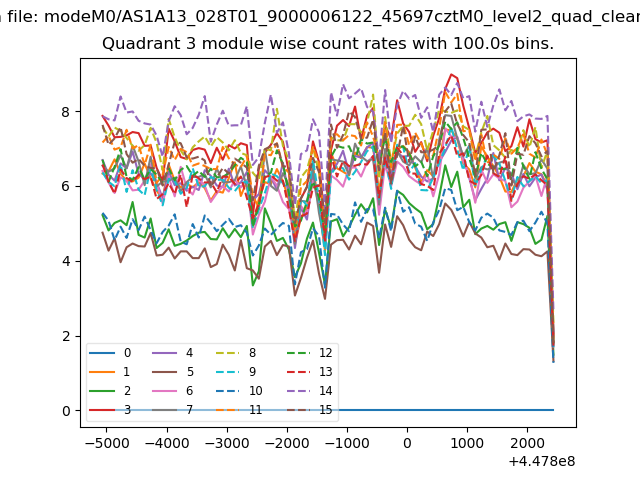
| Module-wise count rates for Quadrant A Data is divided into 100 sec bins |
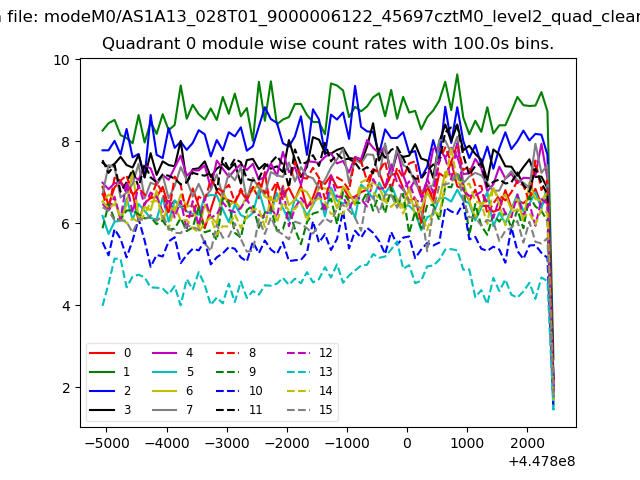 |
 |
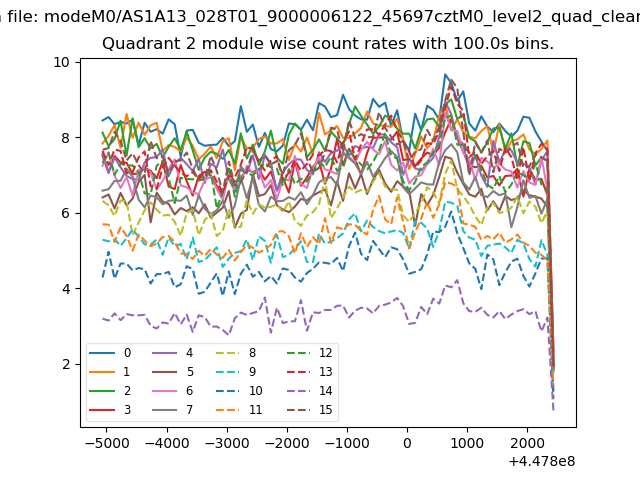
| Module-wise count rates for Quadrant B Data is divided into 100 sec bins |
 |
 |
| Module-wise count rates for Quadrant C Data is divided into 100 sec bins |
 |
 |
| Module-wise count rates for Quadrant D Data is divided into 100 sec bins |
 |
 |
| Parameter | Plot |
|---|---|
| CZT HV Monitor | 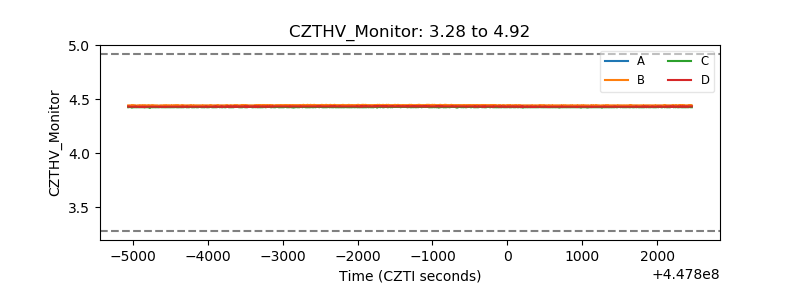 |
| D_VDD | 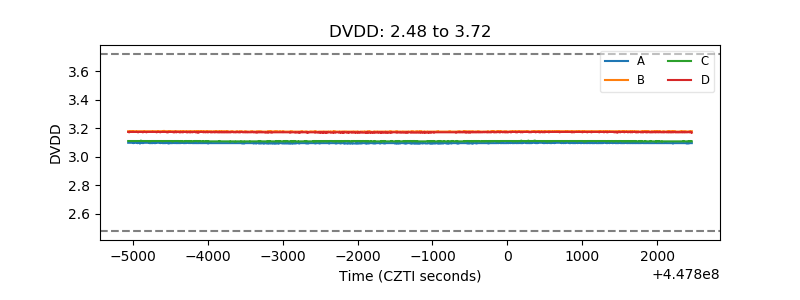 |
| Temperature 1 | 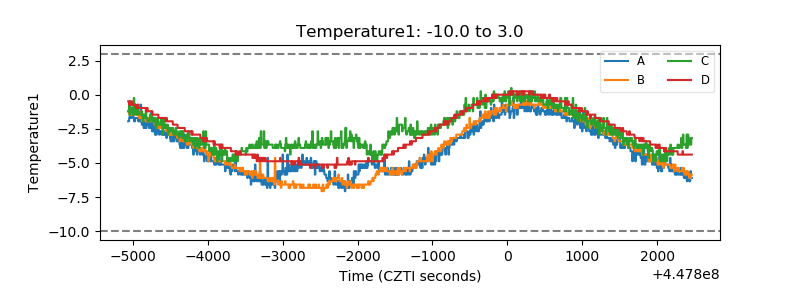 |
| Veto HV Monitor | 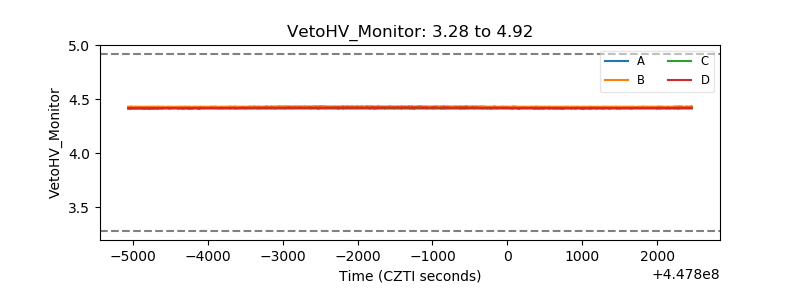 |
| Veto LLD | 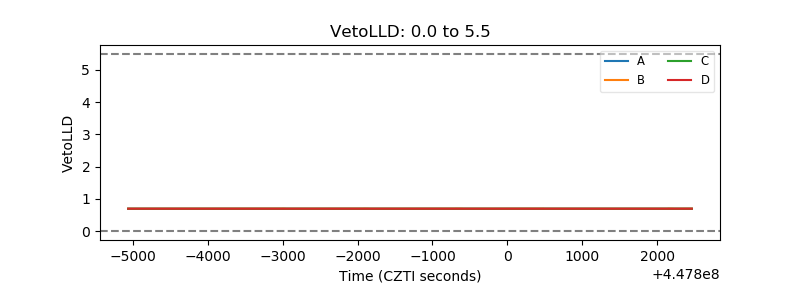 |
| Alpha Counter | 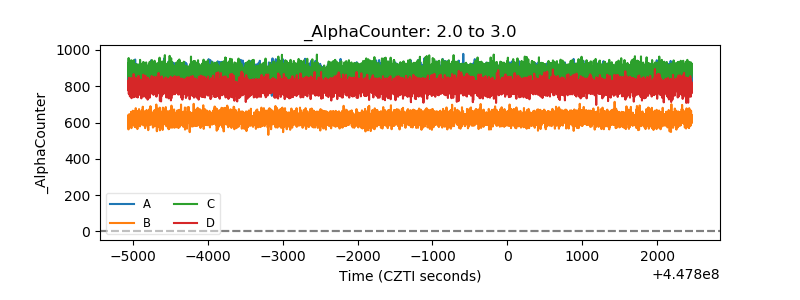 |
| _CPM_Rate | 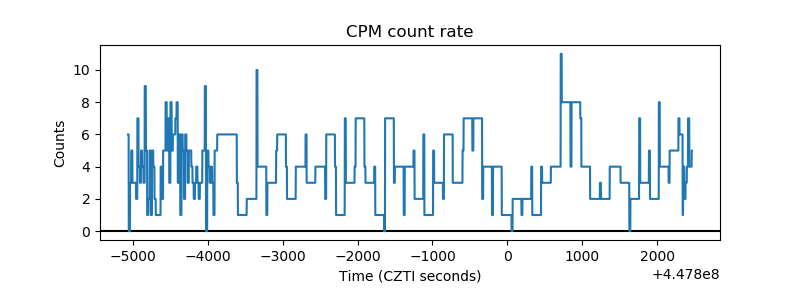 |
| CZT Counter | 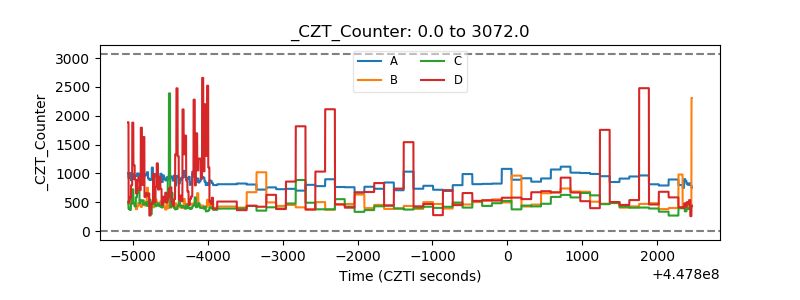 |
| +2.5 Volts monitor | 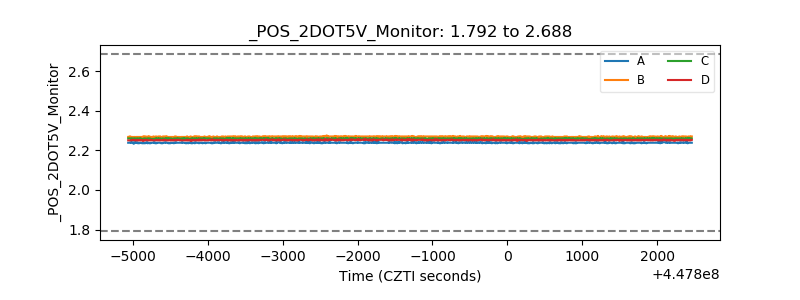 |
| +5 Volts monitor | 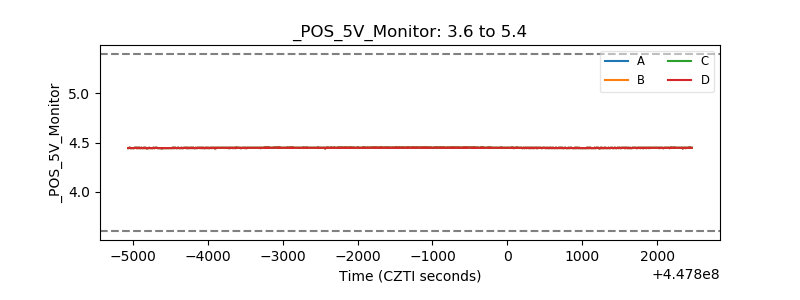 |
| _ROLL_ROT | 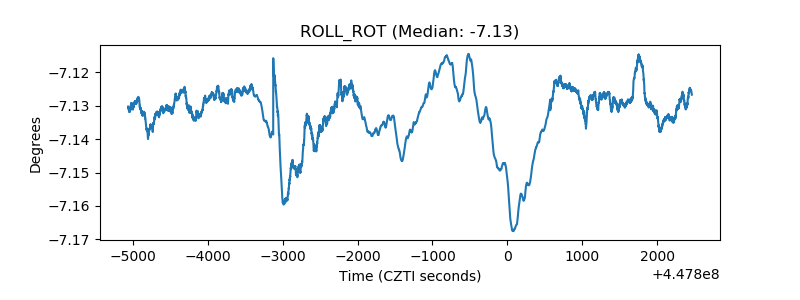 |
| _Roll_DEC | 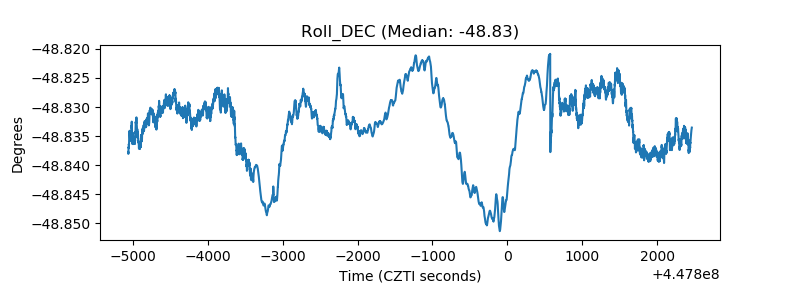 |
| _Roll_RA | 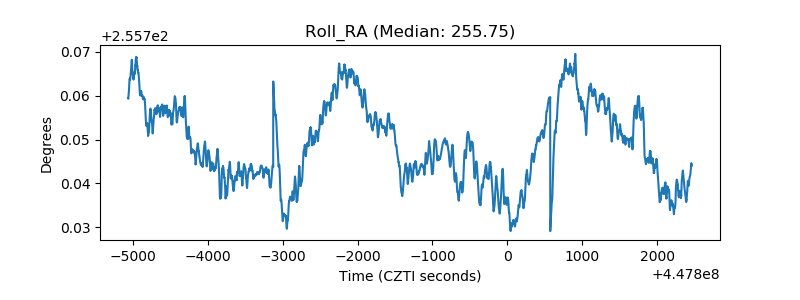 |
| Veto Counter | 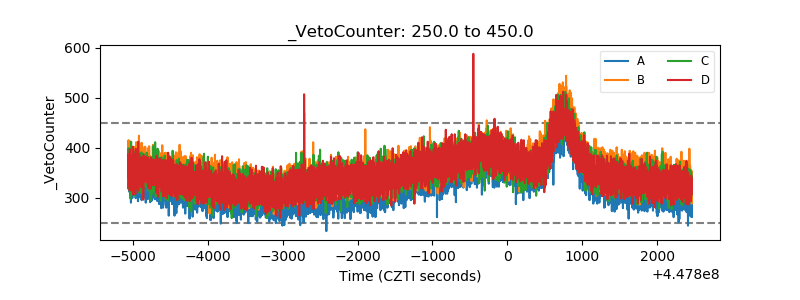 |