| Param | Original file | Final file |
|---|---|---|
| Filename | modeM0/AS1T05_183T01_9000006124_45784cztM0_level2.fits | modeM0/AS1T05_183T01_9000006124_45784cztM0_level2_quad_clean.evt |
| Size (bytes) | 922,173,120 | 111,018,240 |
| Size | 879.5 MB | 105.9 MB |
| Events in quadrant A | 7,009,294 | 809,330 |
| Events in quadrant B | 8,905,112 | 727,030 |
| Events in quadrant C | 3,357,943 | 818,507 |
| Events in quadrant D | 14,278,407 | 477,979 |
| Mode SS | |||
|---|---|---|---|
| Quadrant | BADHDUFLAG | Total packets | Discarded packets |
| A | 0 | 152 | 0 |
| B | 0 | 152 | 0 |
| C | 0 | 152 | 0 |
| D | 0 | 152 | 0 |
| Mode M0 | |||
|---|---|---|---|
| Quadrant | BADHDUFLAG | Total packets | Discarded packets |
| A | 0 | 26100 | 0 |
| B | 0 | 31716 | 0 |
| C | 0 | 15583 | 0 |
| D | 0 | 47650 | 0 |
| Quadrant | Total seconds | Saturated seconds | Saturation percentage |
|---|---|---|---|
| A | 7590 | 159 | 2.094862% |
| B | 7590 | 1271 | 16.745718% |
| C | 7590 | 8 | 0.105402% |
| D | 7590 | 3139 | 41.357049% |
Noise dominated data is calculated using 1-second bins in cleaned event files. If a bin has >2000 counts, and if more than 50% of those come from <1% of pixels, then it is considered to be noise-dominated and hence unusable.
| Quadrant | # 1 sec bins | Bins with >0 counts | Bins with >2000 counts | High rate bins dominated by noise | Noise dominated (total time) | Noise dominated (detector-on time) | Marked lightcurve |
|---|---|---|---|---|---|---|---|
| A | 7590 | 7590 | 7 | 7 | 0.09% | 0.09% | 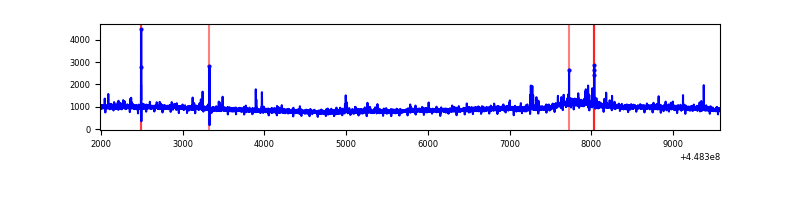 |
| B | 7590 | 7590 | 789 | 789 | 10.40% | 10.40% | 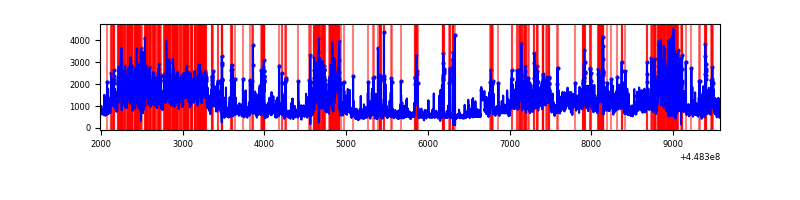 |
| C | 7590 | 7590 | 3 | 3 | 0.04% | 0.04% | 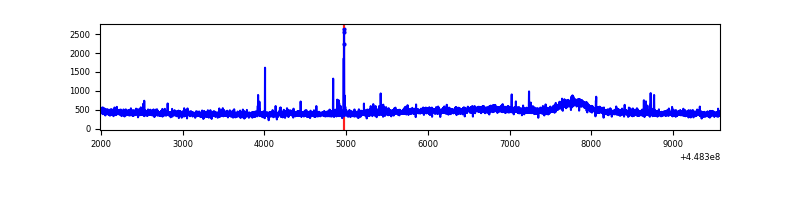 |
| D | 7590 | 7590 | 3284 | 3284 | 43.27% | 43.27% | 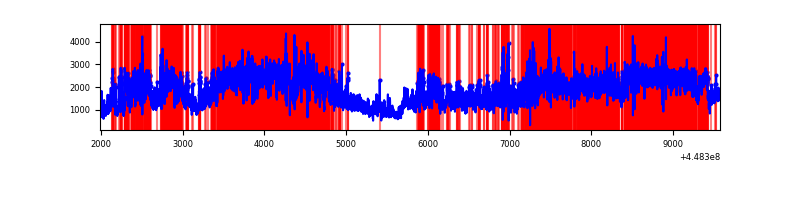 |
Top three noisy pixels from each quadrant. If the there are fewer than three noisy pixels in the level2.evt file, extra rows are filled as -1
| Pixel properties | Quadrant properties | ||||||
|---|---|---|---|---|---|---|---|
| Quadrant | DetID | PixID | Counts | Sigma | Mean | Median | Sigma |
| A | 10 | 83 | 3505193 | 19170.99 | 858 | 840 | 182.8 |
| A | 13 | 248 | 80242 | 434.38 | 858 | 840 | 182.8 |
| A | 14 | 235 | 34759 | 185.56 | 858 | 840 | 182.8 |
| B | 3 | 112 | 3161364 | 19613.86 | 815 | 789 | 161.1 |
| B | 15 | 201 | 495389 | 3069.38 | 815 | 789 | 161.1 |
| B | 5 | 255 | 395084 | 2446.91 | 815 | 789 | 161.1 |
| C | 12 | 2 | 29714 | 143.93 | 846 | 853 | 200.5 |
| C | 2 | 14 | 12500 | 58.08 | 846 | 853 | 200.5 |
| C | 3 | 233 | 6898 | 30.15 | 846 | 853 | 200.5 |
| D | 11 | 241 | 8433379 | 43407.44 | 748 | 724 | 194.3 |
| D | 8 | 48 | 1496462 | 7699.37 | 748 | 724 | 194.3 |
| D | 2 | 249 | 530936 | 2729.29 | 748 | 724 | 194.3 |
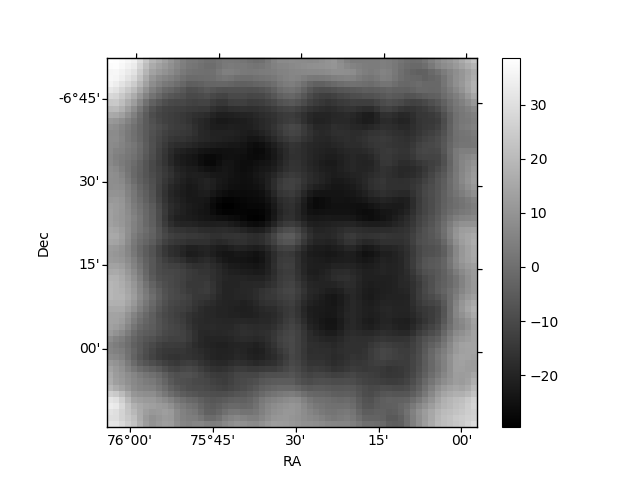
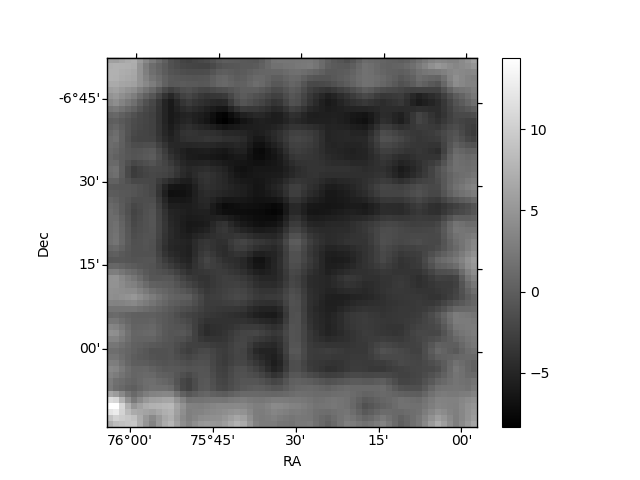
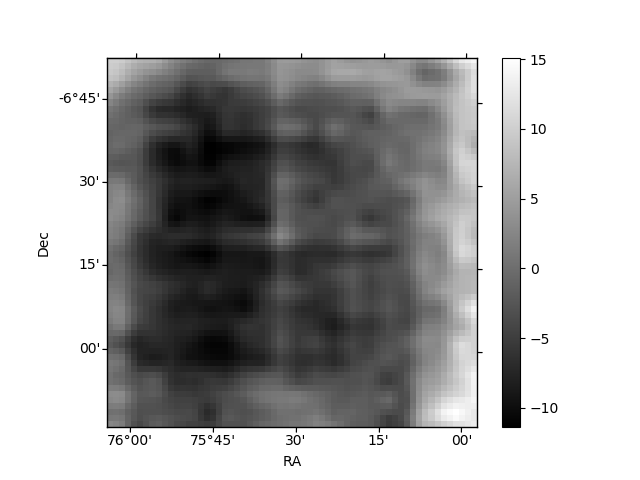
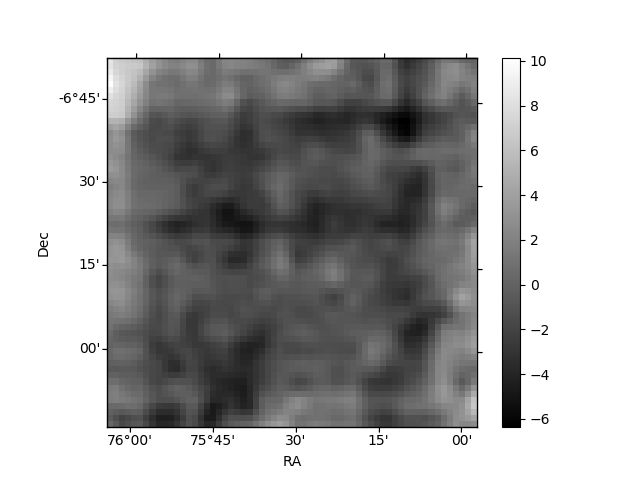
Histogram calculated using DETX and DETY for each event in the final _common_clean file
| Quadrant A | 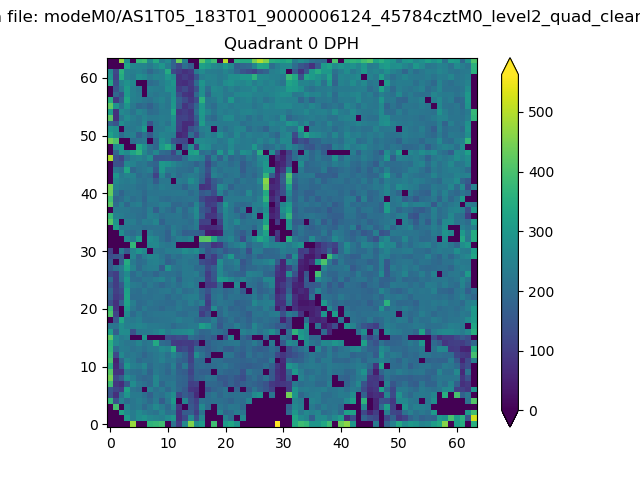 |
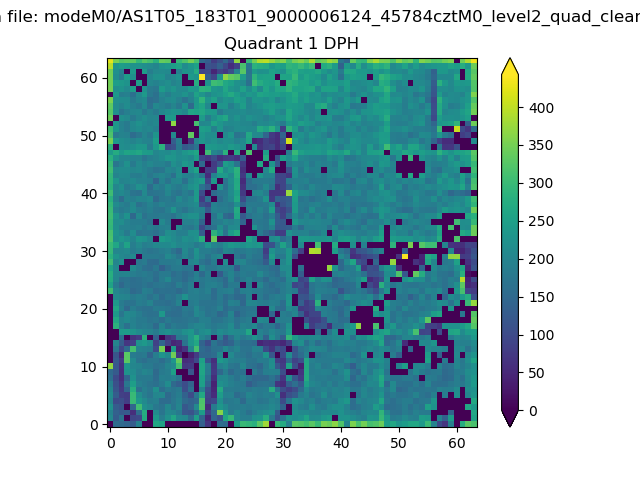 |
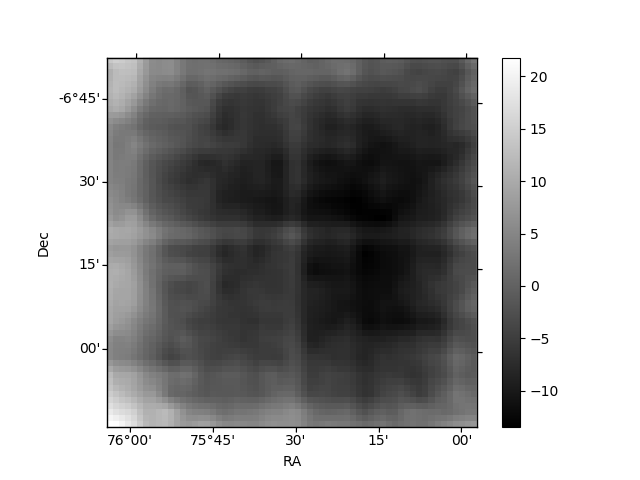
Quadrant B |
|---|---|---|---|
| Quadrant D | 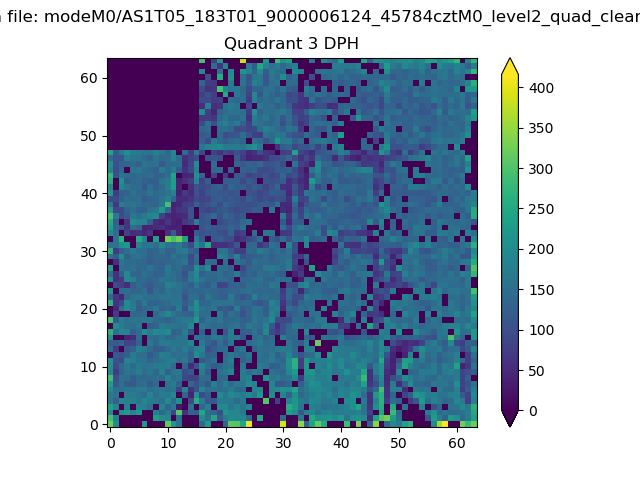 |
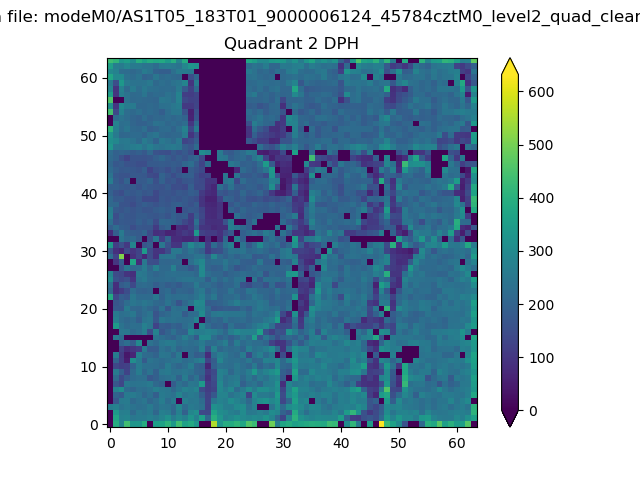 |
Quadrant C |
| Plot type | Count rate plots | Images |
|---|---|---|
| Comparison with Poisson distribution Blue bars denote a histogram of data divided into 1 sec bins. Red curve is a Poisson curve with rate = median count rate of data. |
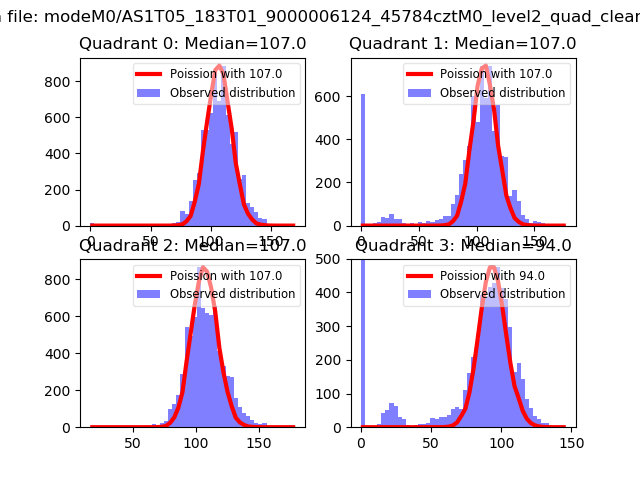 |
 |
| Quadrant-wise count rates Data is divided into 100 sec bins |
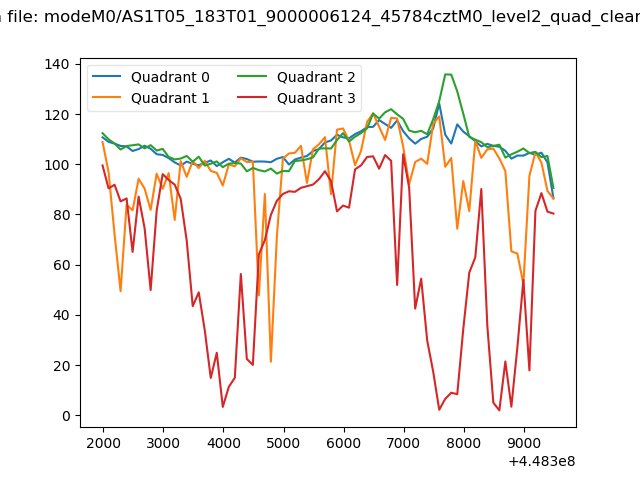 |
|
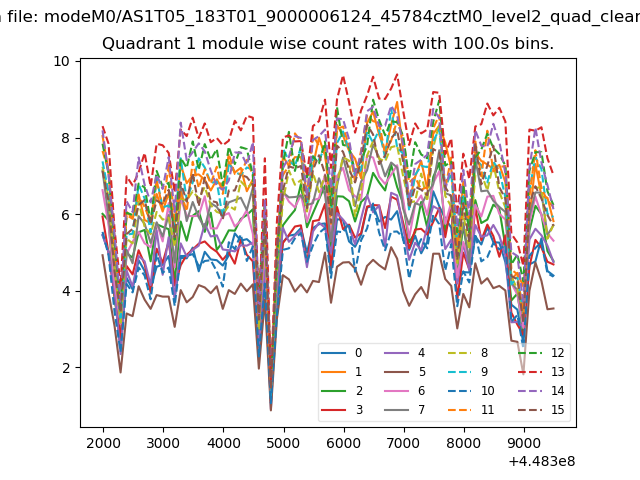
| Module-wise count rates for Quadrant A Data is divided into 100 sec bins |
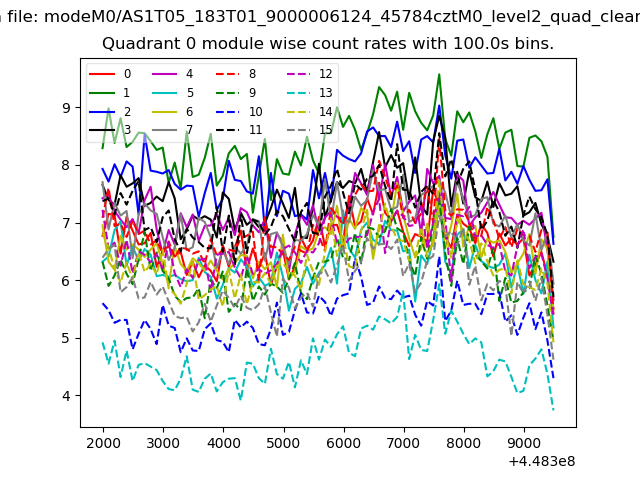 |
 |
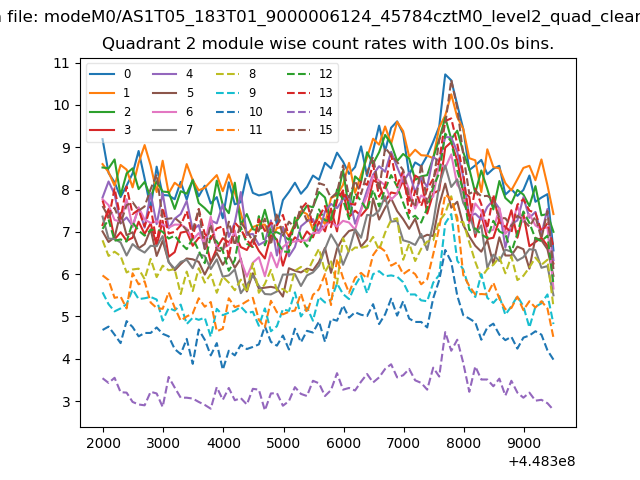
| Module-wise count rates for Quadrant B Data is divided into 100 sec bins |
 |
 |
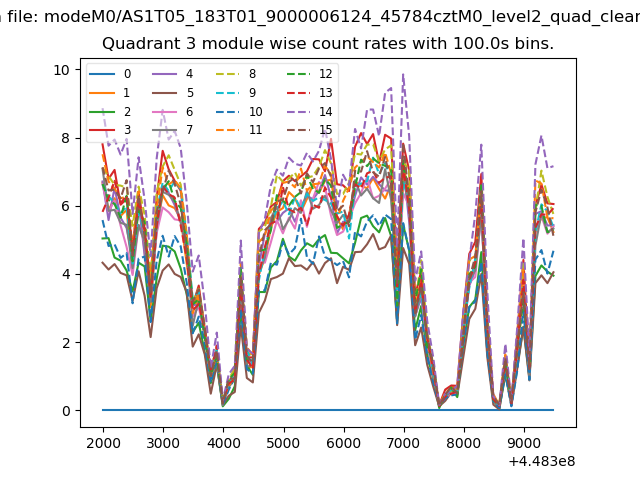
| Module-wise count rates for Quadrant C Data is divided into 100 sec bins |
 |
 |
| Module-wise count rates for Quadrant D Data is divided into 100 sec bins |
 |
 |
| Parameter | Plot |
|---|---|
| CZT HV Monitor |  |
| D_VDD | 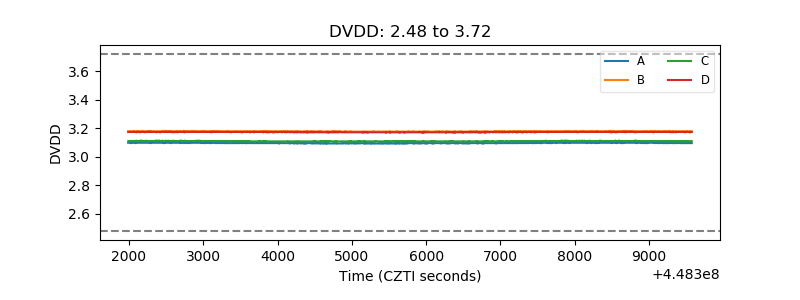 |
| Temperature 1 | 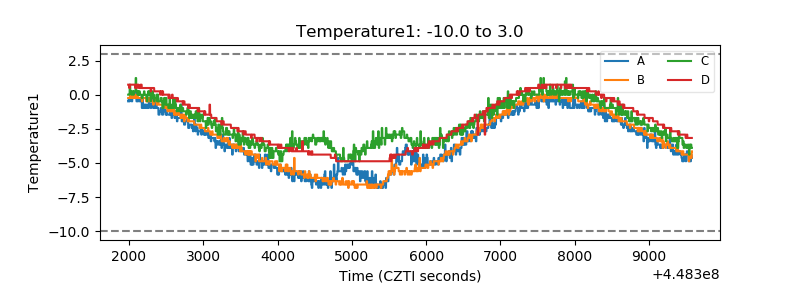 |
| Veto HV Monitor | 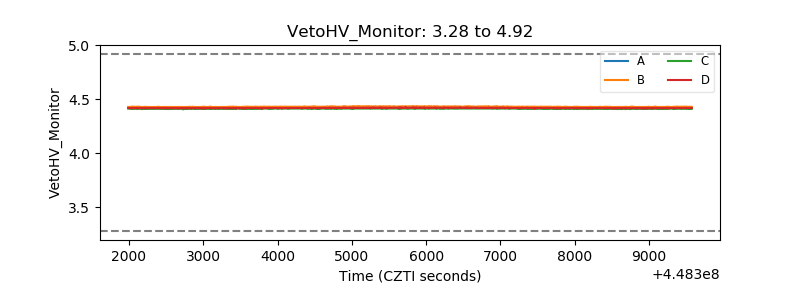 |
| Veto LLD | 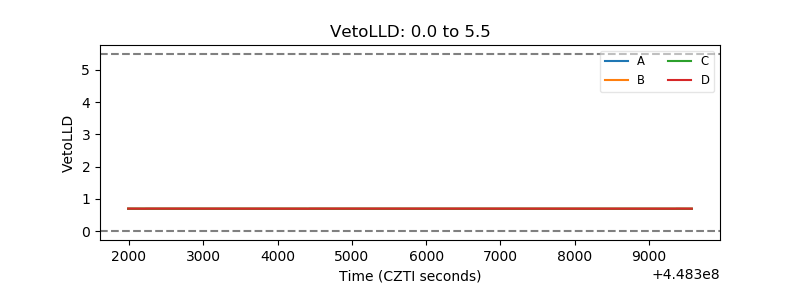 |
| Alpha Counter | 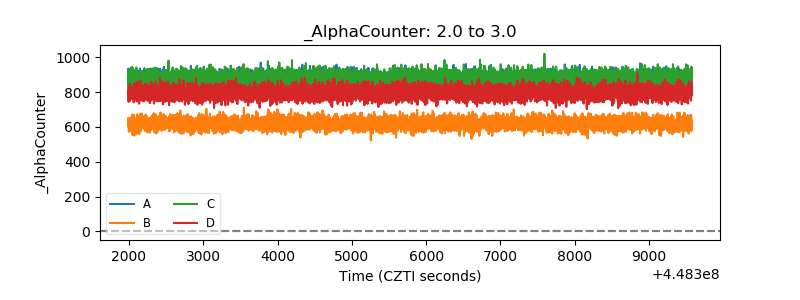 |
| _CPM_Rate | 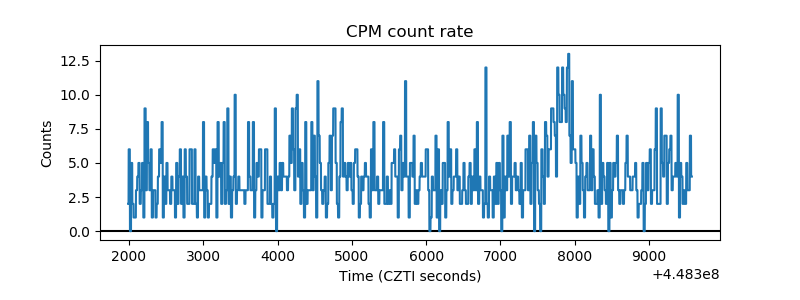 |
| CZT Counter | 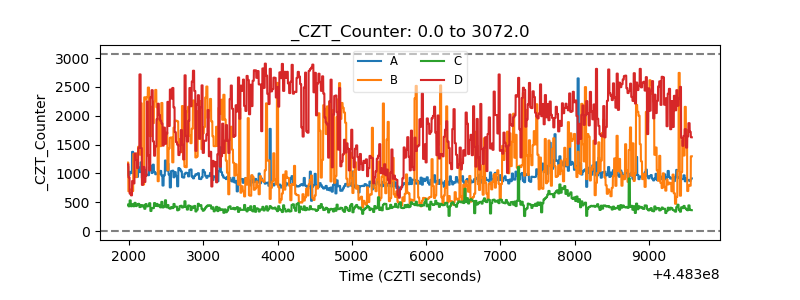 |
| +2.5 Volts monitor | 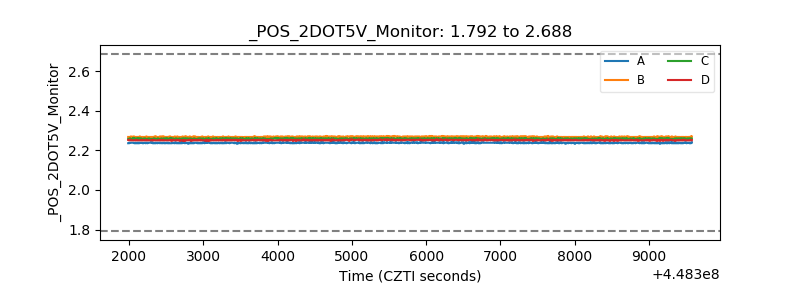 |
| +5 Volts monitor | 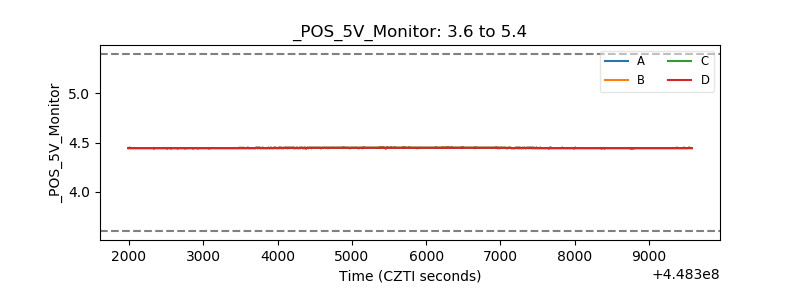 |
| _ROLL_ROT | 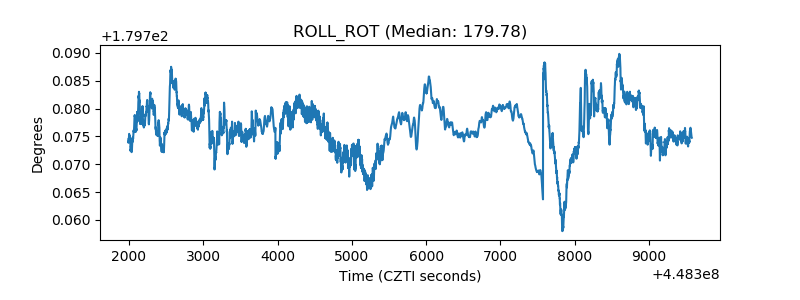 |
| _Roll_DEC | 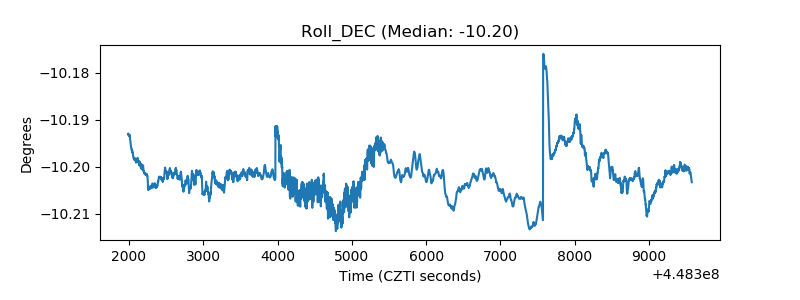 |
| _Roll_RA | 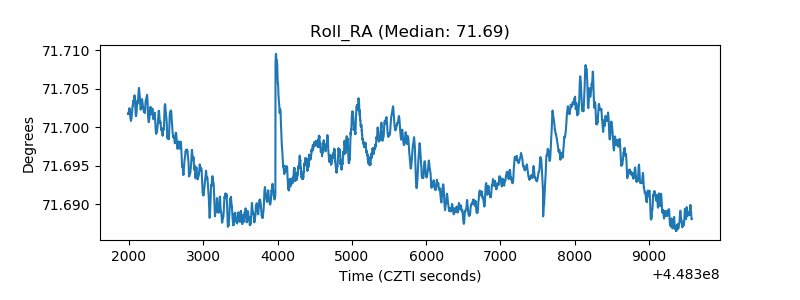 |
| Veto Counter | 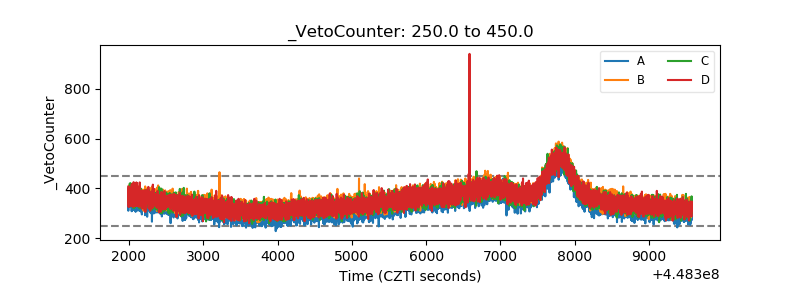 |