| Param | Original file | Final file |
|---|---|---|
| Filename | modeM0/AS1C07_001T01_9000006136_45885cztM0_level2.fits | modeM0/AS1C07_001T01_9000006136_45885cztM0_level2_quad_clean.evt |
| Size (bytes) | 623,666,880 | 95,296,320 |
| Size | 594.8 MB | 90.9 MB |
| Events in quadrant A | 6,373,508 | 630,330 |
| Events in quadrant B | 8,861,485 | 545,089 |
| Events in quadrant C | 2,758,108 | 676,704 |
| Events in quadrant D | 4,603,994 | 592,474 |
| Mode SS | |||
|---|---|---|---|
| Quadrant | BADHDUFLAG | Total packets | Discarded packets |
| A | 0 | 126 | 0 |
| B | 0 | 126 | 0 |
| C | 0 | 126 | 0 |
| D | 0 | 126 | 0 |
| Mode M0 | |||
|---|---|---|---|
| Quadrant | BADHDUFLAG | Total packets | Discarded packets |
| A | 0 | 23145 | 0 |
| B | 0 | 30767 | 0 |
| C | 0 | 13012 | 0 |
| D | 0 | 17958 | 0 |
| Quadrant | Total seconds | Saturated seconds | Saturation percentage |
|---|---|---|---|
| A | 6312 | 568 | 8.998733% |
| B | 6313 | 1855 | 29.383811% |
| C | 6313 | 31 | 0.491050% |
| D | 6313 | 323 | 5.116426% |
Noise dominated data is calculated using 1-second bins in cleaned event files. If a bin has >2000 counts, and if more than 50% of those come from <1% of pixels, then it is considered to be noise-dominated and hence unusable.
| Quadrant | # 1 sec bins | Bins with >0 counts | Bins with >2000 counts | High rate bins dominated by noise | Noise dominated (total time) | Noise dominated (detector-on time) | Marked lightcurve |
|---|---|---|---|---|---|---|---|
| A | 6312 | 6312 | 486 | 486 | 7.70% | 7.70% | 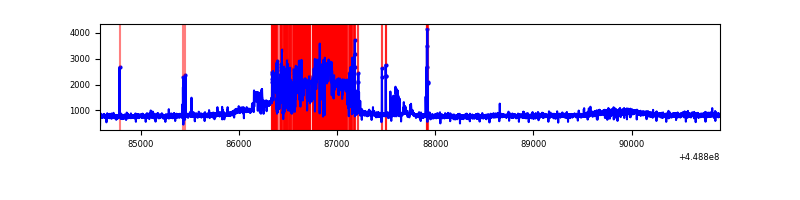 |
| B | 6313 | 6313 | 1176 | 1176 | 18.63% | 18.63% | 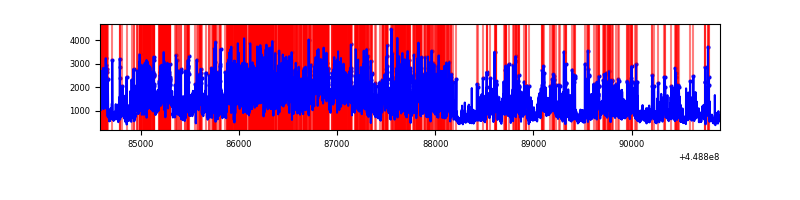 |
| C | 6313 | 6313 | 12 | 12 | 0.19% | 0.19% | 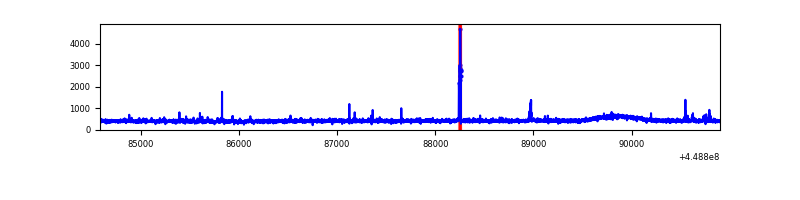 |
| D | 6313 | 6313 | 252 | 252 | 3.99% | 3.99% | 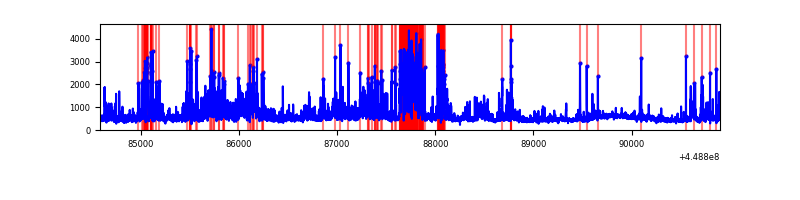 |
Top three noisy pixels from each quadrant. If the there are fewer than three noisy pixels in the level2.evt file, extra rows are filled as -1
| Pixel properties | Quadrant properties | ||||||
|---|---|---|---|---|---|---|---|
| Quadrant | DetID | PixID | Counts | Sigma | Mean | Median | Sigma |
| A | 10 | 83 | 2436636 | 17040.27 | 681 | 667 | 143.0 |
| A | 0 | 247 | 1174188 | 8209.1 | 681 | 667 | 143.0 |
| A | 0 | 226 | 80572 | 558.96 | 681 | 667 | 143.0 |
| B | 3 | 112 | 6229646 | 50068.84 | 634 | 613 | 124.4 |
| B | 4 | 158 | 48829 | 387.56 | 634 | 613 | 124.4 |
| B | 0 | 190 | 19863 | 154.73 | 634 | 613 | 124.4 |
| C | 12 | 2 | 43540 | 267.0 | 685 | 687 | 160.5 |
| C | 2 | 14 | 18387 | 110.28 | 685 | 687 | 160.5 |
| C | 10 | 20 | 10296 | 59.87 | 685 | 687 | 160.5 |
| D | 13 | 249 | 617742 | 3686.3 | 667 | 644 | 167.4 |
| D | 1 | 52 | 595559 | 3553.79 | 667 | 644 | 167.4 |
| D | 11 | 192 | 201089 | 1197.38 | 667 | 644 | 167.4 |
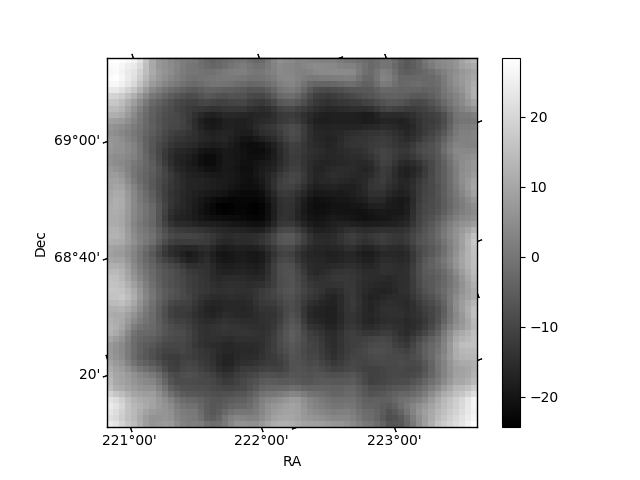
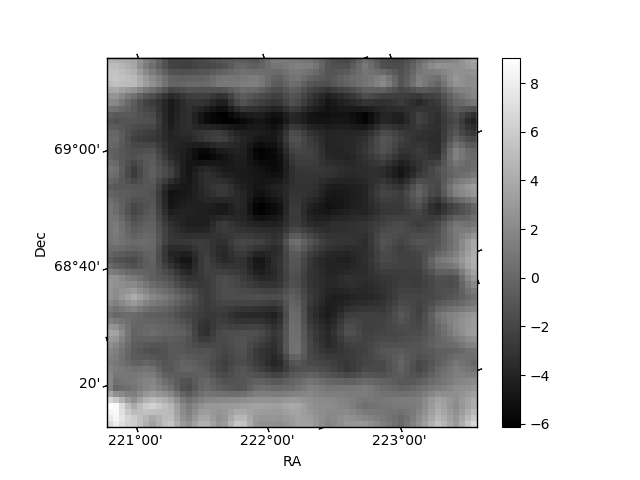
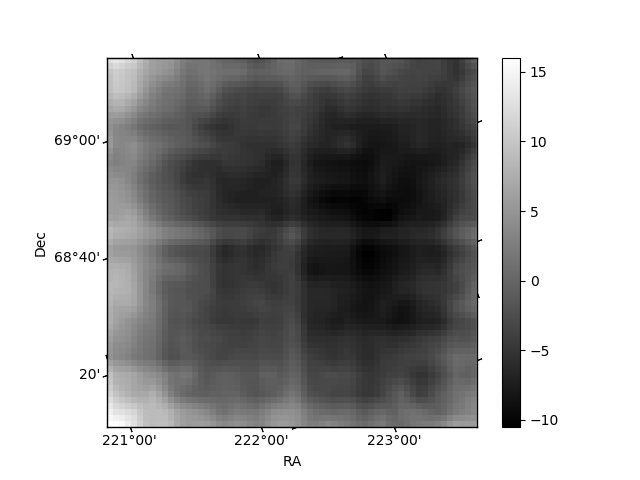
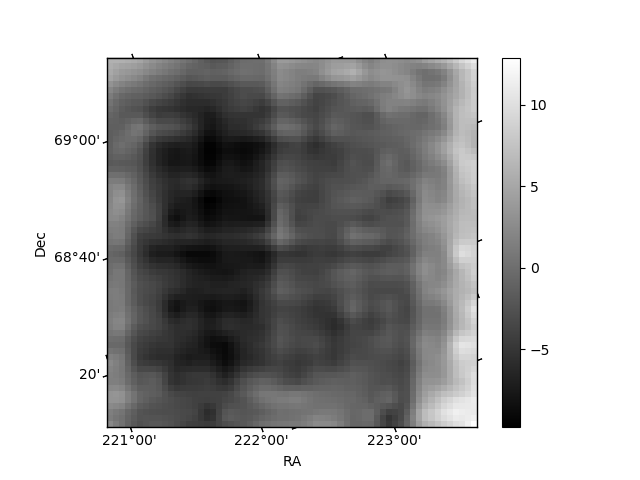
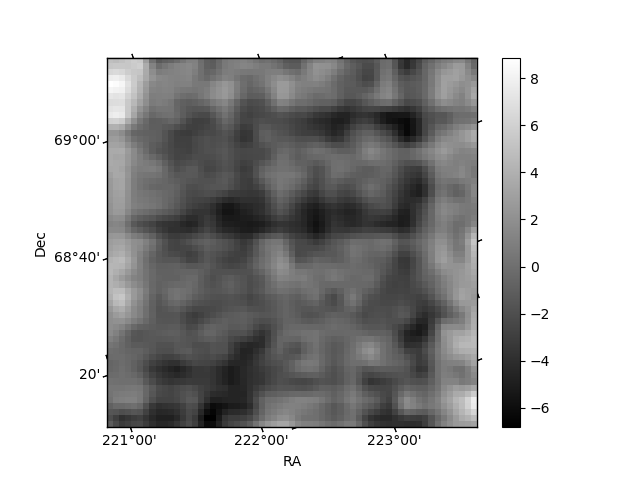
Histogram calculated using DETX and DETY for each event in the final _common_clean file
| Quadrant A | 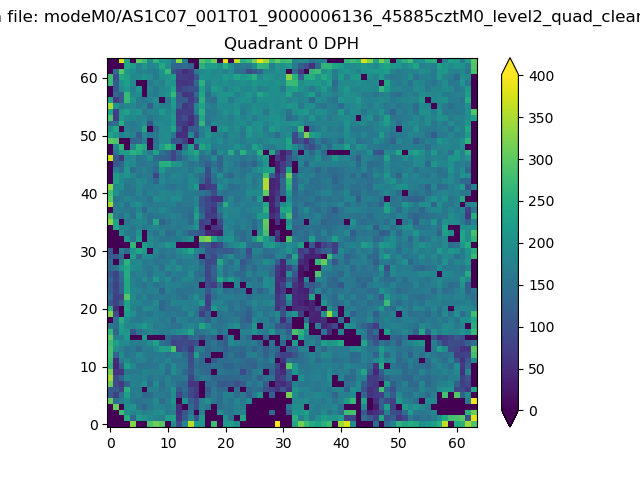 |
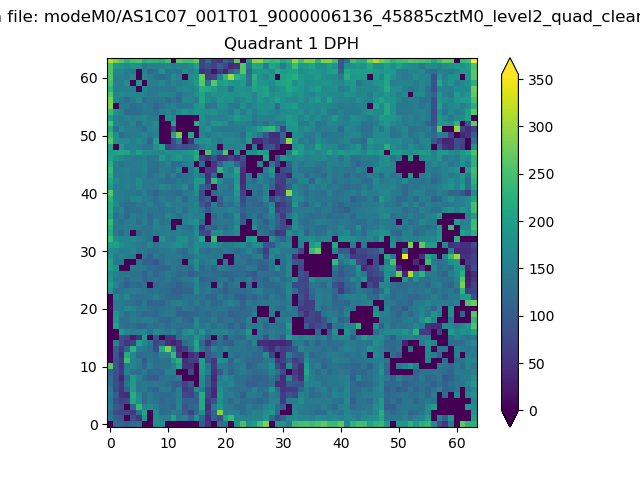 |
Quadrant B |
|---|---|---|---|
| Quadrant D | 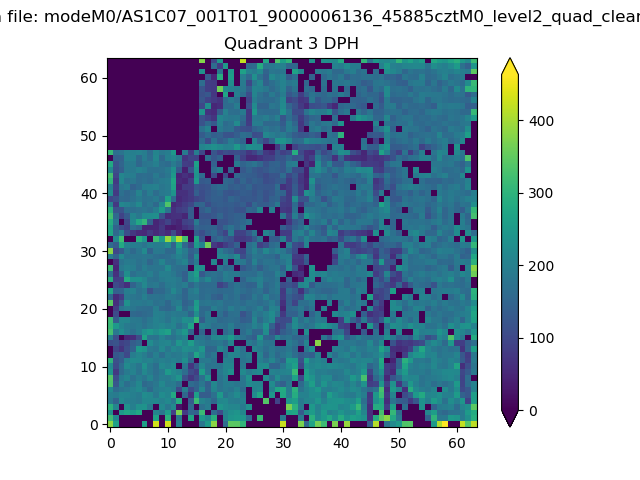 |
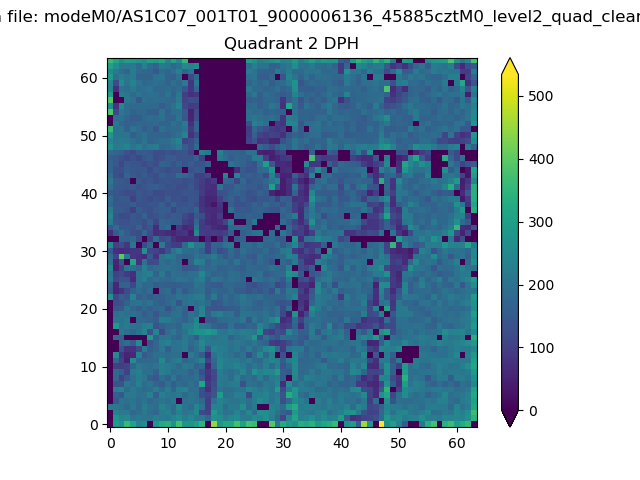 |
Quadrant C |
| Plot type | Count rate plots | Images |
|---|---|---|
| Comparison with Poisson distribution Blue bars denote a histogram of data divided into 1 sec bins. Red curve is a Poisson curve with rate = median count rate of data. |
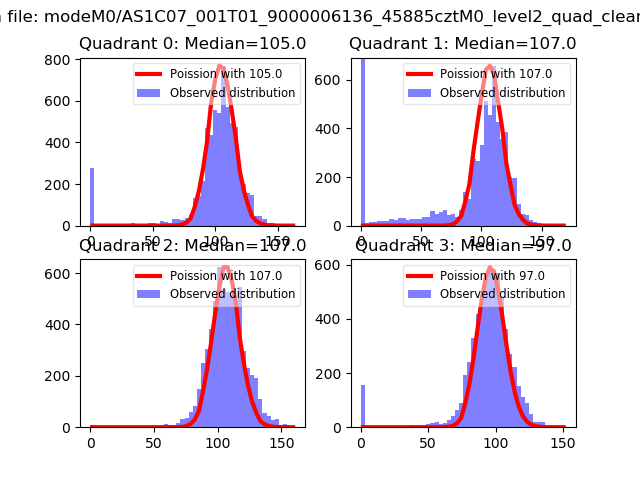 |
 |
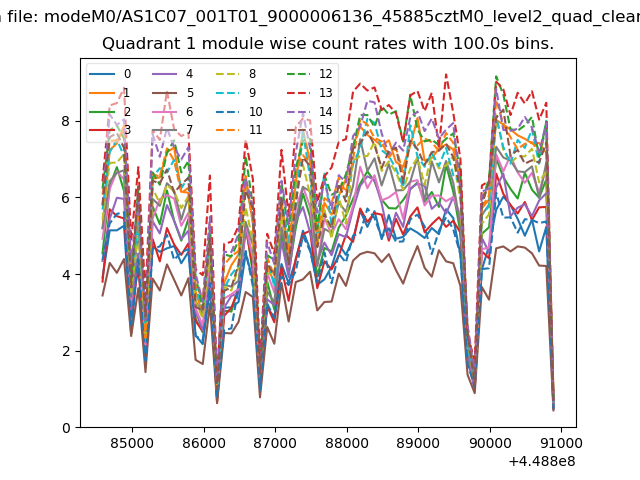
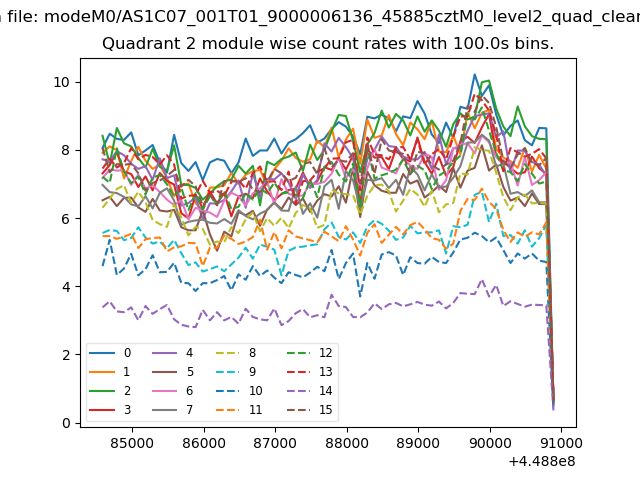
| Quadrant-wise count rates Data is divided into 100 sec bins |
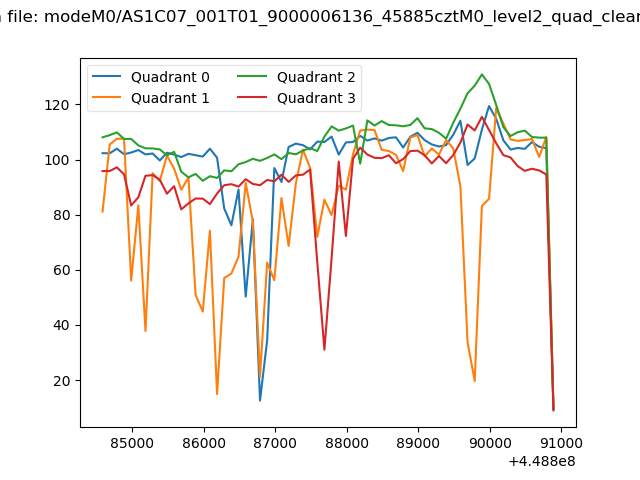 |
|
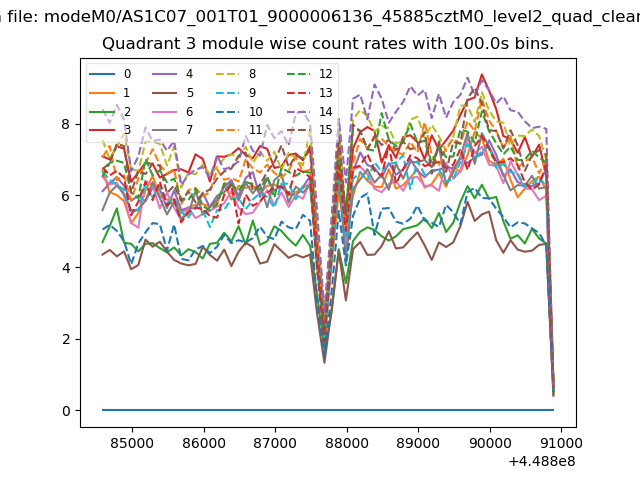
| Module-wise count rates for Quadrant A Data is divided into 100 sec bins |
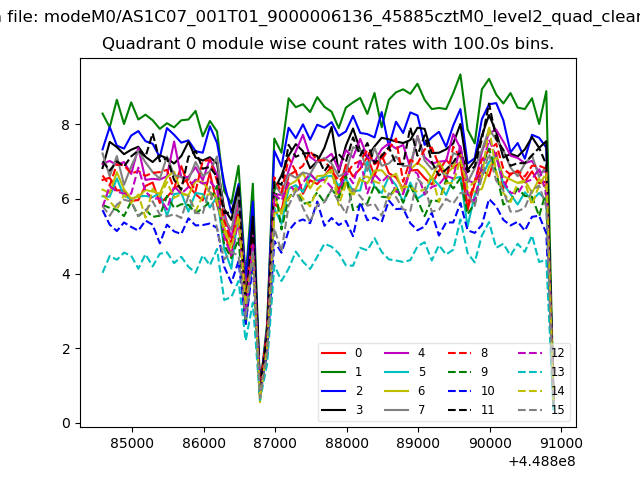 |
 |
| Module-wise count rates for Quadrant B Data is divided into 100 sec bins |
 |
 |
| Module-wise count rates for Quadrant C Data is divided into 100 sec bins |
 |
 |
| Module-wise count rates for Quadrant D Data is divided into 100 sec bins |
 |
 |
| Parameter | Plot |
|---|---|
| CZT HV Monitor | 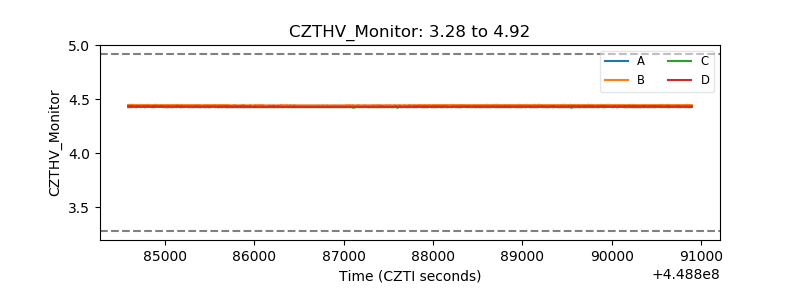 |
| D_VDD | 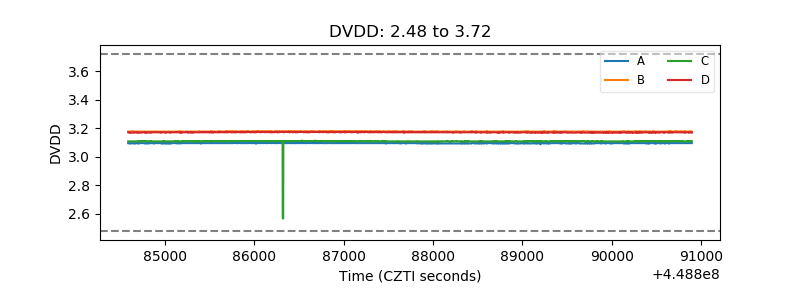 |
| Temperature 1 | 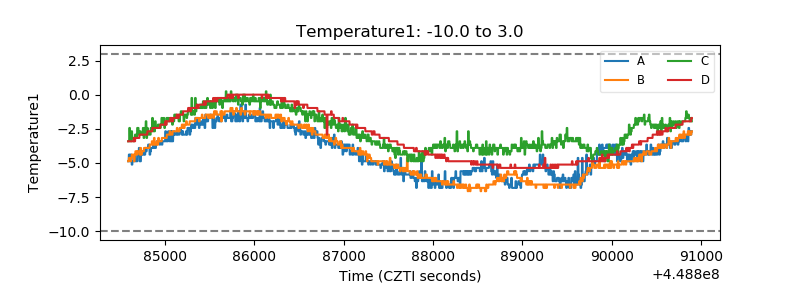 |
| Veto HV Monitor | 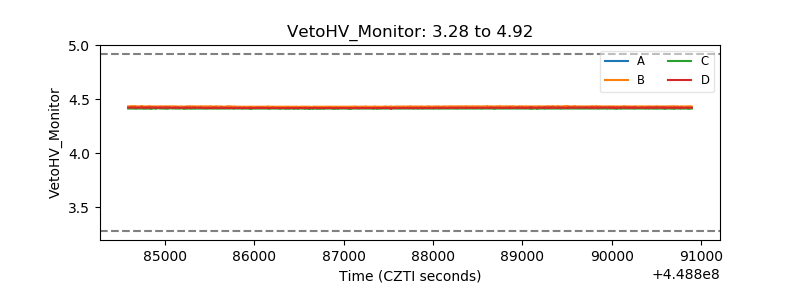 |
| Veto LLD | 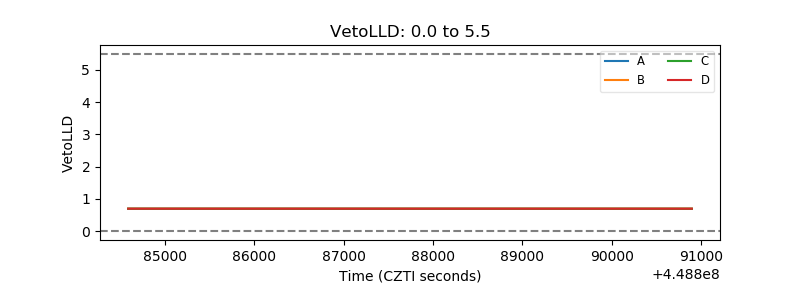 |
| Alpha Counter | 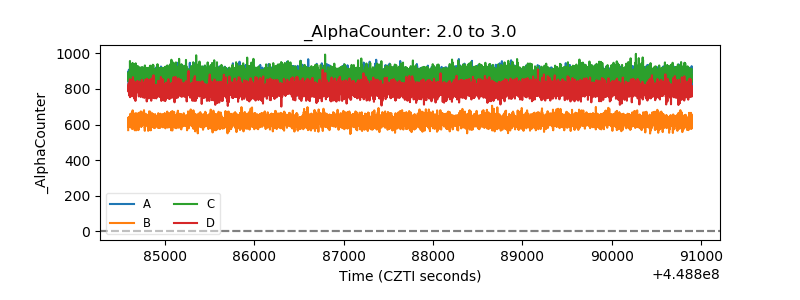 |
| _CPM_Rate | 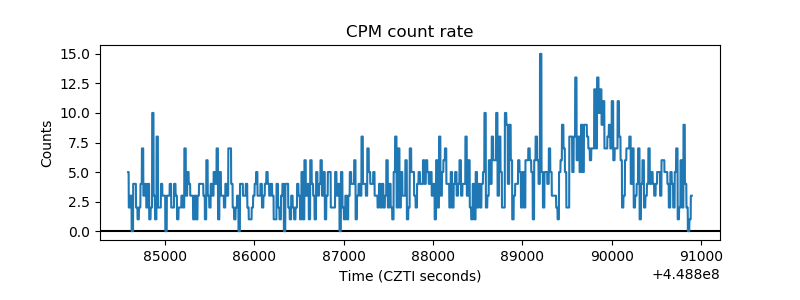 |
| CZT Counter | 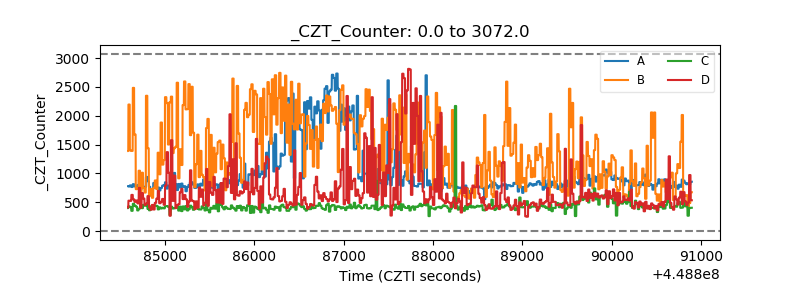 |
| +2.5 Volts monitor | 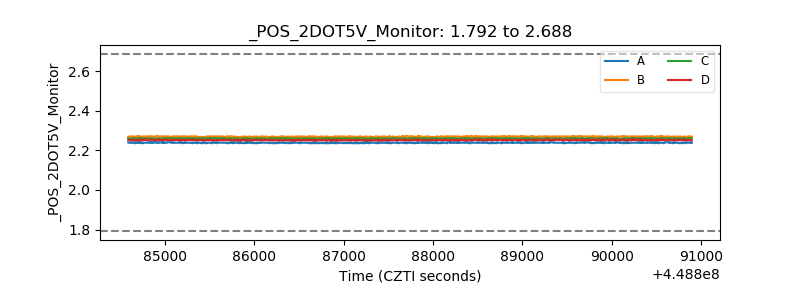 |
| +5 Volts monitor | 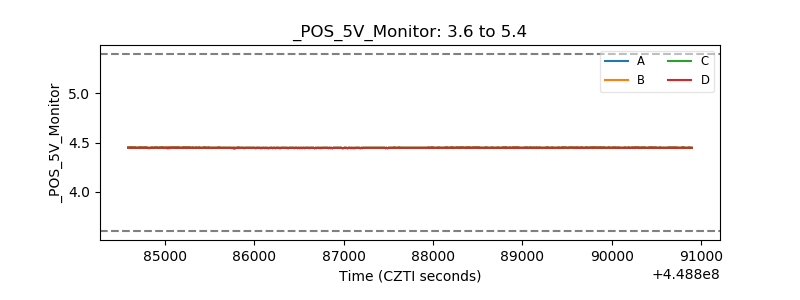 |
| _ROLL_ROT | 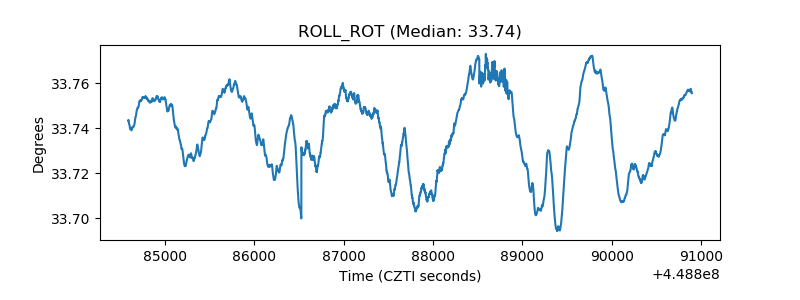 |
| _Roll_DEC | 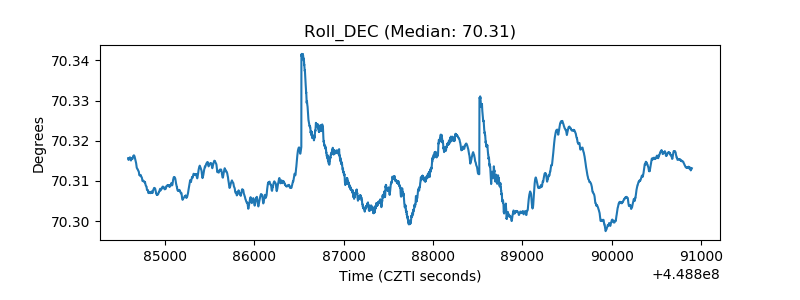 |
| _Roll_RA | 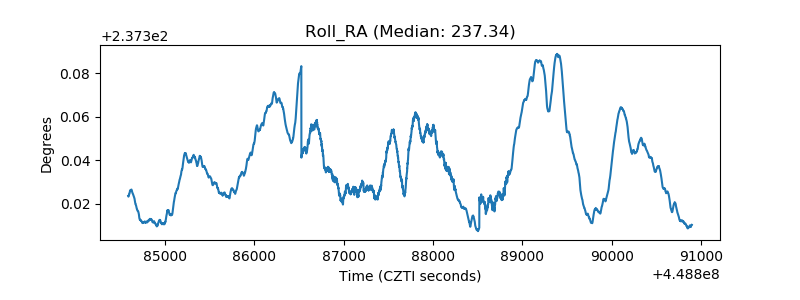 |
| Veto Counter | 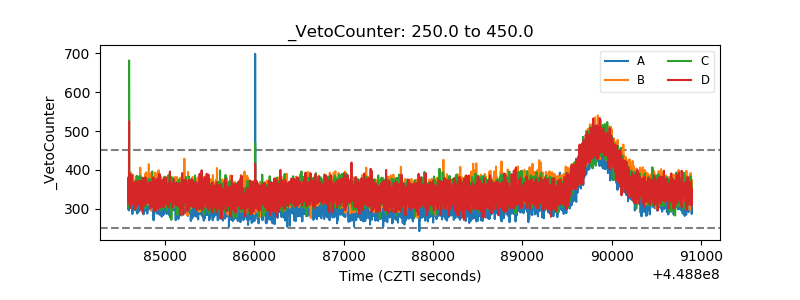 |