| Param | Original file | Final file |
|---|---|---|
| Filename | modeM0/AS1C09_003T01_9000006298_47097cztM0_level2.fits | modeM0/AS1C09_003T01_9000006298_47097cztM0_level2_quad_clean.evt |
| Size (bytes) | 435,188,160 | 101,116,800 |
| Size | 415.0 MB | 96.4 MB |
| Events in quadrant A | 5,984,650 | 684,420 |
| Events in quadrant B | 2,954,753 | 706,165 |
| Events in quadrant C | 2,642,676 | 659,548 |
| Events in quadrant D | 4,061,115 | 592,484 |
| Mode M9 | |||
|---|---|---|---|
| Quadrant | BADHDUFLAG | Total packets | Discarded packets |
| A | 0 | 12 | 0 |
| B | 0 | 12 | 0 |
| C | 0 | 12 | 0 |
| D | 0 | 12 | 0 |
| Mode M0 | |||
|---|---|---|---|
| Quadrant | BADHDUFLAG | Total packets | Discarded packets |
| A | 0 | 22068 | 3 |
| B | 0 | 12859 | 1 |
| C | 0 | 12335 | 4 |
| D | 0 | 16558 | 4 |
| Mode SS | |||
|---|---|---|---|
| Quadrant | BADHDUFLAG | Total packets | Discarded packets |
| A | 0 | 122 | 0 |
| B | 0 | 122 | 0 |
| C | 0 | 122 | 0 |
| D | 0 | 122 | 0 |
| Quadrant | Total seconds | Saturated seconds | Saturation percentage |
|---|---|---|---|
| A | 6002 | 155 | 2.582473% |
| B | 6004 | 54 | 0.899400% |
| C | 6002 | 13 | 0.216594% |
| D | 6001 | 314 | 5.232461% |
Noise dominated data is calculated using 1-second bins in cleaned event files. If a bin has >2000 counts, and if more than 50% of those come from <1% of pixels, then it is considered to be noise-dominated and hence unusable.
| Quadrant | # 1 sec bins | Bins with >0 counts | Bins with >2000 counts | High rate bins dominated by noise | Noise dominated (total time) | Noise dominated (detector-on time) | Marked lightcurve |
|---|---|---|---|---|---|---|---|
| A | 7208 | 6004 | 58 | 58 | 0.80% | 0.97% | 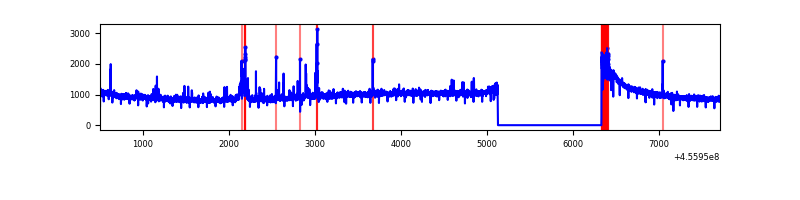 |
| B | 7209 | 6005 | 16 | 16 | 0.22% | 0.27% | 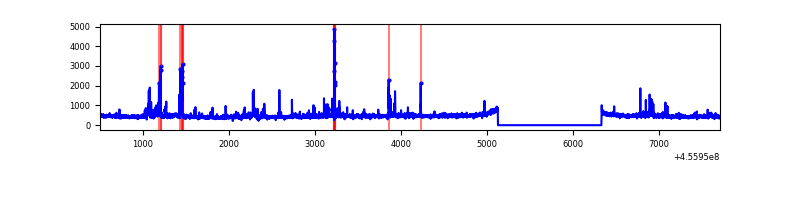 |
| C | 7209 | 6004 | 4 | 4 | 0.06% | 0.07% | 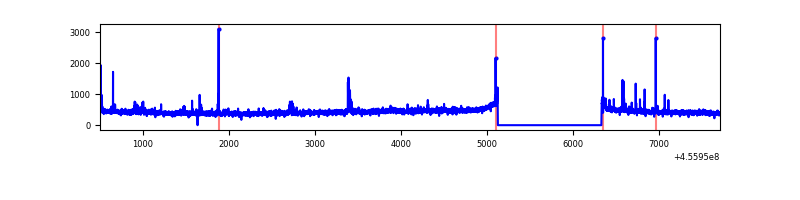 |
| D | 7208 | 6003 | 290 | 290 | 4.02% | 4.83% | 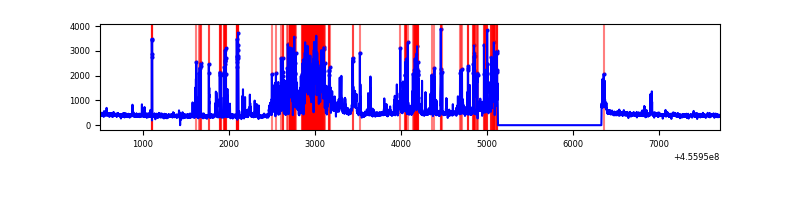 |
Top three noisy pixels from each quadrant. If the there are fewer than three noisy pixels in the level2.evt file, extra rows are filled as -1
| Pixel properties | Quadrant properties | ||||||
|---|---|---|---|---|---|---|---|
| Quadrant | DetID | PixID | Counts | Sigma | Mean | Median | Sigma |
| A | 10 | 83 | 3225290 | 23264.89 | 669 | 656 | 138.6 |
| A | 14 | 248 | 82239 | 588.6 | 669 | 656 | 138.6 |
| A | 9 | 191 | 32869 | 232.4 | 669 | 656 | 138.6 |
| B | 5 | 32 | 178963 | 1370.8 | 669 | 649 | 130.1 |
| B | 5 | 255 | 49169 | 373.0 | 669 | 649 | 130.1 |
| B | 0 | 200 | 28142 | 211.35 | 669 | 649 | 130.1 |
| C | 14 | 254 | 57303 | 375.58 | 648 | 651 | 150.8 |
| C | 12 | 249 | 37352 | 243.31 | 648 | 651 | 150.8 |
| C | 15 | 208 | 11005 | 68.64 | 648 | 651 | 150.8 |
| D | 1 | 47 | 1110931 | 6980.9 | 638 | 616 | 159.1 |
| D | 8 | 48 | 232997 | 1461.05 | 638 | 616 | 159.1 |
| D | 2 | 249 | 183446 | 1149.51 | 638 | 616 | 159.1 |
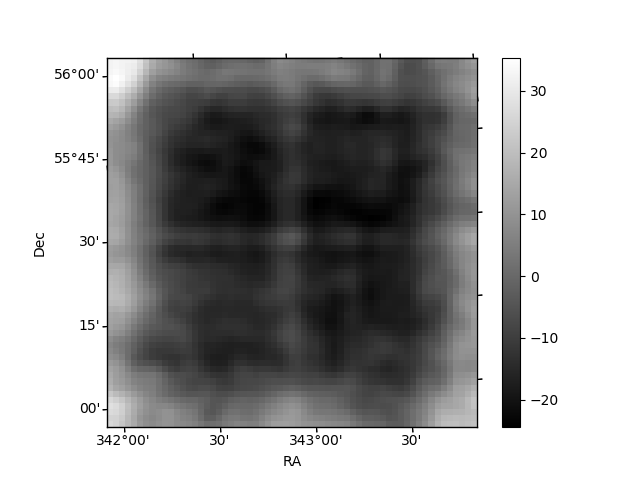
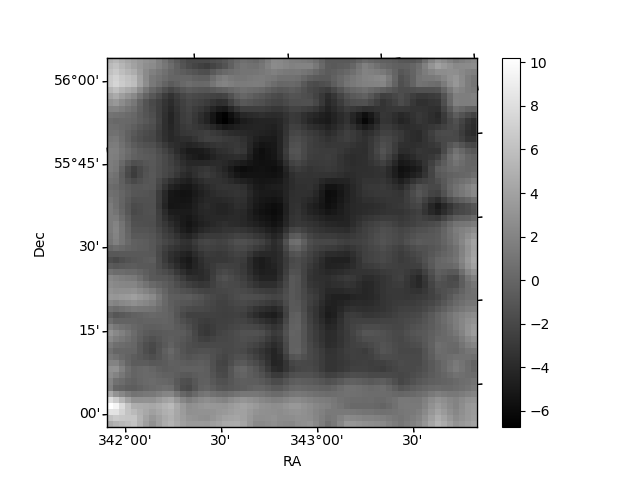
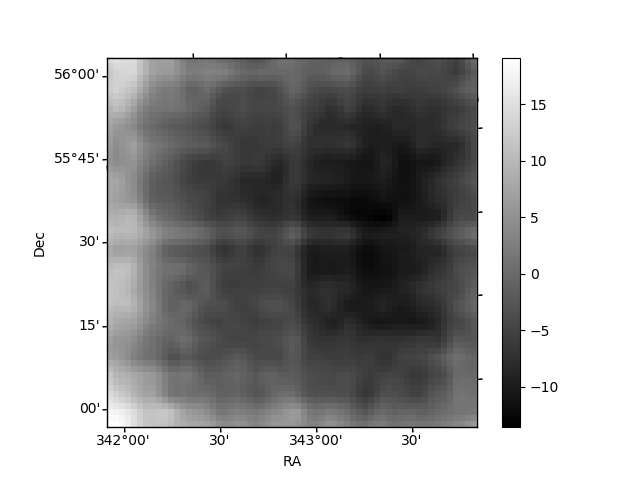
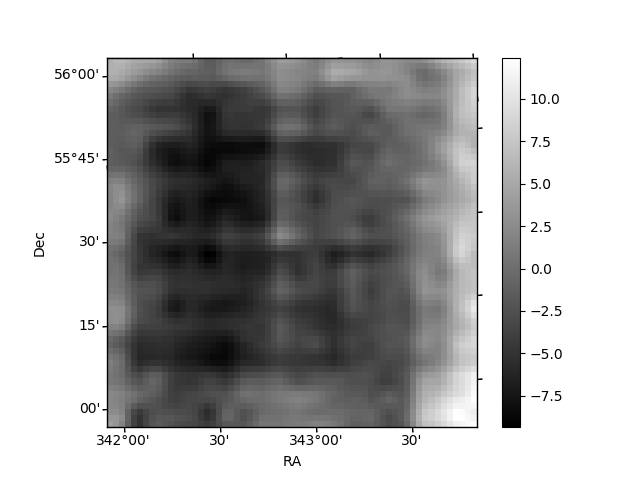
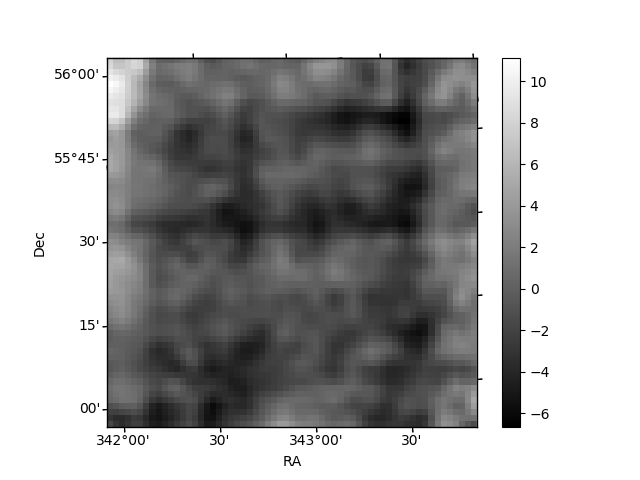
Histogram calculated using DETX and DETY for each event in the final _common_clean file
| Quadrant A | 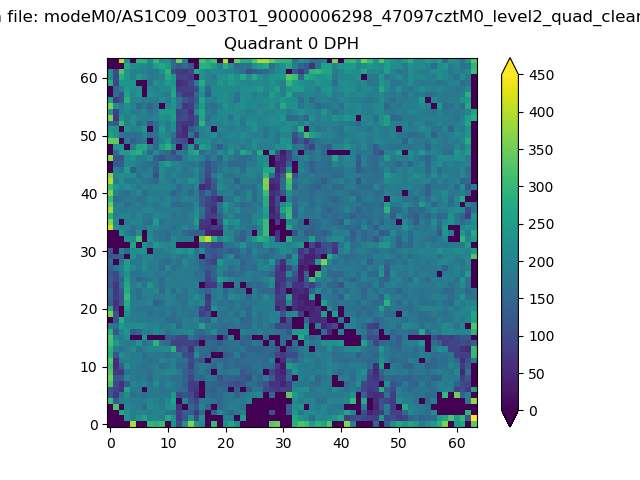 |
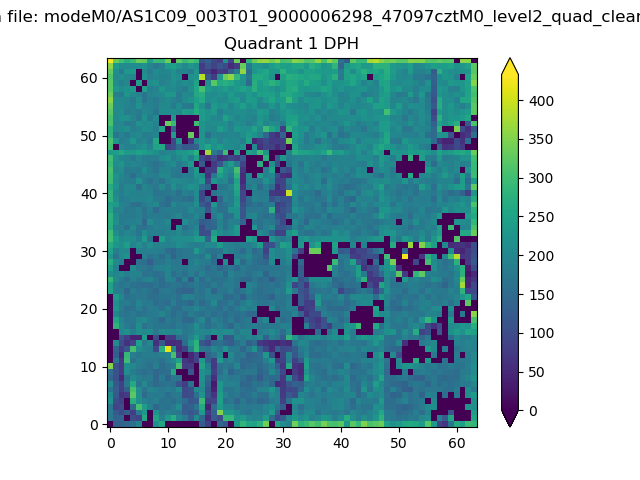 |
Quadrant B |
|---|---|---|---|
| Quadrant D | 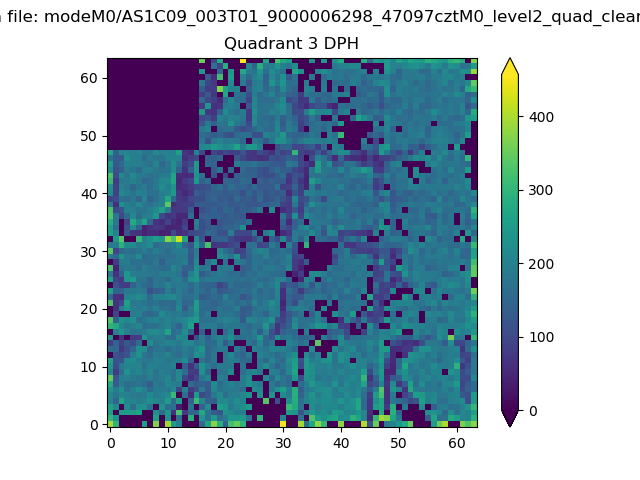 |
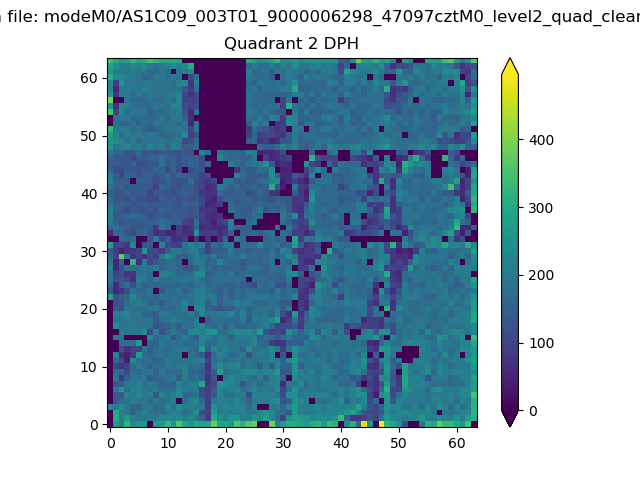 |
Quadrant C |
| Plot type | Count rate plots | Images |
|---|---|---|
| Comparison with Poisson distribution Blue bars denote a histogram of data divided into 1 sec bins. Red curve is a Poisson curve with rate = median count rate of data. |
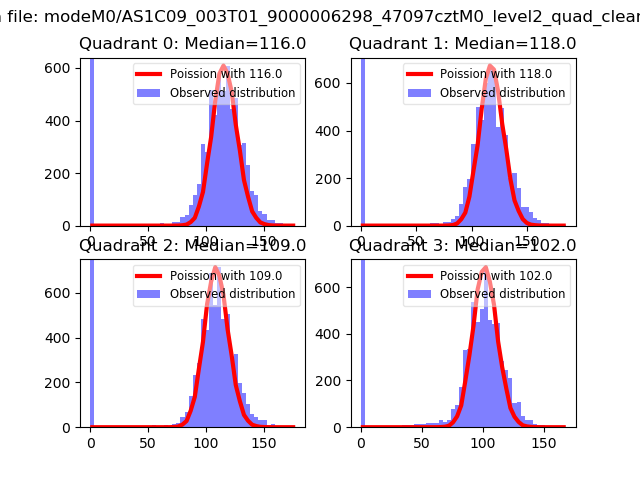 |
 |
| Quadrant-wise count rates Data is divided into 100 sec bins |
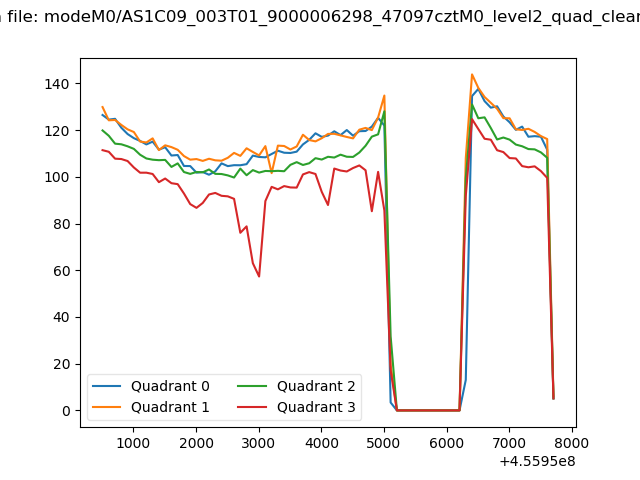 |
|
| Module-wise count rates for Quadrant A Data is divided into 100 sec bins |
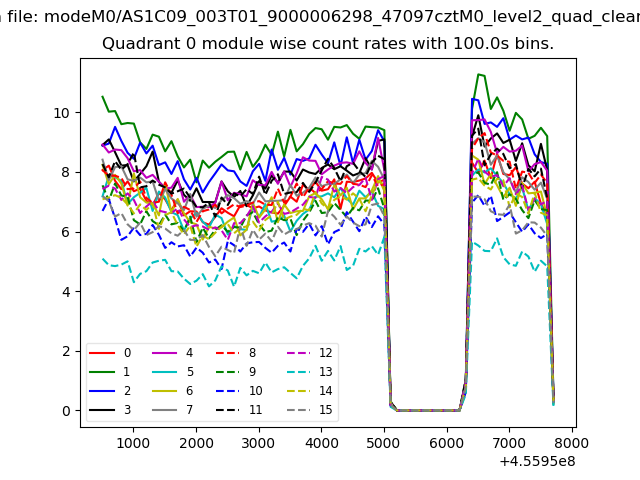 |
 |
| Module-wise count rates for Quadrant B Data is divided into 100 sec bins |
 |
 |
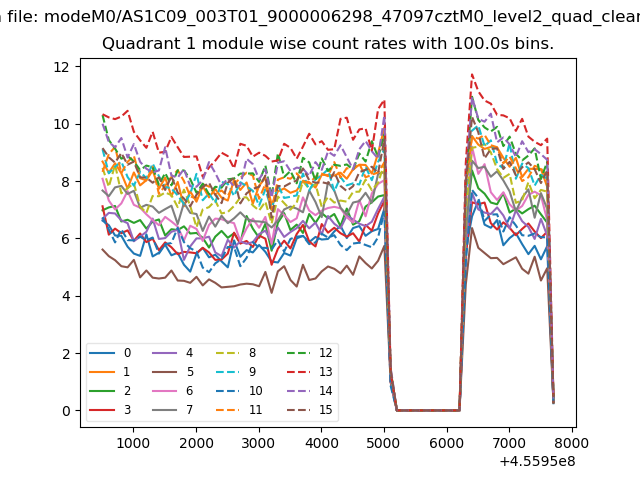
| Module-wise count rates for Quadrant C Data is divided into 100 sec bins |
 |
 |
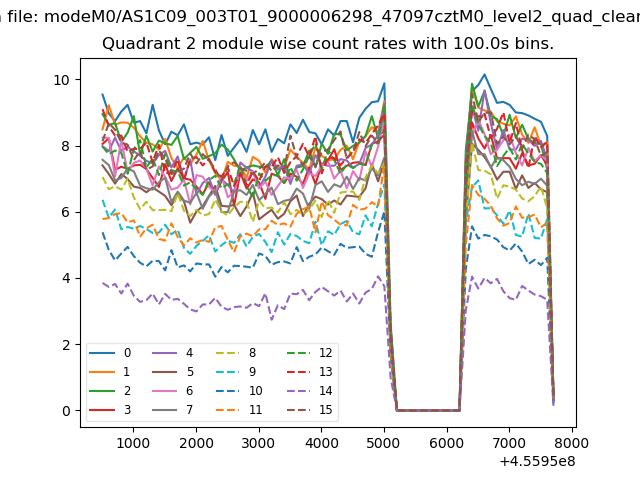
| Module-wise count rates for Quadrant D Data is divided into 100 sec bins |
 |
 |
| Parameter | Plot |
|---|---|
| CZT HV Monitor | 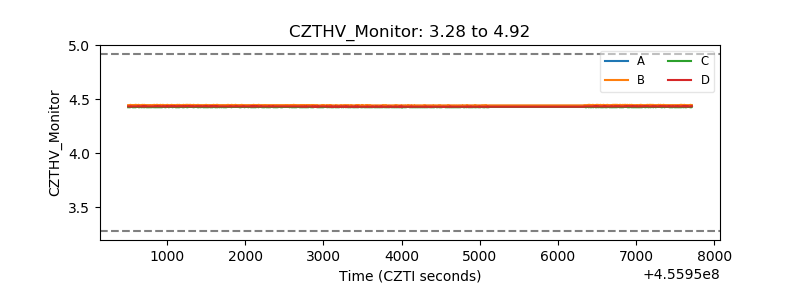 |
| D_VDD | 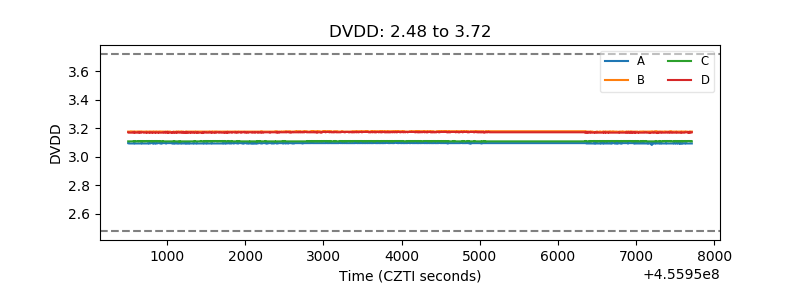 |
| Temperature 1 | 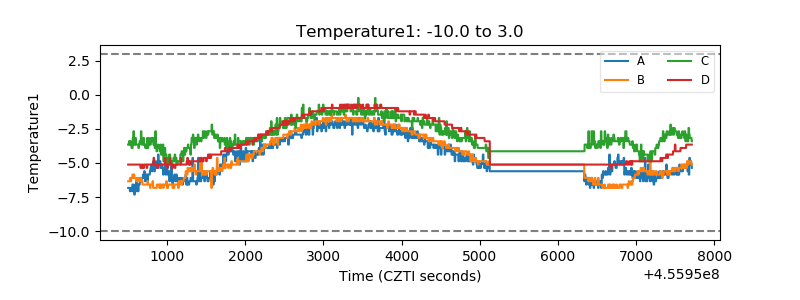 |
| Veto HV Monitor | 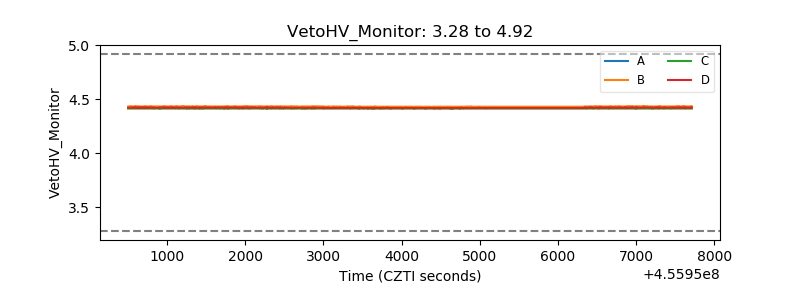 |
| Veto LLD | 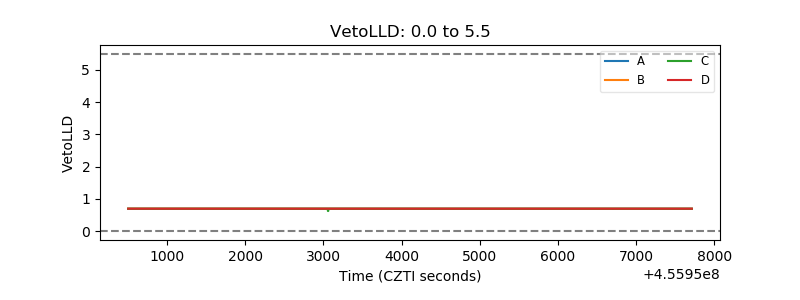 |
| Alpha Counter | 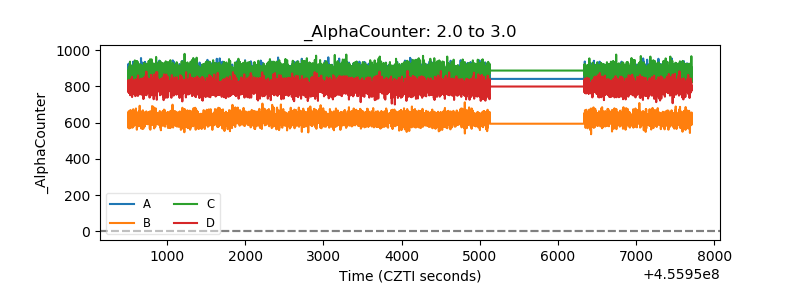 |
| _CPM_Rate | 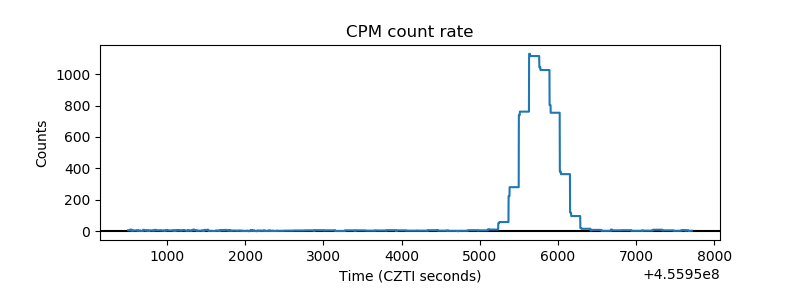 |
| CZT Counter | 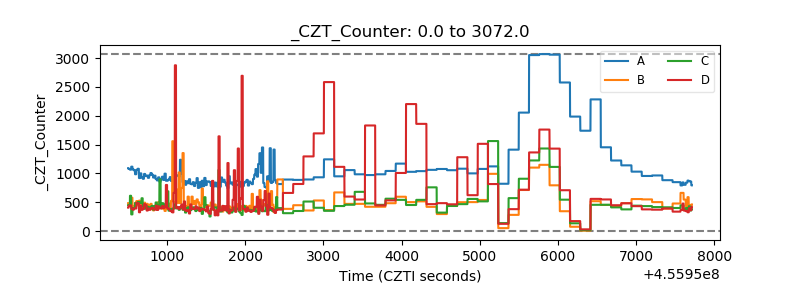 |
| +2.5 Volts monitor |  |
| +5 Volts monitor |  |
| _ROLL_ROT | 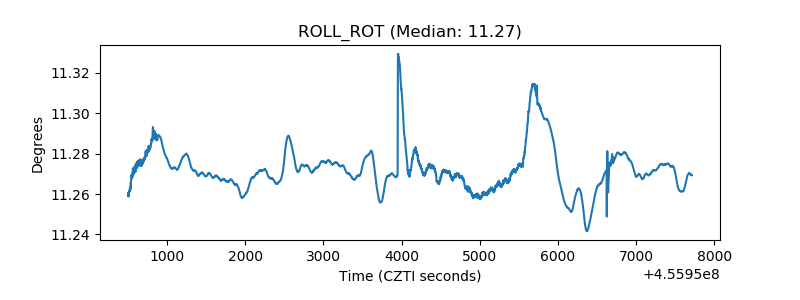 |
| _Roll_DEC | 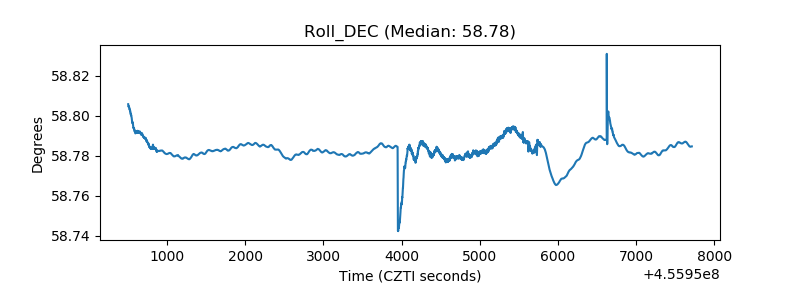 |
| _Roll_RA | 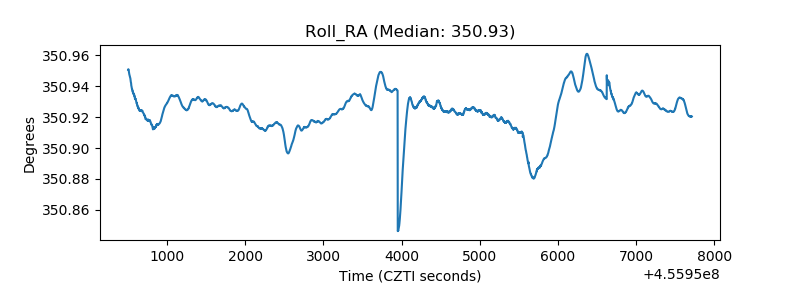 |
| Veto Counter |  |