| Param | Original file | Final file |
|---|---|---|
| Filename | modeM0/AS1A13_037T01_9000006440_49757cztM0_level2.fits | modeM0/AS1A13_037T01_9000006440_49757cztM0_level2_quad_clean.evt |
| Size (bytes) | 1,308,686,400 | 53,288,640 |
| Size | 1.2 GB | 50.8 MB |
| Events in quadrant A | 18,075,825 | 208,992 |
| Events in quadrant B | 5,288,120 | 681,348 |
| Events in quadrant C | 6,876,096 | 3,754 |
| Events in quadrant D | 17,672,301 | 231,629 |
| Mode SS | |||
|---|---|---|---|
| Quadrant | BADHDUFLAG | Total packets | Discarded packets |
| A | 0 | 136 | 0 |
| B | 0 | 136 | 0 |
| C | 0 | 136 | 0 |
| D | 0 | 136 | 0 |
| Mode M0 | |||
|---|---|---|---|
| Quadrant | BADHDUFLAG | Total packets | Discarded packets |
| A | 0 | 58451 | 0 |
| B | 0 | 20341 | 0 |
| C | 0 | 25342 | 0 |
| D | 0 | 57227 | 0 |
| Quadrant | Total seconds | Saturated seconds | Saturation percentage |
|---|---|---|---|
| A | 6857 | 6857 | 100.000000% |
| B | 6858 | 439 | 6.401283% |
| C | 6858 | 6858 | 100.000000% |
| D | 6858 | 6748 | 98.396034% |
Noise dominated data is calculated using 1-second bins in cleaned event files. If a bin has >2000 counts, and if more than 50% of those come from <1% of pixels, then it is considered to be noise-dominated and hence unusable.
| Quadrant | # 1 sec bins | Bins with >0 counts | Bins with >2000 counts | High rate bins dominated by noise | Noise dominated (total time) | Noise dominated (detector-on time) | Marked lightcurve |
|---|---|---|---|---|---|---|---|
| A | 6856 | 6856 | 6735 | 6735 | 98.24% | 98.24% | 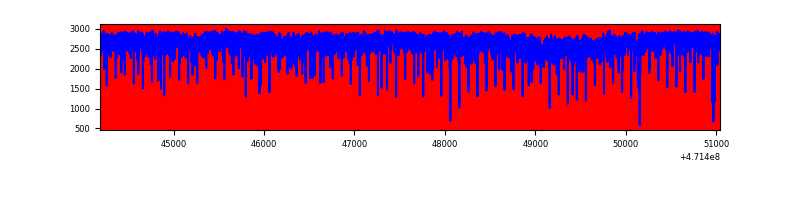 |
| B | 6858 | 6858 | 355 | 355 | 5.18% | 5.18% | 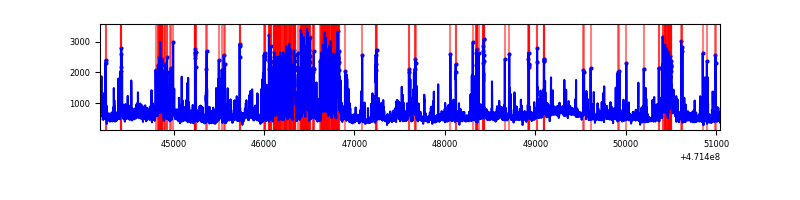 |
| C | 6857 | 6857 | 0 | 0 | 0.00% | 0.00% | 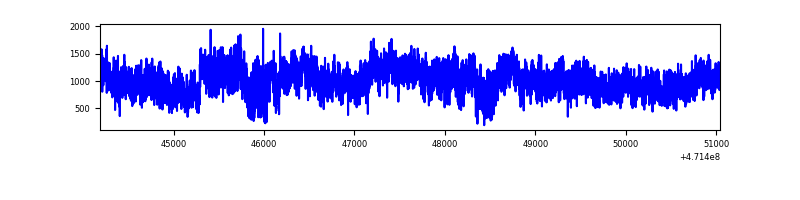 |
| D | 6857 | 6857 | 6655 | 6655 | 97.05% | 97.05% | 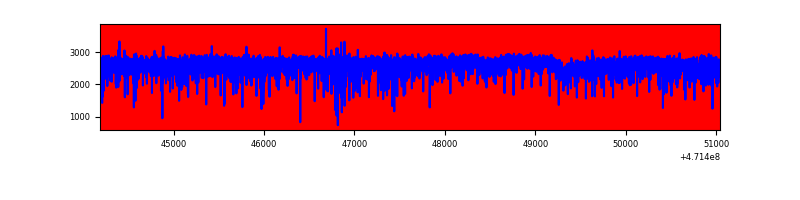 |
Top three noisy pixels from each quadrant. If the there are fewer than three noisy pixels in the level2.evt file, extra rows are filled as -1
| Pixel properties | Quadrant properties | ||||||
|---|---|---|---|---|---|---|---|
| Quadrant | DetID | PixID | Counts | Sigma | Mean | Median | Sigma |
| A | 0 | 98 | 4687973 | 63145.64 | 252 | 243 | 74.2 |
| A | 10 | 83 | 4095750 | 55168.15 | 252 | 243 | 74.2 |
| A | 12 | 50 | 2117271 | 28517.23 | 252 | 243 | 74.2 |
| B | 3 | 232 | 1047783 | 6882.7 | 710 | 690 | 152.1 |
| B | 4 | 21 | 284427 | 1865.05 | 710 | 690 | 152.1 |
| B | 10 | 128 | 264476 | 1733.91 | 710 | 690 | 152.1 |
| C | 15 | 180 | 1468947 | 115083.7 | 16 | 15 | 12.8 |
| C | 15 | 190 | 1091482 | 85511.15 | 16 | 15 | 12.8 |
| C | 15 | 181 | 857183 | 67154.96 | 16 | 15 | 12.8 |
| D | 15 | 168 | 4287315 | 39318.29 | 306 | 292 | 109.0 |
| D | 15 | 25 | 2215319 | 20315.05 | 306 | 292 | 109.0 |
| D | 15 | 40 | 1141129 | 10463.15 | 306 | 292 | 109.0 |
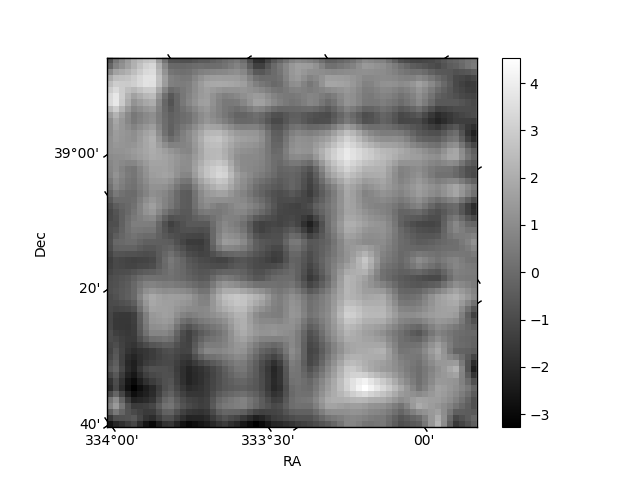
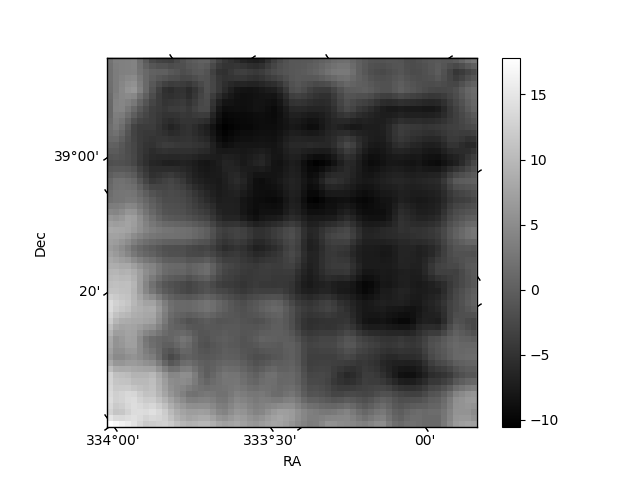
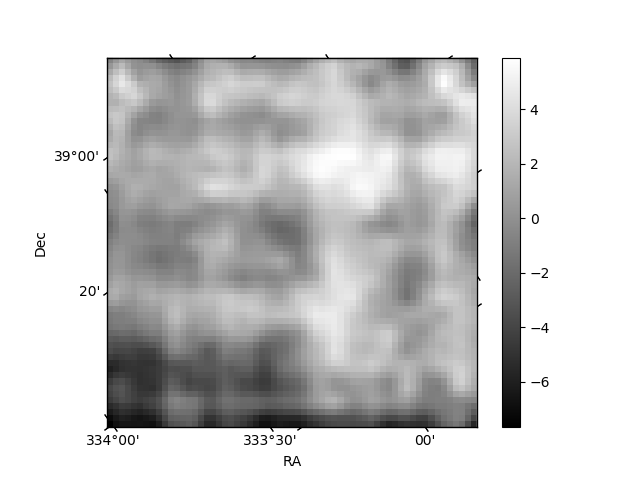
Histogram calculated using DETX and DETY for each event in the final _common_clean file
| Quadrant A | 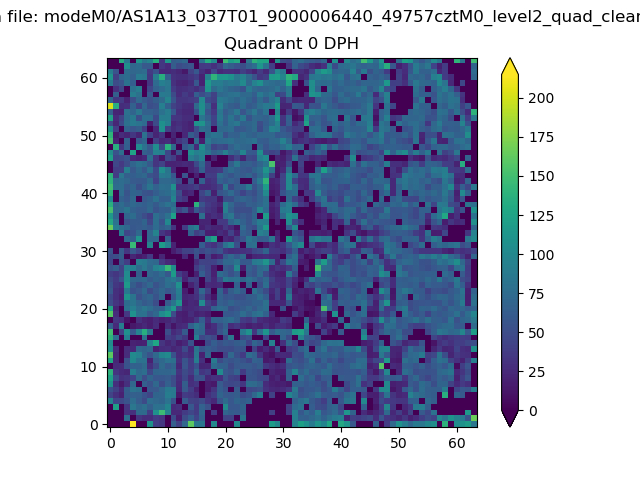 |
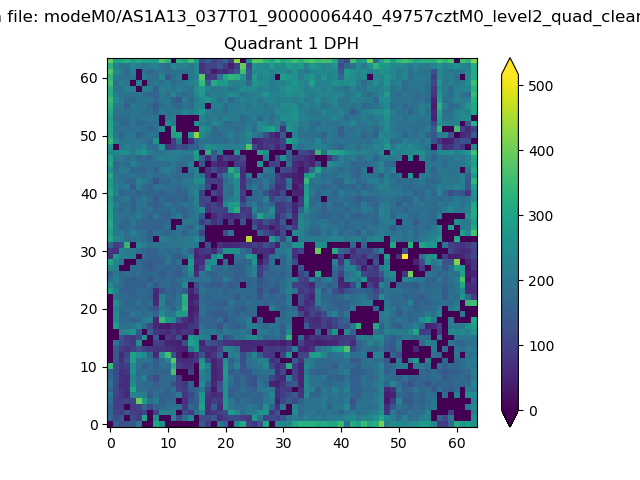 |
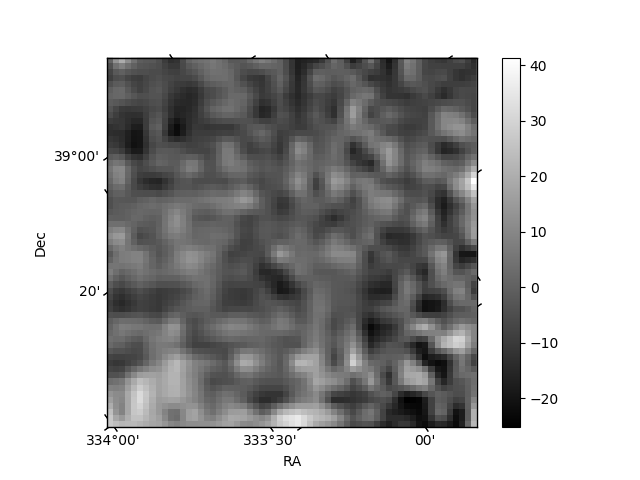
Quadrant B |
|---|---|---|---|
| Quadrant D | 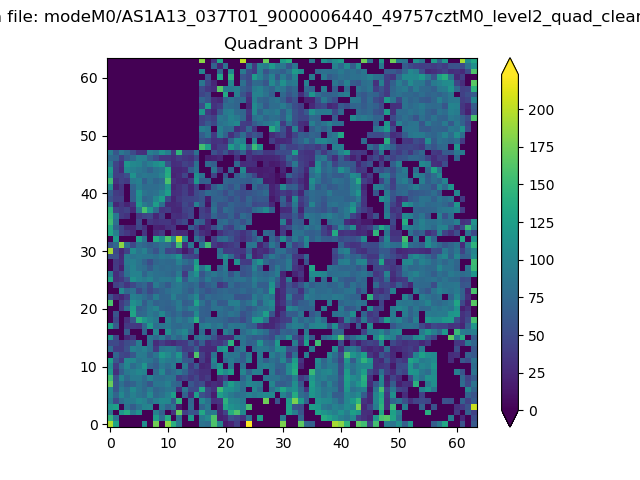 |
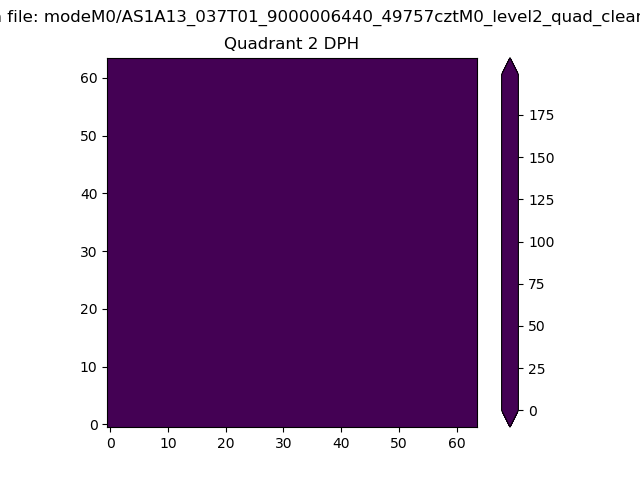 |
Quadrant C |
| Plot type | Count rate plots | Images |
|---|---|---|
| Comparison with Poisson distribution Blue bars denote a histogram of data divided into 1 sec bins. Red curve is a Poisson curve with rate = median count rate of data. |
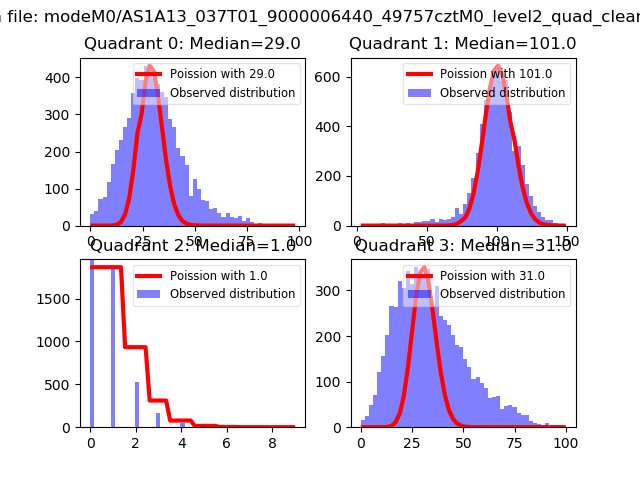 |
 |
| Quadrant-wise count rates Data is divided into 100 sec bins |
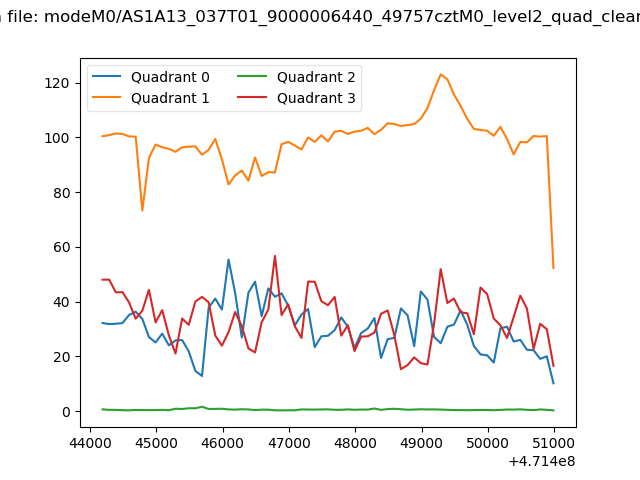 |
|
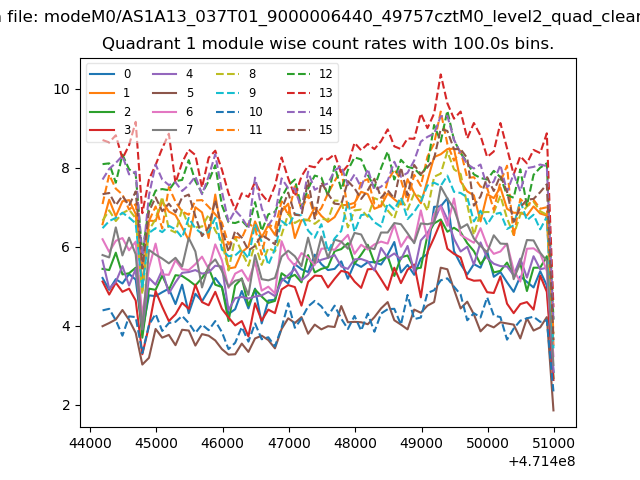
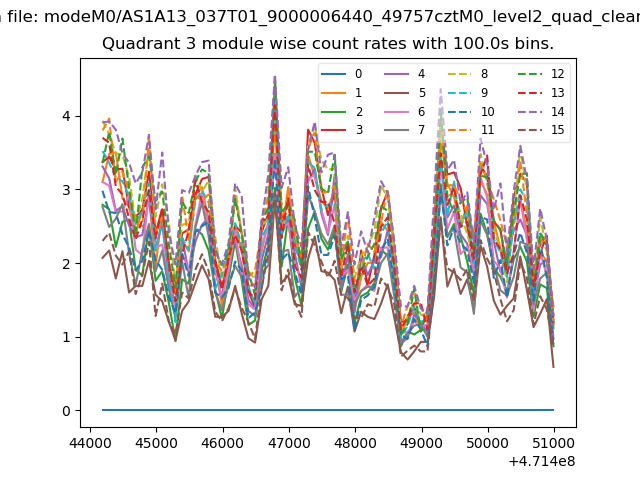
| Module-wise count rates for Quadrant A Data is divided into 100 sec bins |
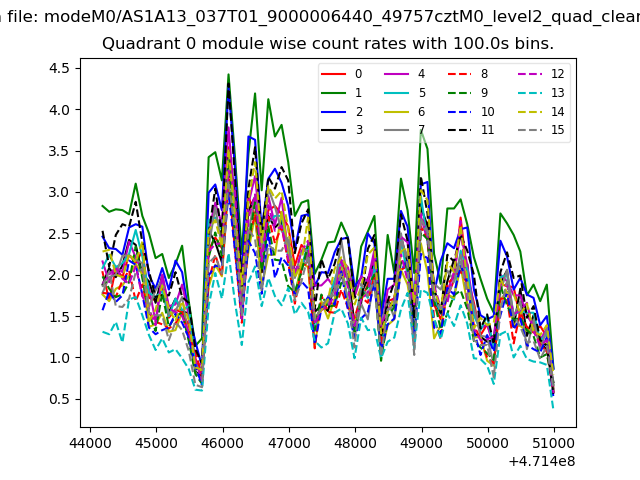 |
 |
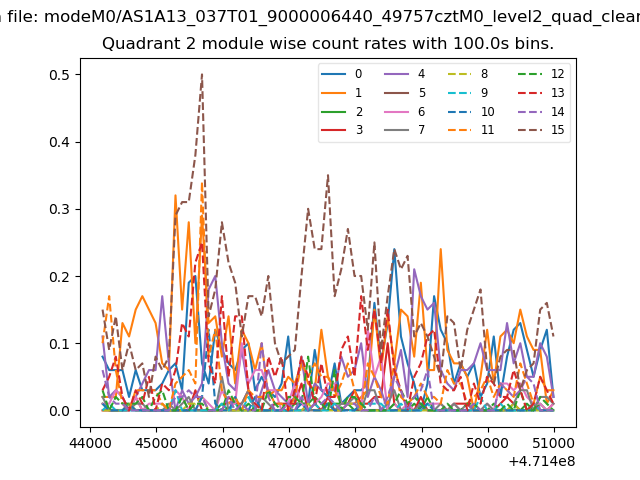
| Module-wise count rates for Quadrant B Data is divided into 100 sec bins |
 |
 |
| Module-wise count rates for Quadrant C Data is divided into 100 sec bins |
 |
 |
| Module-wise count rates for Quadrant D Data is divided into 100 sec bins |
 |
 |
| Parameter | Plot |
|---|---|
| CZT HV Monitor | 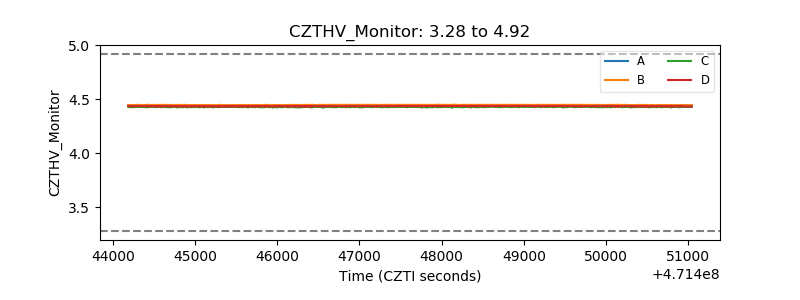 |
| D_VDD | 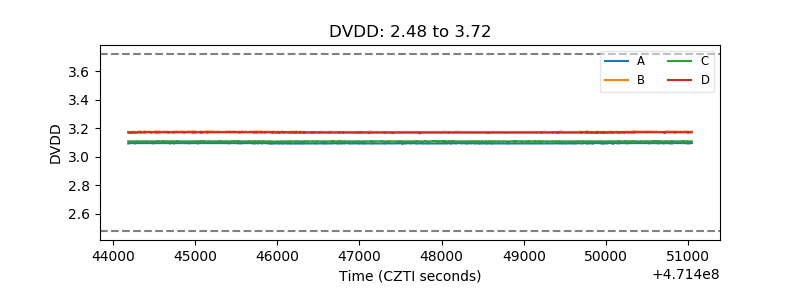 |
| Temperature 1 | 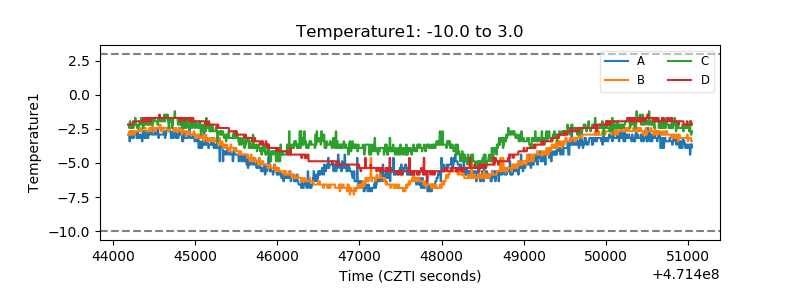 |
| Veto HV Monitor | 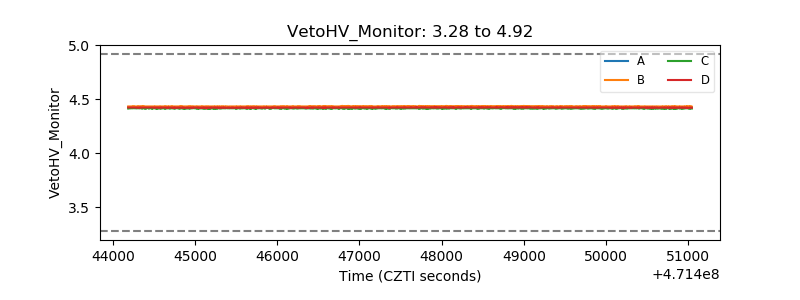 |
| Veto LLD | 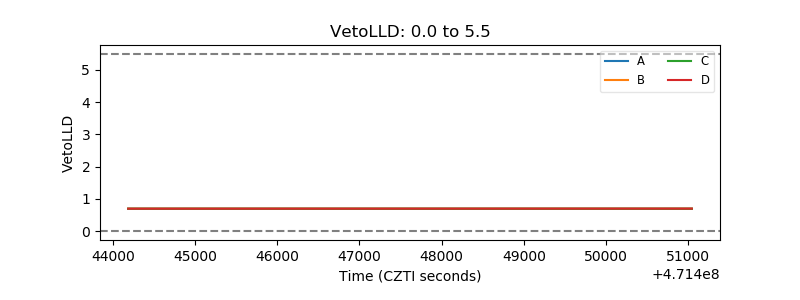 |
| Alpha Counter | 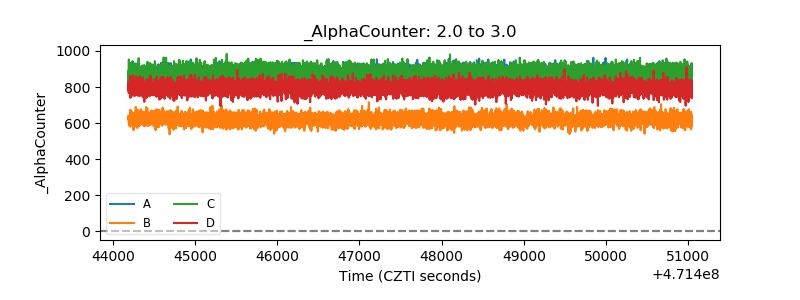 |
| _CPM_Rate | 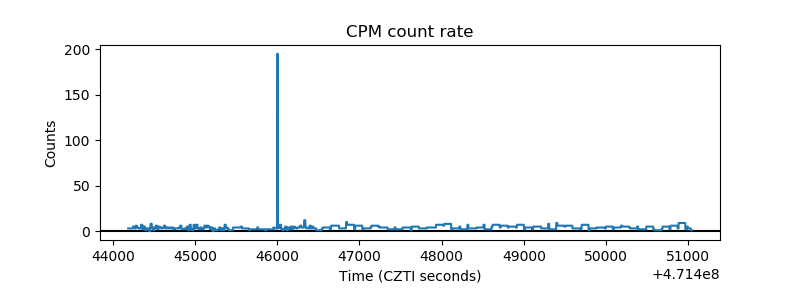 |
| CZT Counter | 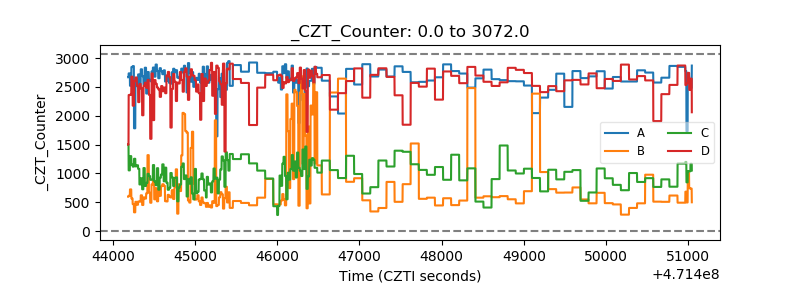 |
| +2.5 Volts monitor | 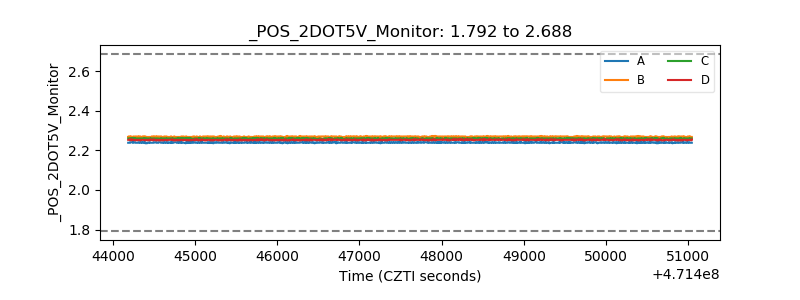 |
| +5 Volts monitor |  |
| _ROLL_ROT | 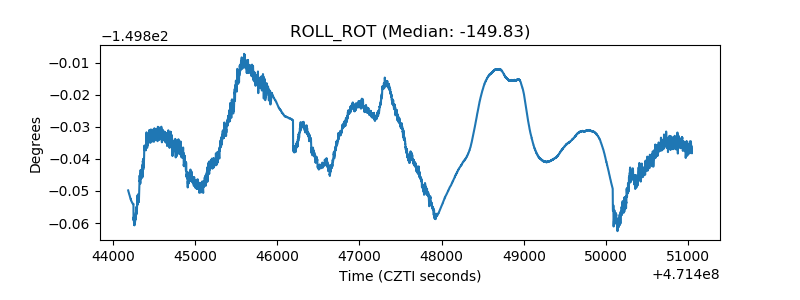 |
| _Roll_DEC | 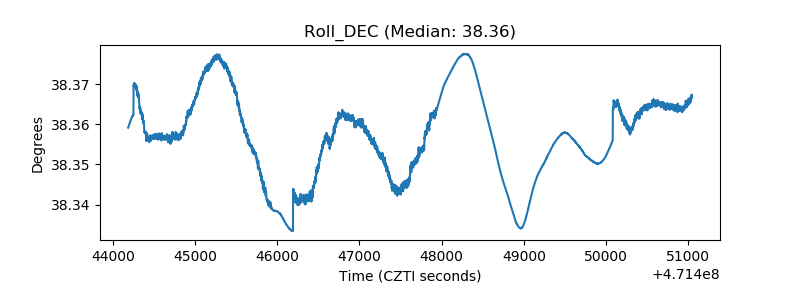 |
| _Roll_RA | 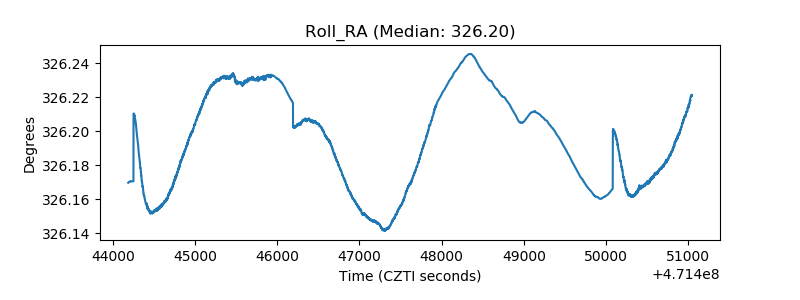 |
| Veto Counter | 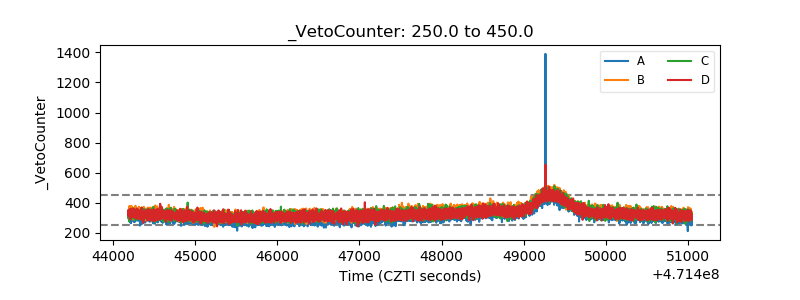 |