| Param | Original file | Final file |
|---|---|---|
| Filename | modeM0/AS1A13_037T01_9000006440_49816cztM0_level2.fits | modeM0/AS1A13_037T01_9000006440_49816cztM0_level2_quad_clean.evt |
| Size (bytes) | 1,402,657,920 | 59,008,320 |
| Size | 1.3 GB | 56.3 MB |
| Events in quadrant A | 16,003,704 | 340,216 |
| Events in quadrant B | 5,462,517 | 708,786 |
| Events in quadrant C | 12,576,235 | 38,341 |
| Events in quadrant D | 17,321,922 | 186,877 |
| Mode SS | |||
|---|---|---|---|
| Quadrant | BADHDUFLAG | Total packets | Discarded packets |
| A | 0 | 144 | 0 |
| B | 0 | 144 | 0 |
| C | 0 | 144 | 0 |
| D | 0 | 144 | 0 |
| Mode M0 | |||
|---|---|---|---|
| Quadrant | BADHDUFLAG | Total packets | Discarded packets |
| A | 0 | 52464 | 0 |
| B | 0 | 21123 | 0 |
| C | 0 | 42399 | 0 |
| D | 0 | 56264 | 0 |
| Quadrant | Total seconds | Saturated seconds | Saturation percentage |
|---|---|---|---|
| A | 7219 | 5436 | 75.301288% |
| B | 7220 | 585 | 8.102493% |
| C | 7220 | 7220 | 100.000000% |
| D | 7220 | 7176 | 99.390582% |
Noise dominated data is calculated using 1-second bins in cleaned event files. If a bin has >2000 counts, and if more than 50% of those come from <1% of pixels, then it is considered to be noise-dominated and hence unusable.
| Quadrant | # 1 sec bins | Bins with >0 counts | Bins with >2000 counts | High rate bins dominated by noise | Noise dominated (total time) | Noise dominated (detector-on time) | Marked lightcurve |
|---|---|---|---|---|---|---|---|
| A | 7218 | 7218 | 5290 | 5290 | 73.29% | 73.29% | 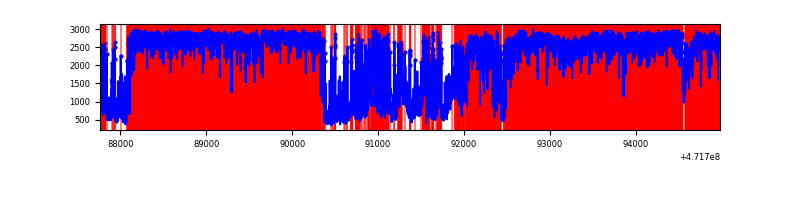 |
| B | 7220 | 7220 | 491 | 491 | 6.80% | 6.80% | 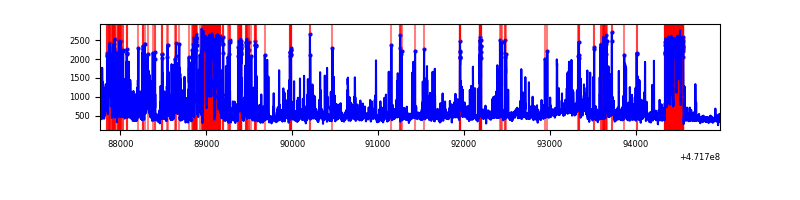 |
| C | 7219 | 7219 | 2015 | 2015 | 27.91% | 27.91% | 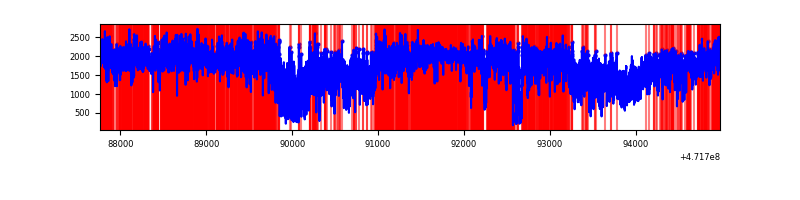 |
| D | 7219 | 7219 | 6826 | 6826 | 94.56% | 94.56% | 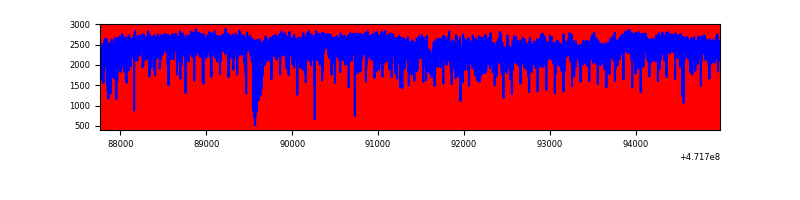 |
Top three noisy pixels from each quadrant. If the there are fewer than three noisy pixels in the level2.evt file, extra rows are filled as -1
| Pixel properties | Quadrant properties | ||||||
|---|---|---|---|---|---|---|---|
| Quadrant | DetID | PixID | Counts | Sigma | Mean | Median | Sigma |
| A | 0 | 98 | 10828211 | 97131.7 | 400 | 386 | 111.5 |
| A | 15 | 63 | 488210 | 4376.06 | 400 | 386 | 111.5 |
| A | 4 | 204 | 482038 | 4320.69 | 400 | 386 | 111.5 |
| B | 10 | 44 | 1296912 | 8274.95 | 740 | 718 | 156.6 |
| B | 4 | 171 | 545425 | 3477.43 | 740 | 718 | 156.6 |
| B | 1 | 255 | 148404 | 942.83 | 740 | 718 | 156.6 |
| C | 15 | 147 | 6492850 | 156436.75 | 61 | 56 | 41.5 |
| C | 15 | 197 | 2284976 | 55052.64 | 61 | 56 | 41.5 |
| C | 15 | 174 | 598108 | 14409.41 | 61 | 56 | 41.5 |
| D | 7 | 61 | 3227636 | 35382.01 | 252 | 240 | 91.2 |
| D | 7 | 126 | 1621080 | 17769.3 | 252 | 240 | 91.2 |
| D | 7 | 60 | 1245266 | 13649.25 | 252 | 240 | 91.2 |
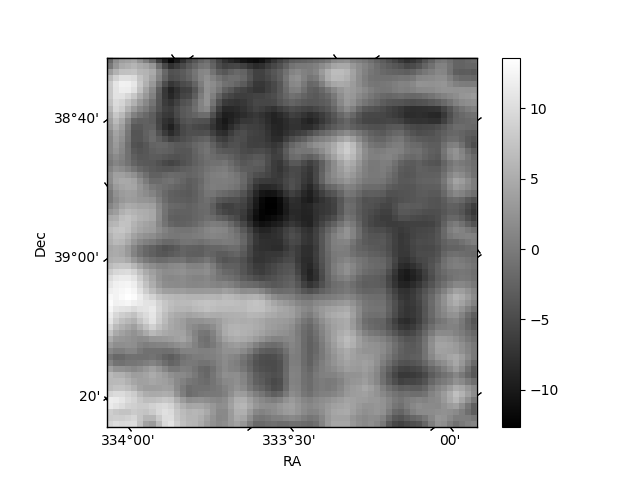
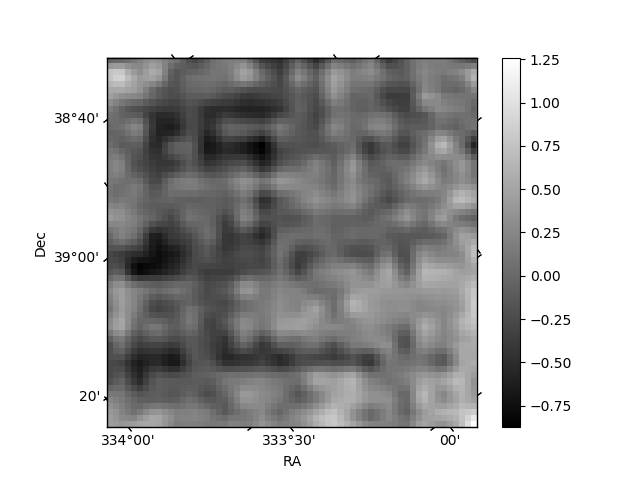
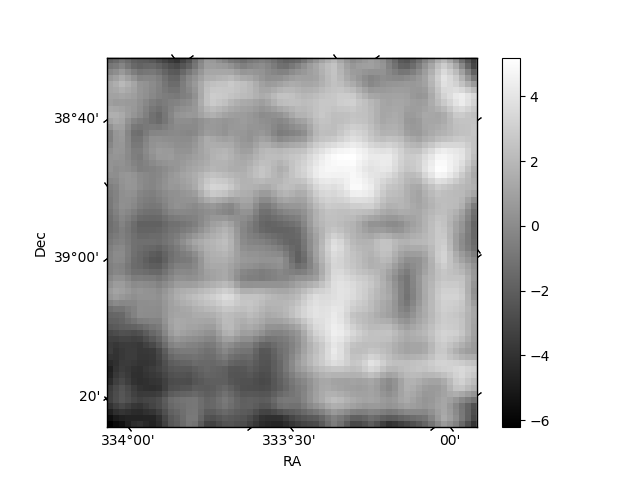
Histogram calculated using DETX and DETY for each event in the final _common_clean file
| Quadrant A | 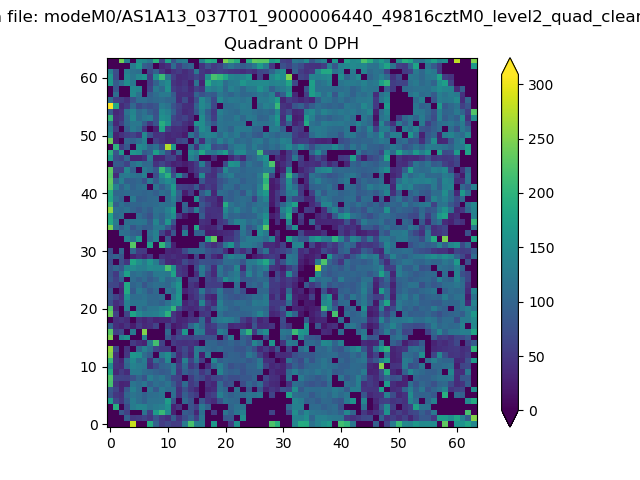 |
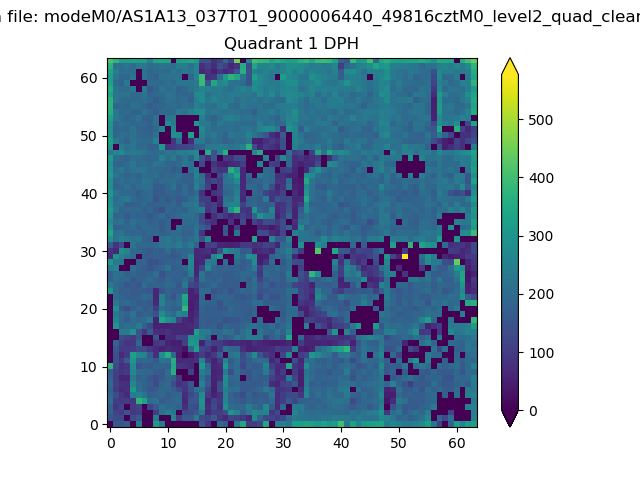 |
Quadrant B |
|---|---|---|---|
| Quadrant D | 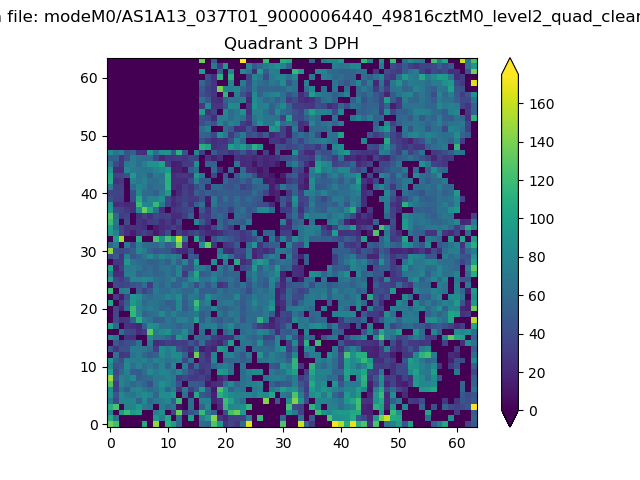 |
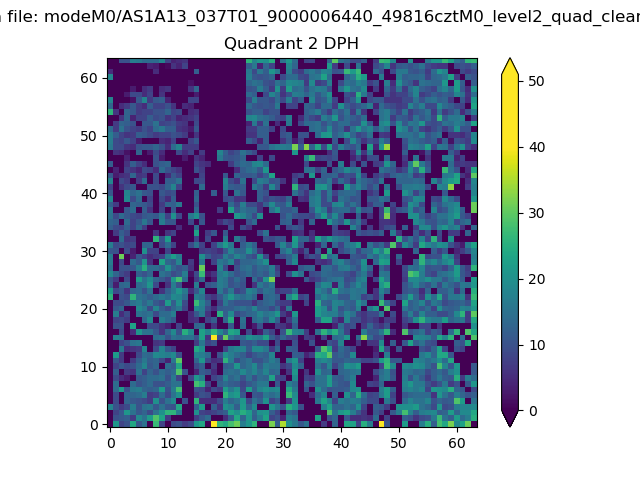 |
Quadrant C |
| Plot type | Count rate plots | Images |
|---|---|---|
| Comparison with Poisson distribution Blue bars denote a histogram of data divided into 1 sec bins. Red curve is a Poisson curve with rate = median count rate of data. |
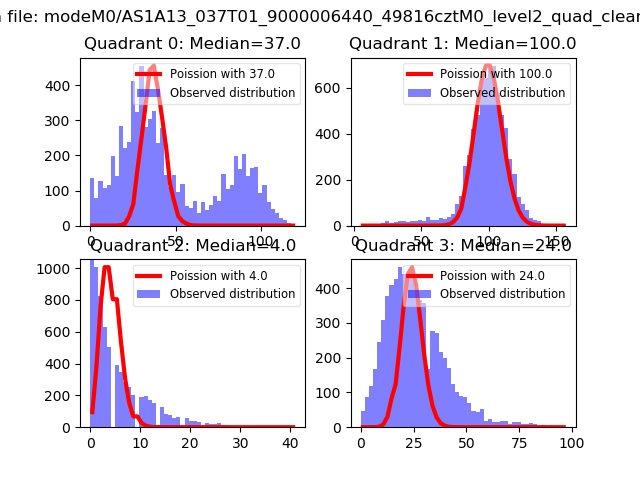 |
 |
| Quadrant-wise count rates Data is divided into 100 sec bins |
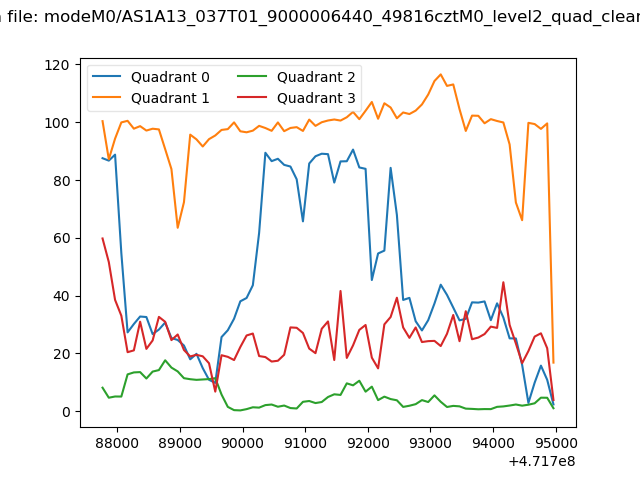 |
|
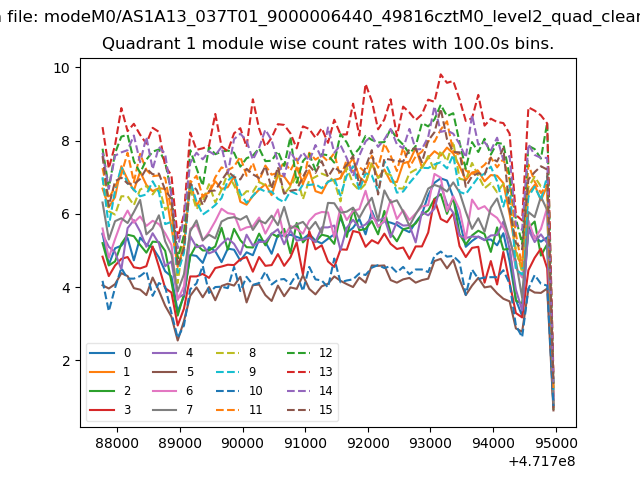
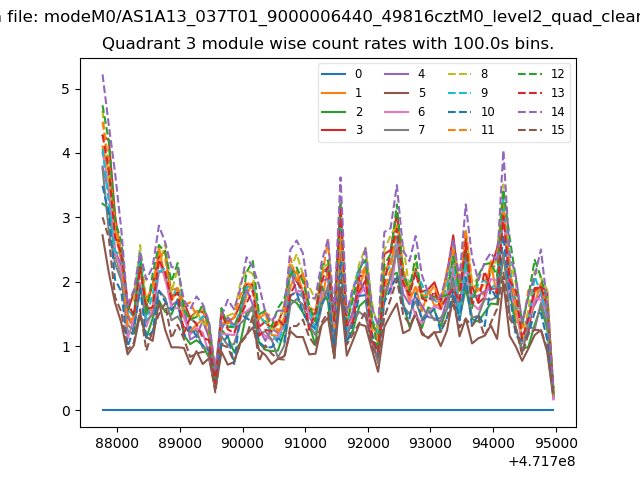
| Module-wise count rates for Quadrant A Data is divided into 100 sec bins |
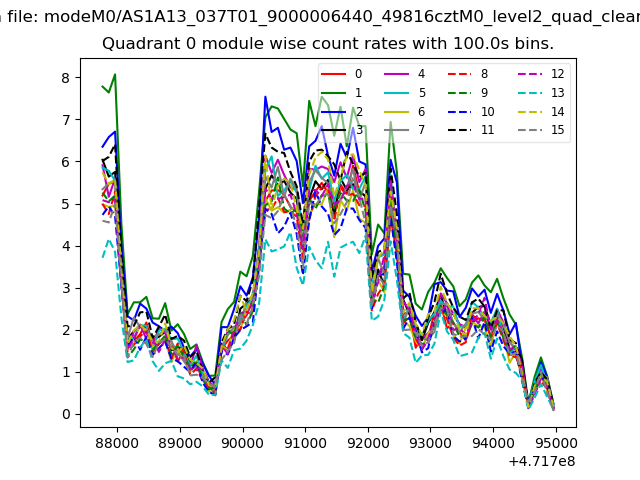 |
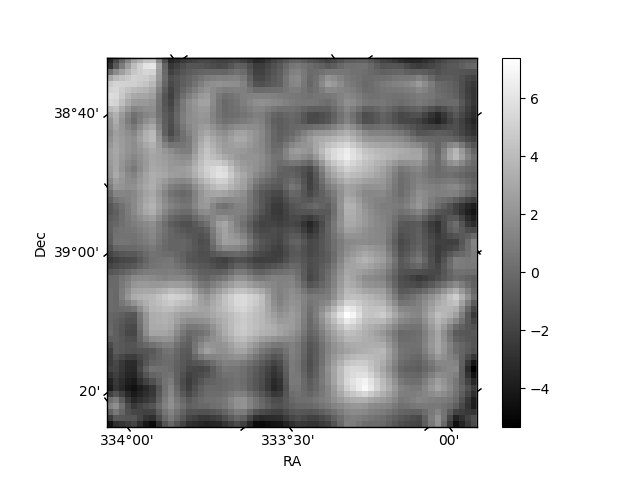 |
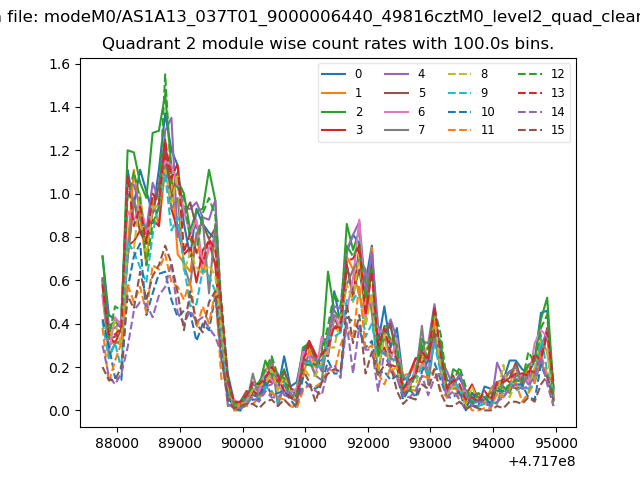
| Module-wise count rates for Quadrant B Data is divided into 100 sec bins |
 |
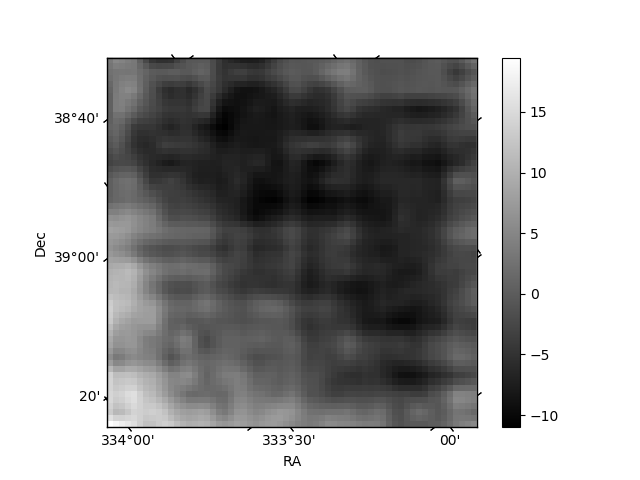 |
| Module-wise count rates for Quadrant C Data is divided into 100 sec bins |
 |
 |
| Module-wise count rates for Quadrant D Data is divided into 100 sec bins |
 |
 |
| Parameter | Plot |
|---|---|
| CZT HV Monitor | 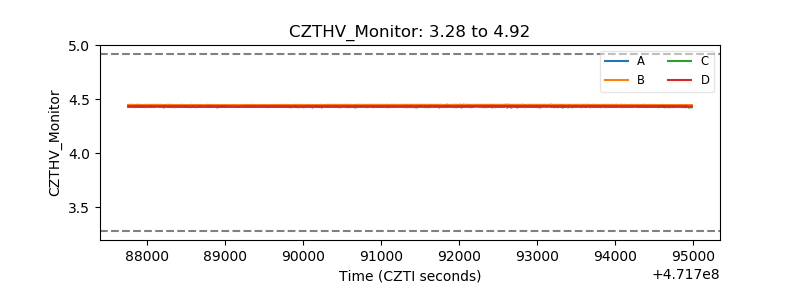 |
| D_VDD | 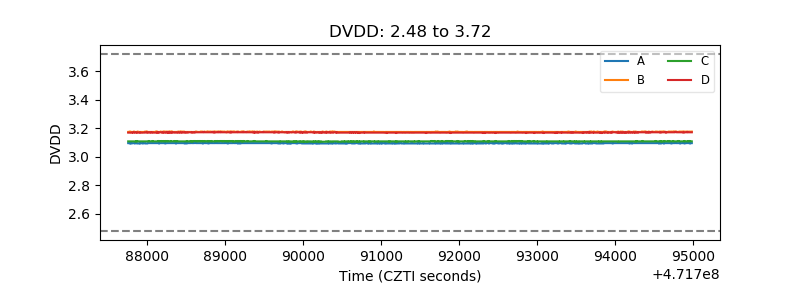 |
| Temperature 1 | 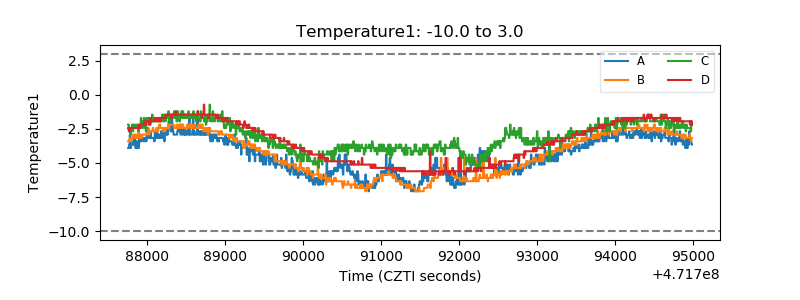 |
| Veto HV Monitor | 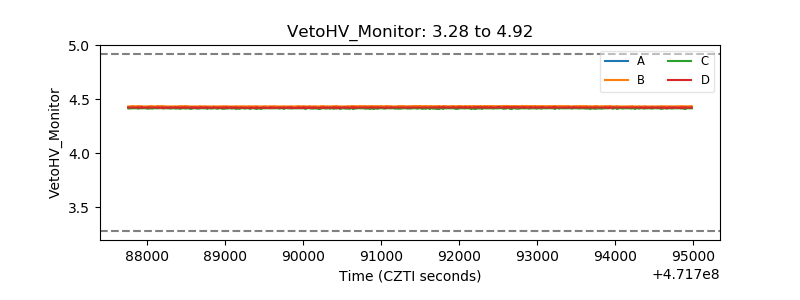 |
| Veto LLD | 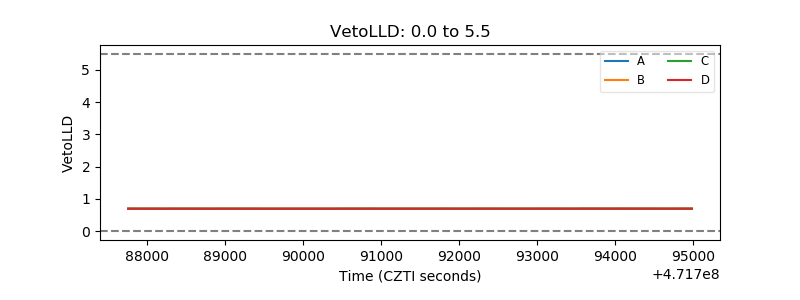 |
| Alpha Counter | 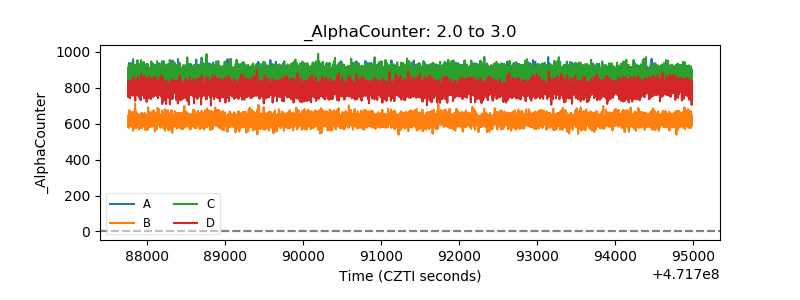 |
| _CPM_Rate | 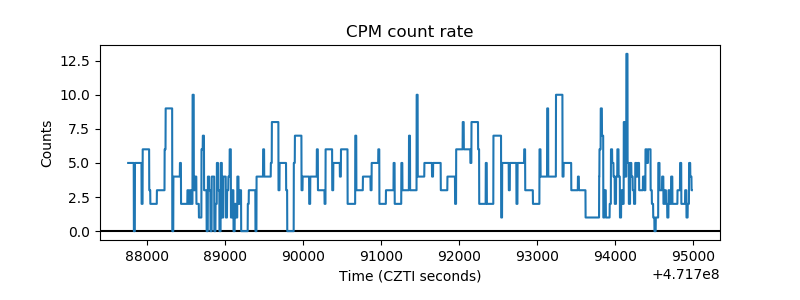 |
| CZT Counter | 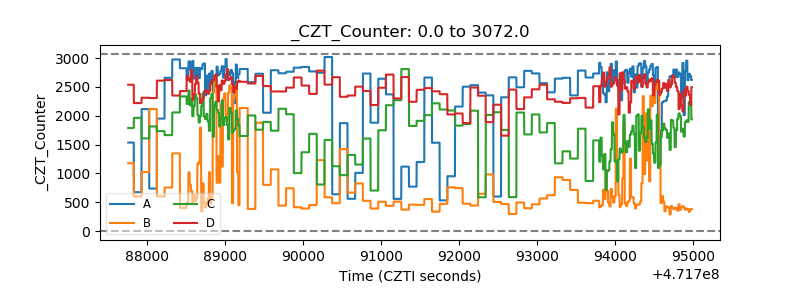 |
| +2.5 Volts monitor | 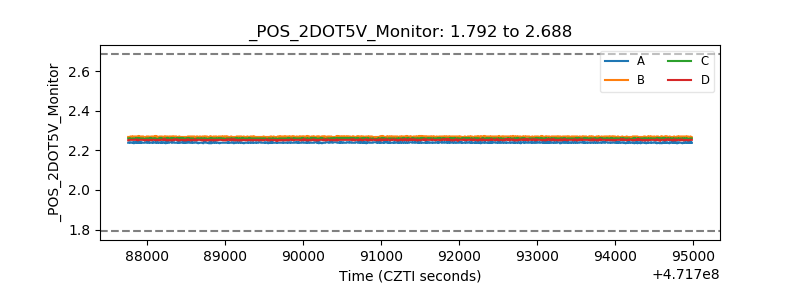 |
| +5 Volts monitor | 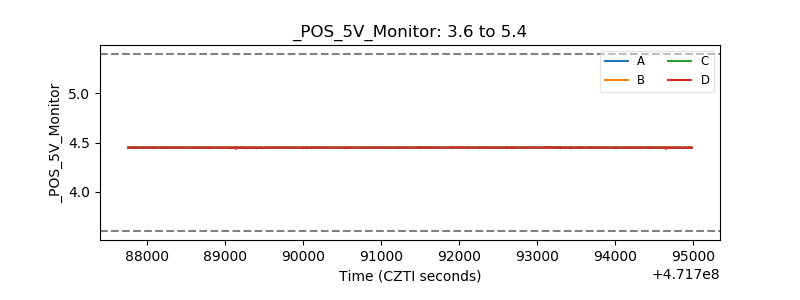 |
| _ROLL_ROT | 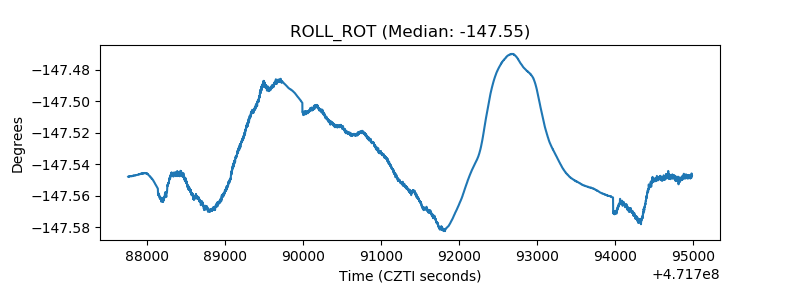 |
| _Roll_DEC | 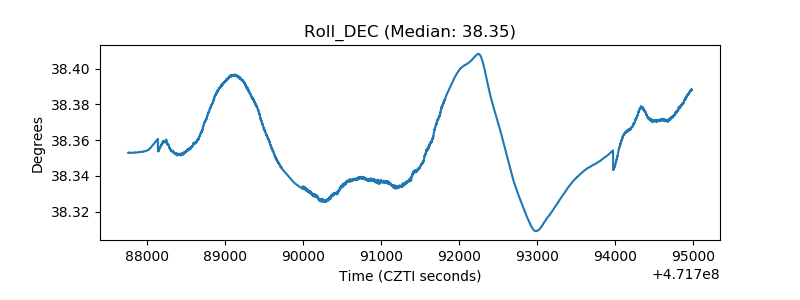 |
| _Roll_RA | 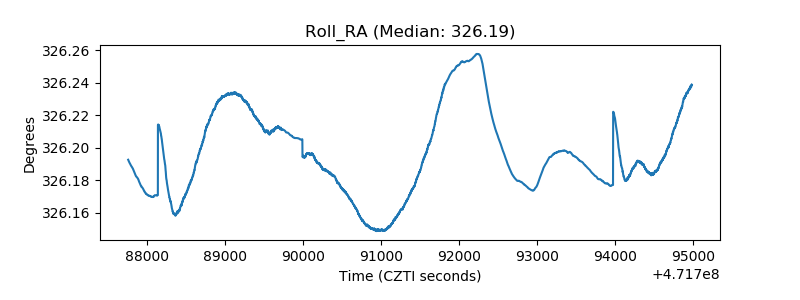 |
| Veto Counter | 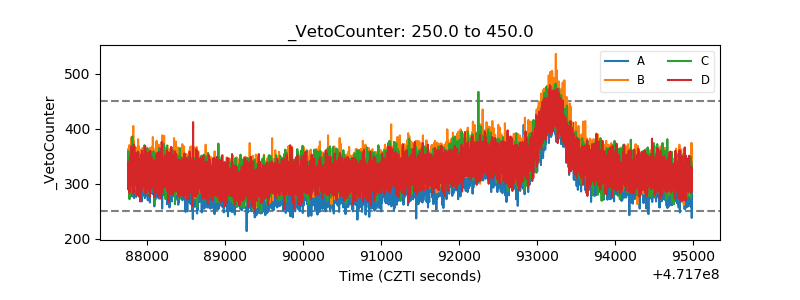 |