| Param | Original file | Final file |
|---|---|---|
| Filename | modeM0/AS1C09_003T01_9000006442_50135cztM0_level2.fits | modeM0/AS1C09_003T01_9000006442_50135cztM0_level2_quad_clean.evt |
| Size (bytes) | 1,514,073,600 | 48,150,720 |
| Size | 1.4 GB | 45.9 MB |
| Events in quadrant A | 15,599,584 | 223,487 |
| Events in quadrant B | 5,219,069 | 690,778 |
| Events in quadrant C | 16,868,475 | 20,113 |
| Events in quadrant D | 17,797,701 | 14,772 |
| Mode M0 | |||
|---|---|---|---|
| Quadrant | BADHDUFLAG | Total packets | Discarded packets |
| A | 0 | 51382 | 5 |
| B | 0 | 20636 | 0 |
| C | 0 | 55090 | 0 |
| D | 0 | 57777 | 0 |
| Mode SS | |||
|---|---|---|---|
| Quadrant | BADHDUFLAG | Total packets | Discarded packets |
| A | 0 | 146 | 0 |
| B | 0 | 146 | 0 |
| C | 0 | 146 | 0 |
| D | 0 | 146 | 0 |
| Quadrant | Total seconds | Saturated seconds | Saturation percentage |
|---|---|---|---|
| A | 7302 | 5175 | 70.870994% |
| B | 7302 | 411 | 5.628595% |
| C | 7302 | 7126 | 97.589701% |
| D | 7302 | 7172 | 98.219666% |
Noise dominated data is calculated using 1-second bins in cleaned event files. If a bin has >2000 counts, and if more than 50% of those come from <1% of pixels, then it is considered to be noise-dominated and hence unusable.
| Quadrant | # 1 sec bins | Bins with >0 counts | Bins with >2000 counts | High rate bins dominated by noise | Noise dominated (total time) | Noise dominated (detector-on time) | Marked lightcurve |
|---|---|---|---|---|---|---|---|
| A | 7302 | 7302 | 4547 | 4547 | 62.27% | 62.27% | 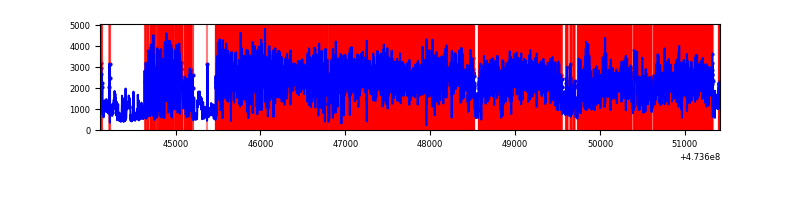 |
| B | 7302 | 7302 | 282 | 282 | 3.86% | 3.86% | 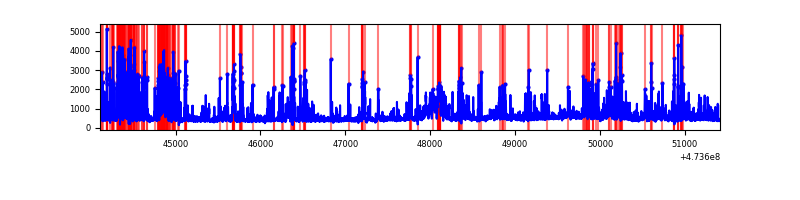 |
| C | 7302 | 7302 | 5717 | 5717 | 78.29% | 78.29% | 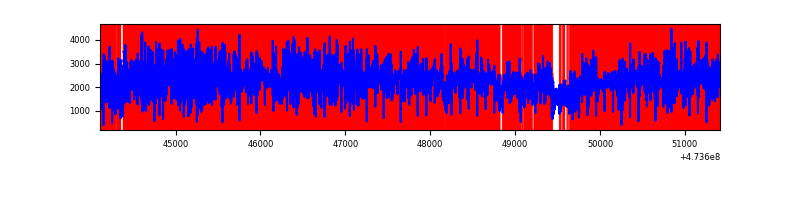 |
| D | 7302 | 7302 | 6275 | 6275 | 85.94% | 85.94% | 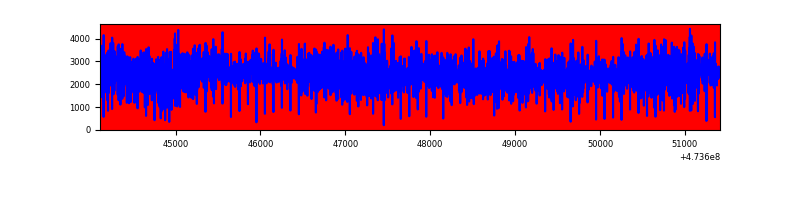 |
Top three noisy pixels from each quadrant. If the there are fewer than three noisy pixels in the level2.evt file, extra rows are filled as -1
| Pixel properties | Quadrant properties | ||||||
|---|---|---|---|---|---|---|---|
| Quadrant | DetID | PixID | Counts | Sigma | Mean | Median | Sigma |
| A | 0 | 98 | 10260667 | 75445.94 | 525 | 511 | 136.0 |
| A | 6 | 250 | 905592 | 6655.33 | 525 | 511 | 136.0 |
| A | 10 | 253 | 621731 | 4568.01 | 525 | 511 | 136.0 |
| B | 2 | 176 | 862232 | 5609.37 | 720 | 696 | 153.6 |
| B | 5 | 185 | 284273 | 1846.34 | 720 | 696 | 153.6 |
| B | 1 | 207 | 187876 | 1218.71 | 720 | 696 | 153.6 |
| C | 15 | 197 | 5025719 | 69032.94 | 239 | 236 | 72.8 |
| C | 4 | 111 | 4810515 | 66076.77 | 239 | 236 | 72.8 |
| C | 15 | 230 | 880529 | 12092.21 | 239 | 236 | 72.8 |
| D | 7 | 61 | 6662235 | 69903.35 | 304 | 292 | 95.3 |
| D | 15 | 106 | 2233977 | 23437.92 | 304 | 292 | 95.3 |
| D | 15 | 168 | 2214178 | 23230.17 | 304 | 292 | 95.3 |
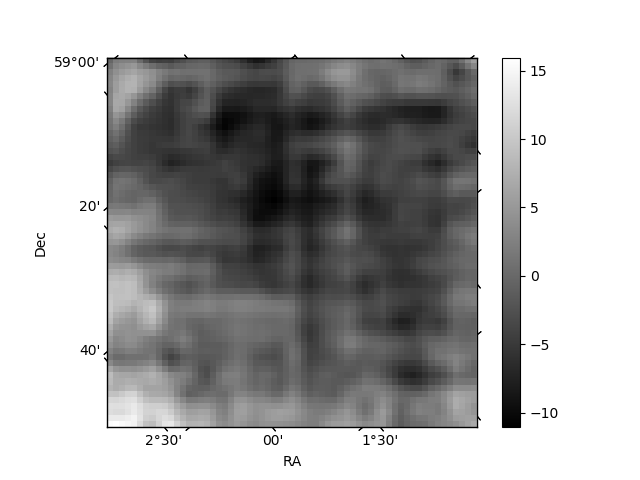
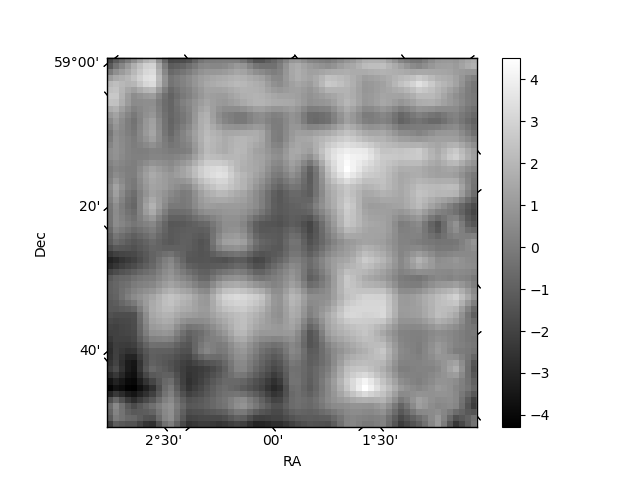
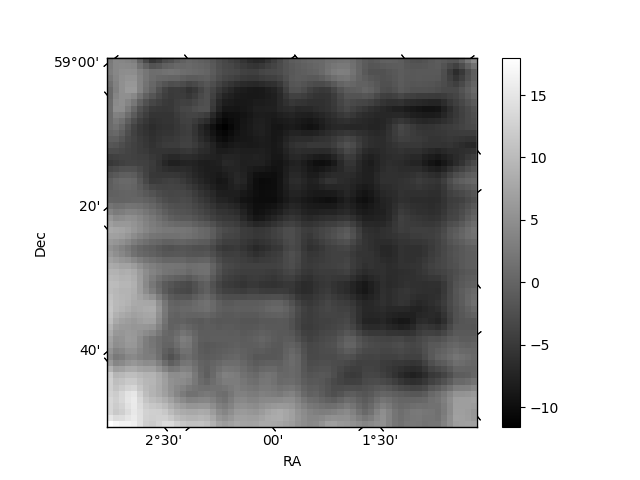
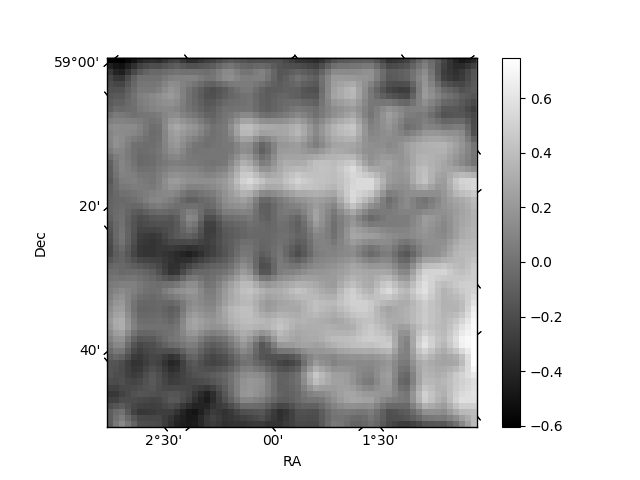
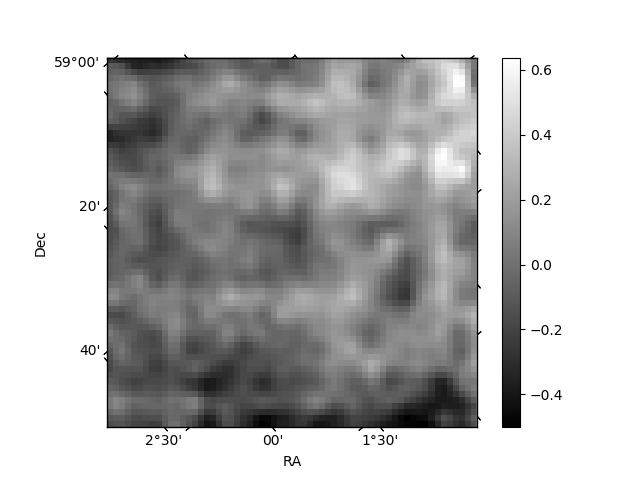
Histogram calculated using DETX and DETY for each event in the final _common_clean file
| Quadrant A | 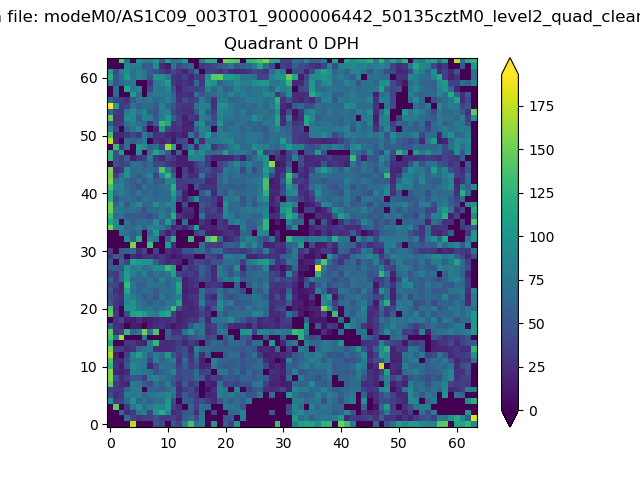 |
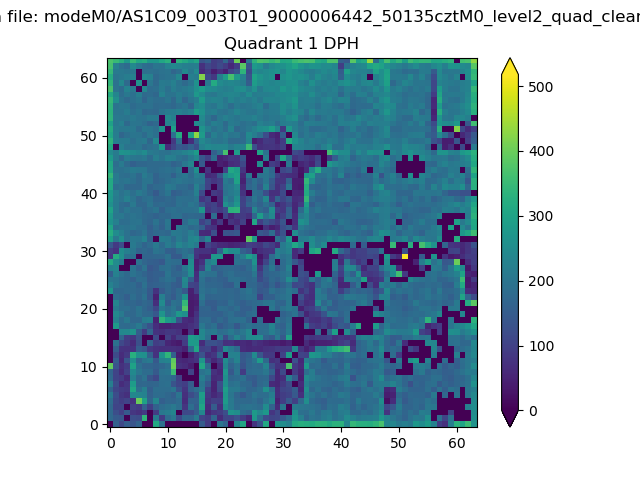 |
Quadrant B |
|---|---|---|---|
| Quadrant D | 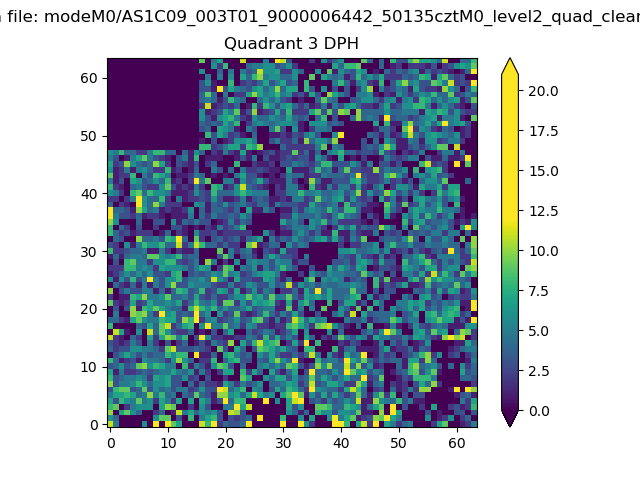 |
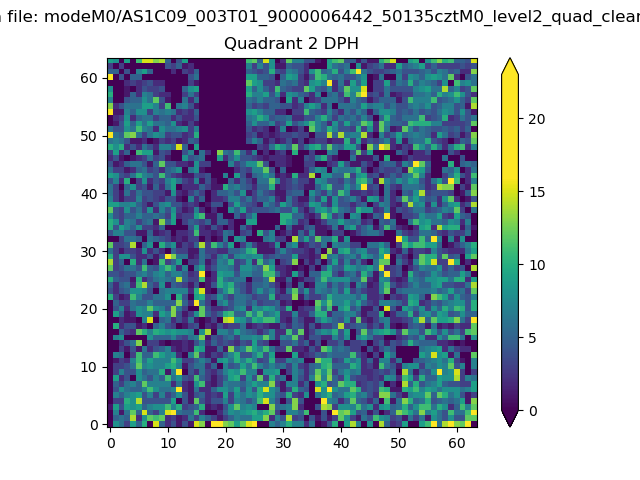 |
Quadrant C |
| Plot type | Count rate plots | Images |
|---|---|---|
| Comparison with Poisson distribution Blue bars denote a histogram of data divided into 1 sec bins. Red curve is a Poisson curve with rate = median count rate of data. |
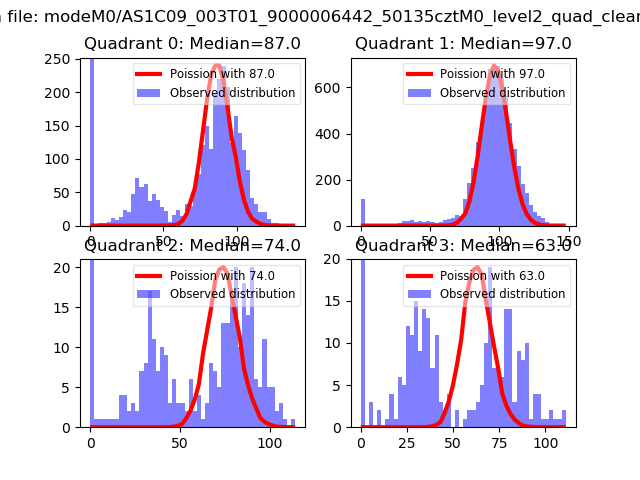 |
 |
| Quadrant-wise count rates Data is divided into 100 sec bins |
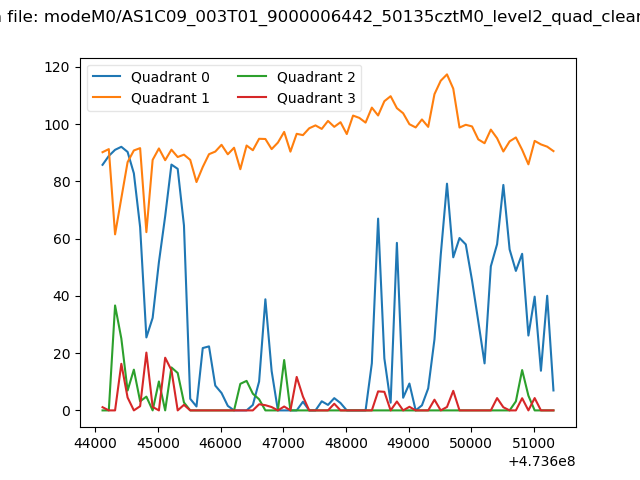 |
|
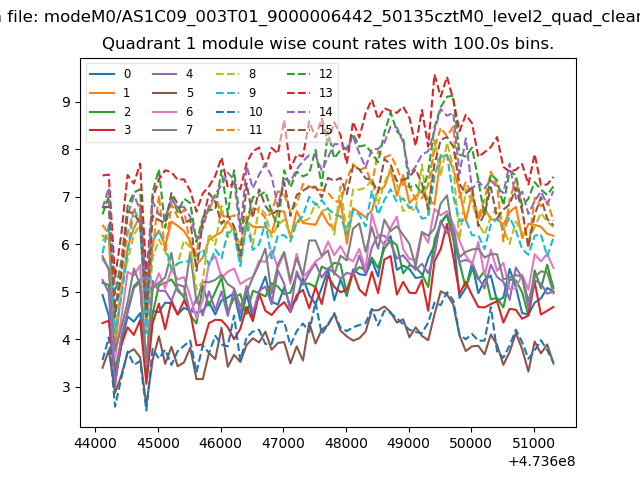
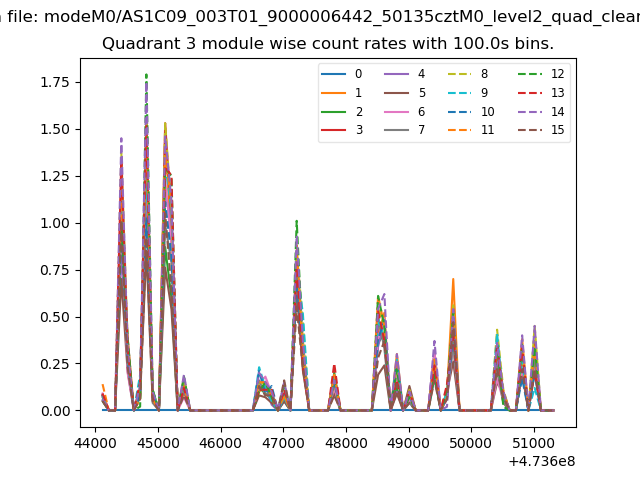
| Module-wise count rates for Quadrant A Data is divided into 100 sec bins |
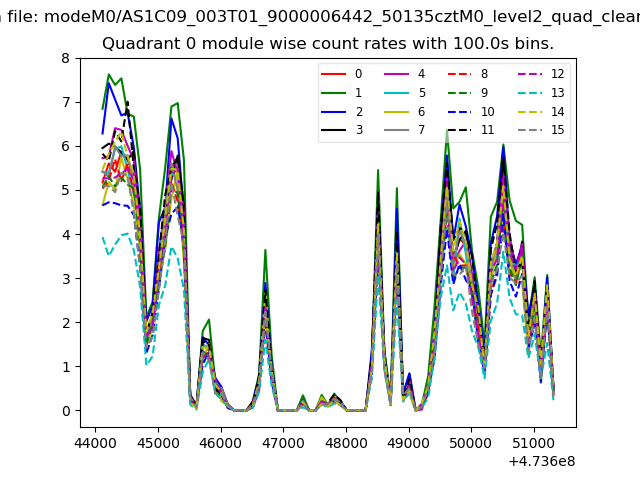 |
 |
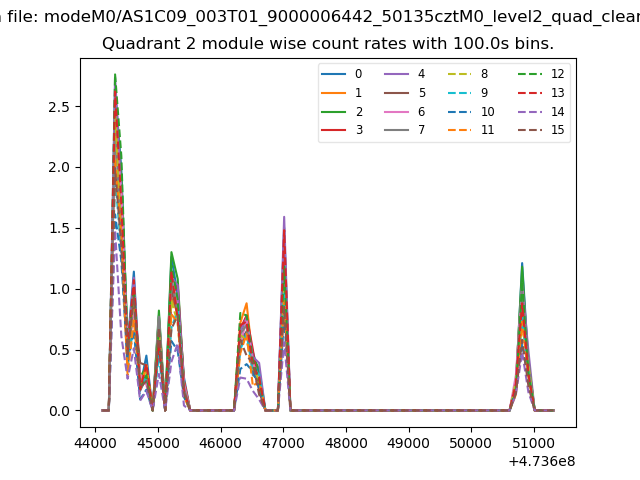
| Module-wise count rates for Quadrant B Data is divided into 100 sec bins |
 |
 |
| Module-wise count rates for Quadrant C Data is divided into 100 sec bins |
 |
 |
| Module-wise count rates for Quadrant D Data is divided into 100 sec bins |
 |
 |
| Parameter | Plot |
|---|---|
| CZT HV Monitor | 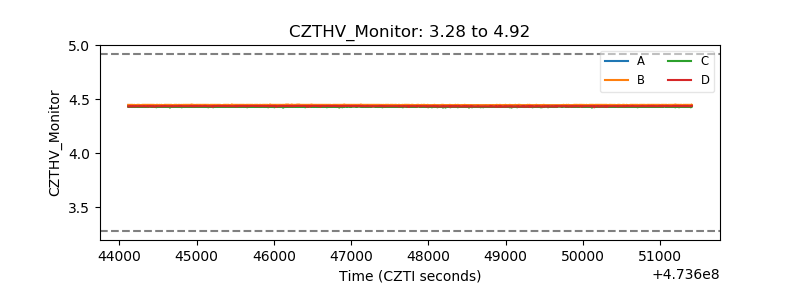 |
| D_VDD | 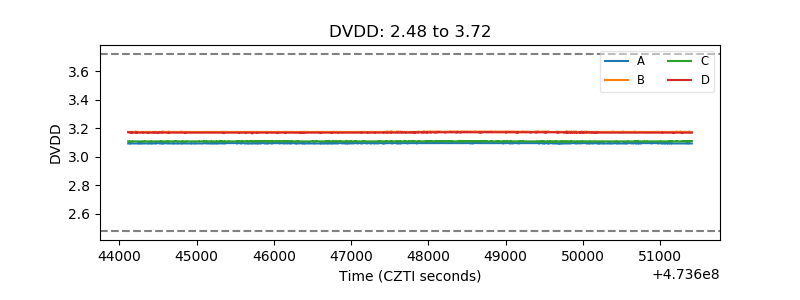 |
| Temperature 1 | 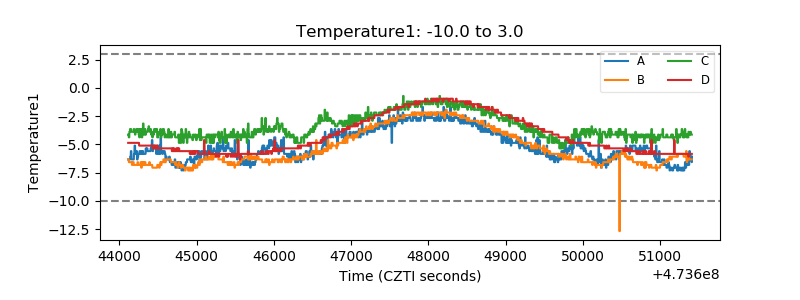 |
| Veto HV Monitor | 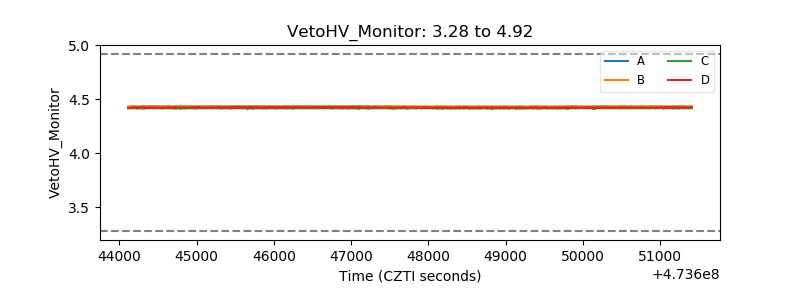 |
| Veto LLD | 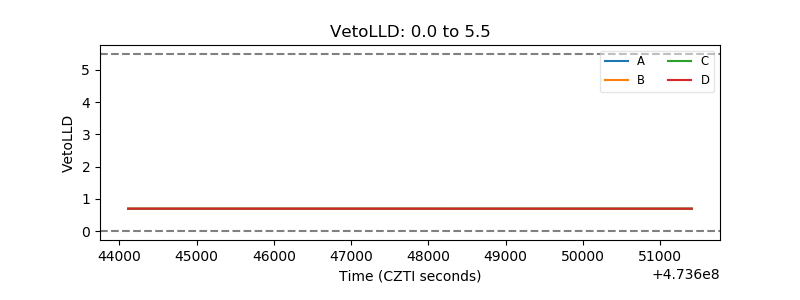 |
| Alpha Counter | 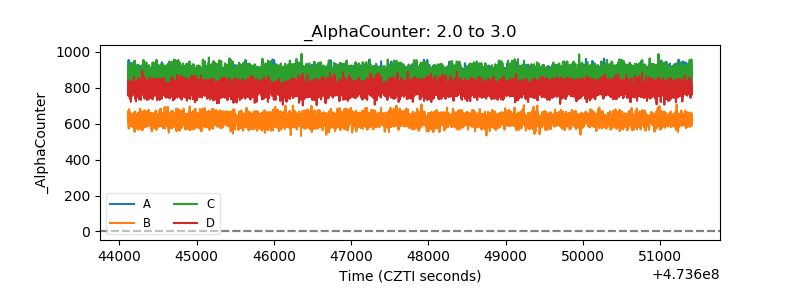 |
| _CPM_Rate | 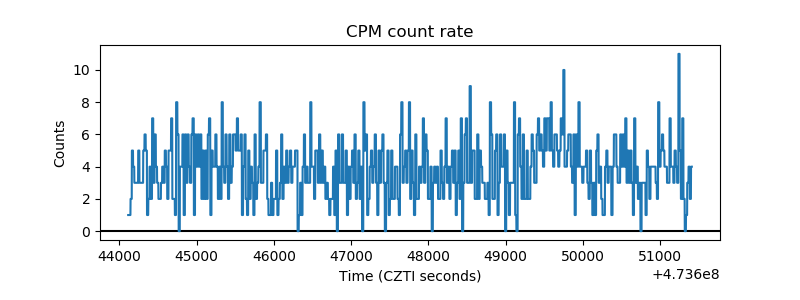 |
| CZT Counter | 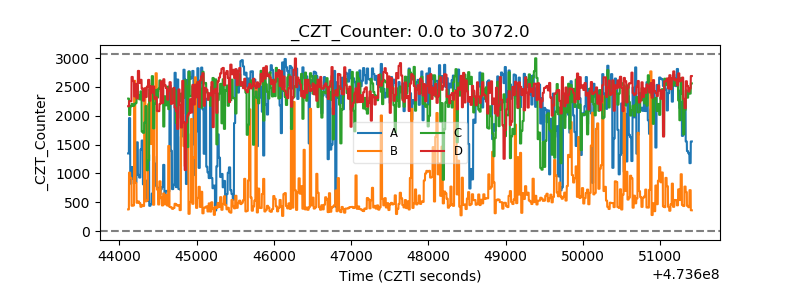 |
| +2.5 Volts monitor |  |
| +5 Volts monitor | 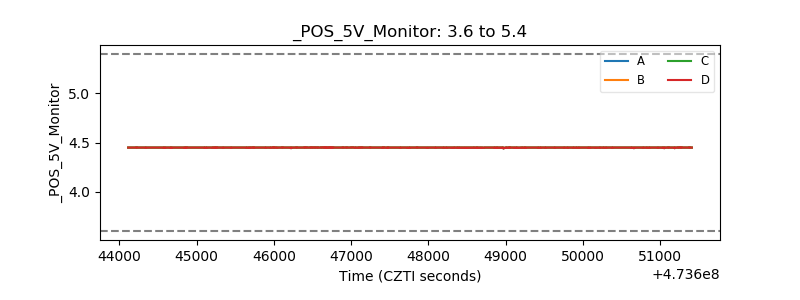 |
| _ROLL_ROT | 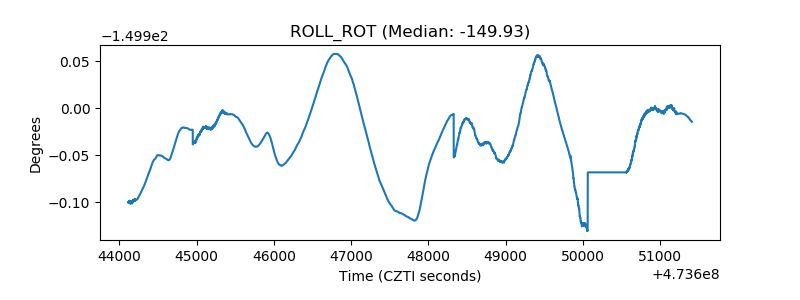 |
| _Roll_DEC | 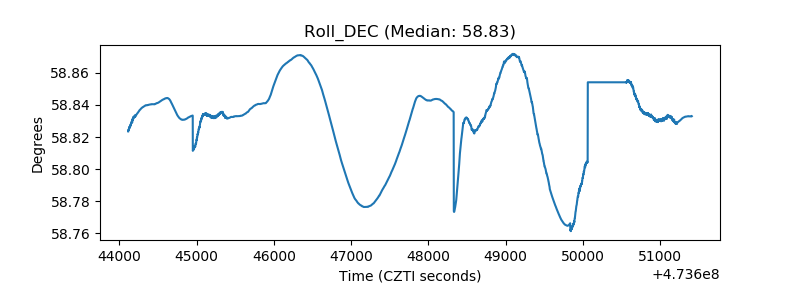 |
| _Roll_RA |  |
| Veto Counter | 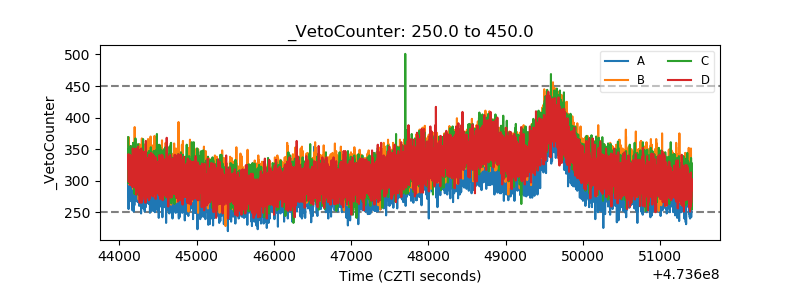 |