| Param | Original file | Final file |
|---|---|---|
| Filename | modeM0/AS1C09_003T01_9000006442_50165cztM0_level2.fits | modeM0/AS1C09_003T01_9000006442_50165cztM0_level2_quad_clean.evt |
| Size (bytes) | 1,606,046,400 | 56,404,800 |
| Size | 1.5 GB | 53.8 MB |
| Events in quadrant A | 17,600,062 | 224,140 |
| Events in quadrant B | 4,344,004 | 780,938 |
| Events in quadrant C | 16,899,138 | 139,854 |
| Events in quadrant D | 20,000,776 | 13,417 |
| Mode M0 | |||
|---|---|---|---|
| Quadrant | BADHDUFLAG | Total packets | Discarded packets |
| A | 0 | 57686 | 0 |
| B | 0 | 18328 | 0 |
| C | 0 | 55569 | 0 |
| D | 0 | 64843 | 0 |
| Mode SS | |||
|---|---|---|---|
| Quadrant | BADHDUFLAG | Total packets | Discarded packets |
| A | 0 | 158 | 0 |
| B | 0 | 158 | 0 |
| C | 0 | 158 | 0 |
| D | 0 | 158 | 0 |
| Quadrant | Total seconds | Saturated seconds | Saturation percentage |
|---|---|---|---|
| A | 7894 | 5934 | 75.171016% |
| B | 7894 | 81 | 1.026096% |
| C | 7894 | 6460 | 81.834305% |
| D | 7895 | 7772 | 98.442052% |
Noise dominated data is calculated using 1-second bins in cleaned event files. If a bin has >2000 counts, and if more than 50% of those come from <1% of pixels, then it is considered to be noise-dominated and hence unusable.
| Quadrant | # 1 sec bins | Bins with >0 counts | Bins with >2000 counts | High rate bins dominated by noise | Noise dominated (total time) | Noise dominated (detector-on time) | Marked lightcurve |
|---|---|---|---|---|---|---|---|
| A | 7894 | 7894 | 5891 | 5891 | 74.63% | 74.63% | 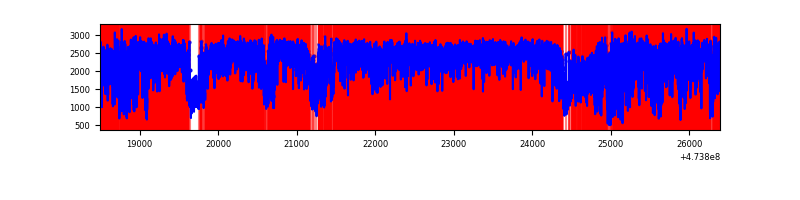 |
| B | 7894 | 7894 | 37 | 37 | 0.47% | 0.47% | 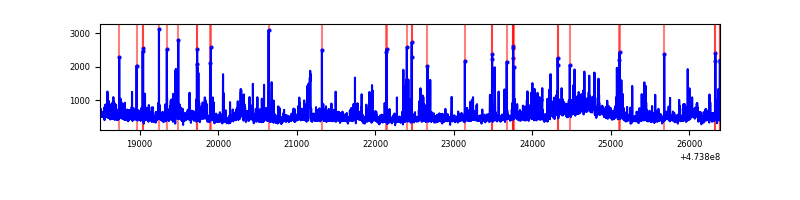 |
| C | 7893 | 7893 | 5519 | 5519 | 69.92% | 69.92% | 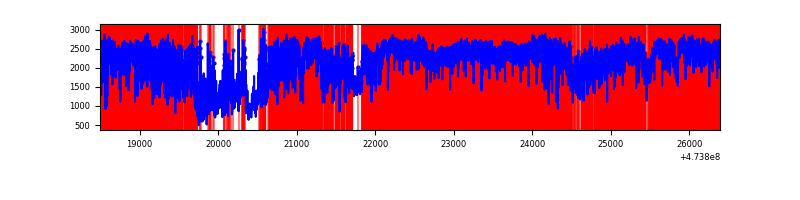 |
| D | 7894 | 7894 | 7477 | 7477 | 94.72% | 94.72% | 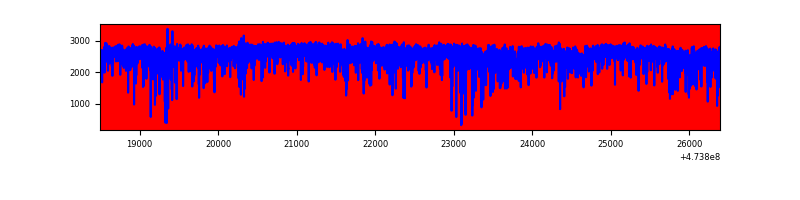 |
Top three noisy pixels from each quadrant. If the there are fewer than three noisy pixels in the level2.evt file, extra rows are filled as -1
| Pixel properties | Quadrant properties | ||||||
|---|---|---|---|---|---|---|---|
| Quadrant | DetID | PixID | Counts | Sigma | Mean | Median | Sigma |
| A | 0 | 98 | 10502179 | 68410.92 | 610 | 595 | 153.5 |
| A | 6 | 250 | 2101403 | 13685.38 | 610 | 595 | 153.5 |
| A | 8 | 8 | 867864 | 5649.69 | 610 | 595 | 153.5 |
| B | 9 | 218 | 296304 | 1708.53 | 811 | 783 | 173.0 |
| B | 4 | 170 | 166205 | 956.37 | 811 | 783 | 173.0 |
| B | 5 | 185 | 111457 | 639.85 | 811 | 783 | 173.0 |
| C | 15 | 197 | 4502689 | 42796.21 | 365 | 364 | 105.2 |
| C | 15 | 196 | 1311120 | 12459.2 | 365 | 364 | 105.2 |
| C | 4 | 210 | 1237023 | 11754.88 | 365 | 364 | 105.2 |
| D | 15 | 142 | 5497401 | 62028.71 | 270 | 258 | 88.6 |
| D | 15 | 168 | 4281369 | 48307.24 | 270 | 258 | 88.6 |
| D | 15 | 106 | 1421485 | 16036.85 | 270 | 258 | 88.6 |
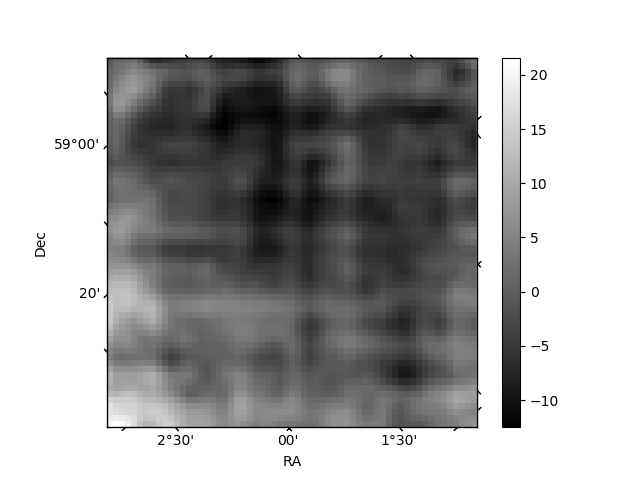
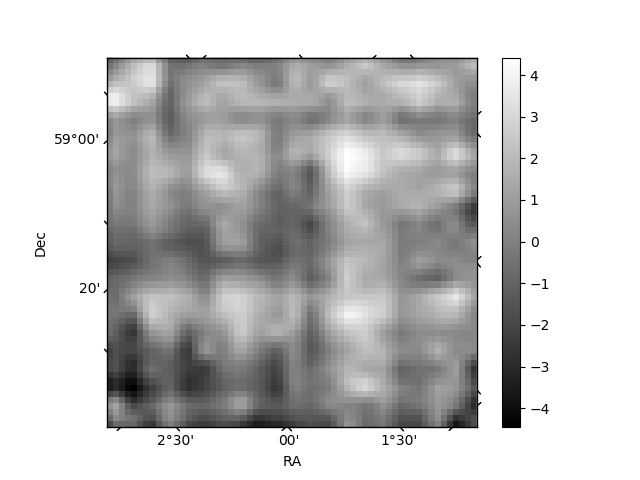
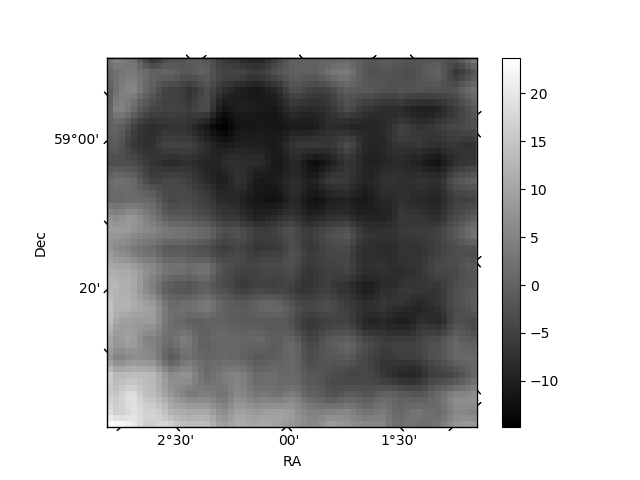
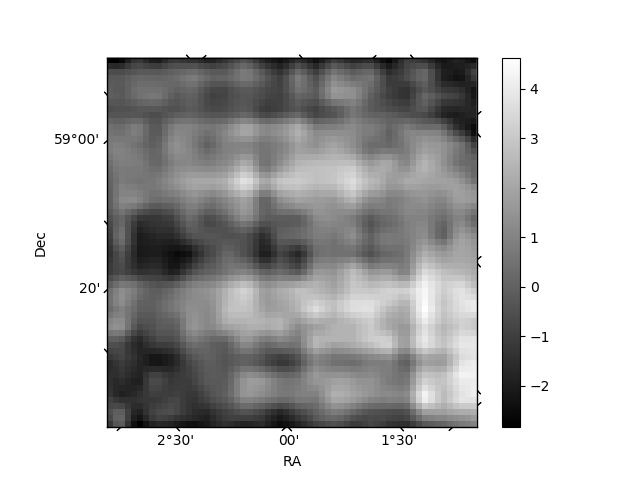
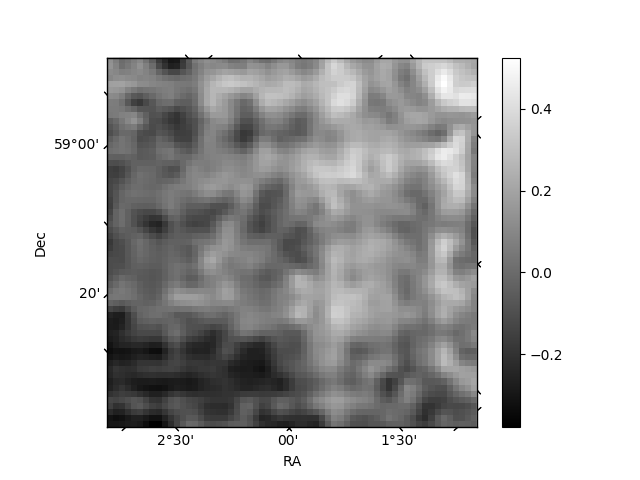
Histogram calculated using DETX and DETY for each event in the final _common_clean file
| Quadrant A | 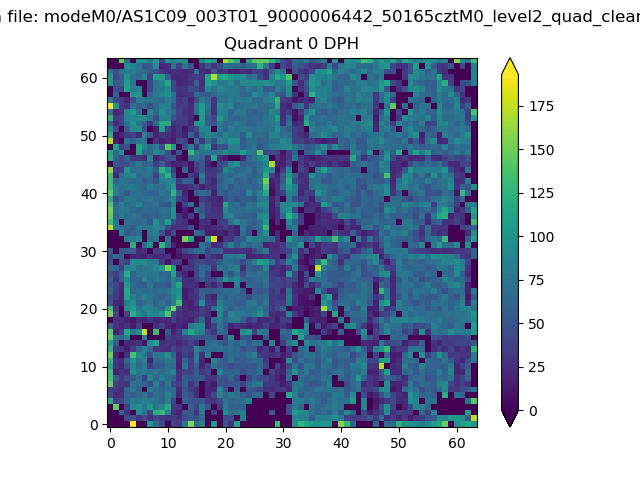 |
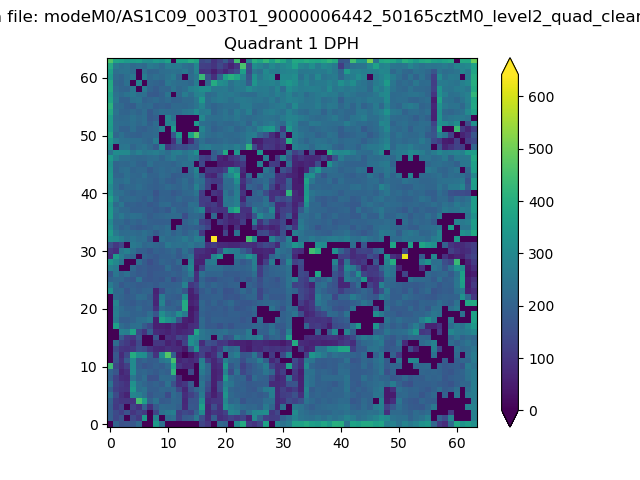 |
Quadrant B |
|---|---|---|---|
| Quadrant D | 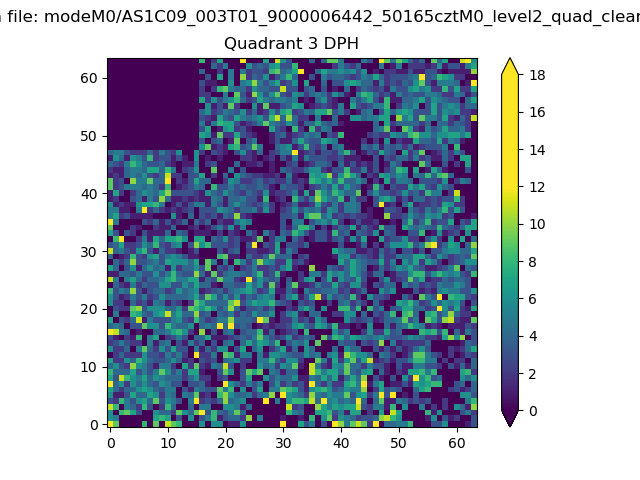 |
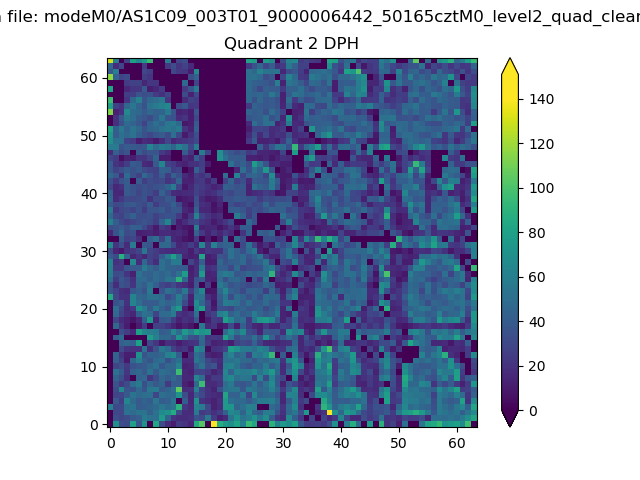 |
Quadrant C |
| Plot type | Count rate plots | Images |
|---|---|---|
| Comparison with Poisson distribution Blue bars denote a histogram of data divided into 1 sec bins. Red curve is a Poisson curve with rate = median count rate of data. |
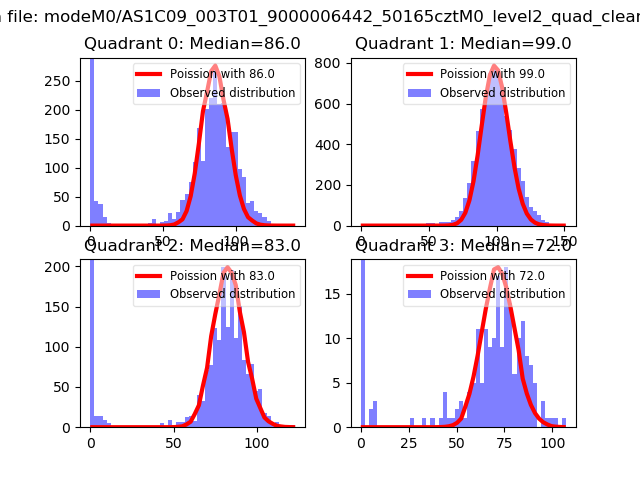 |
 |
| Quadrant-wise count rates Data is divided into 100 sec bins |
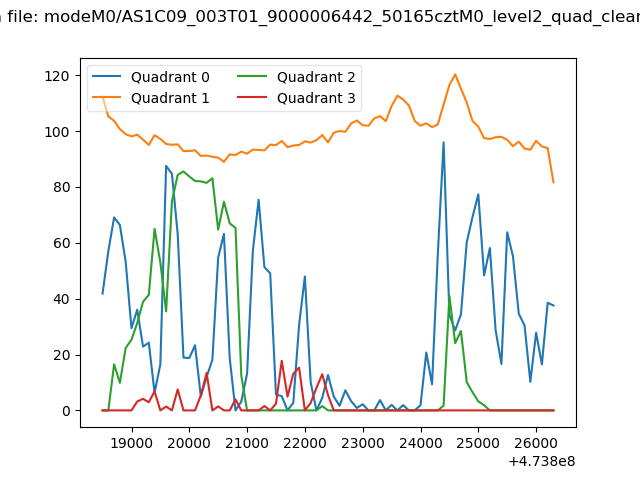 |
|
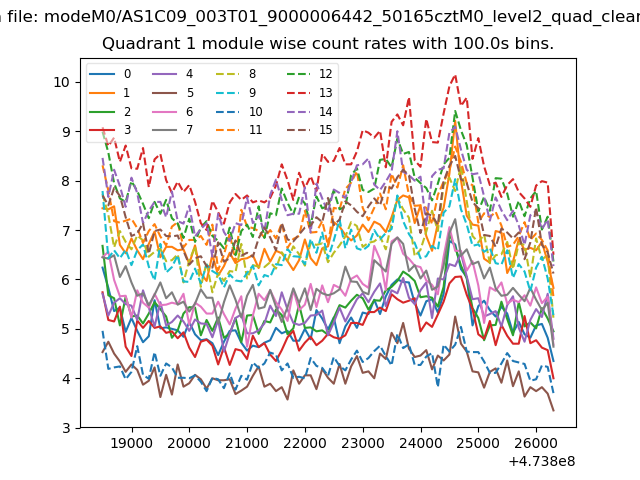
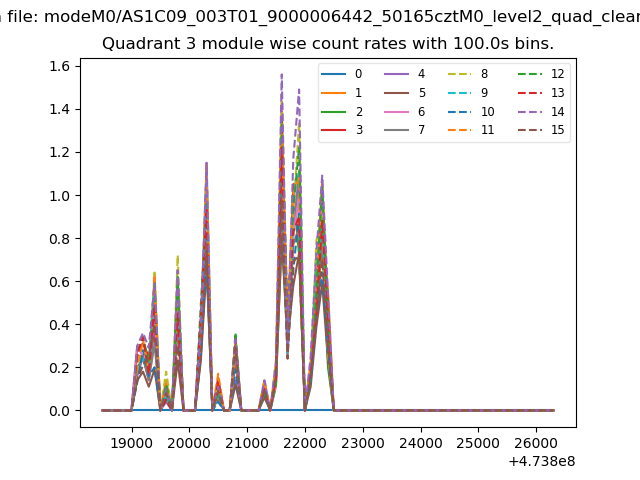
| Module-wise count rates for Quadrant A Data is divided into 100 sec bins |
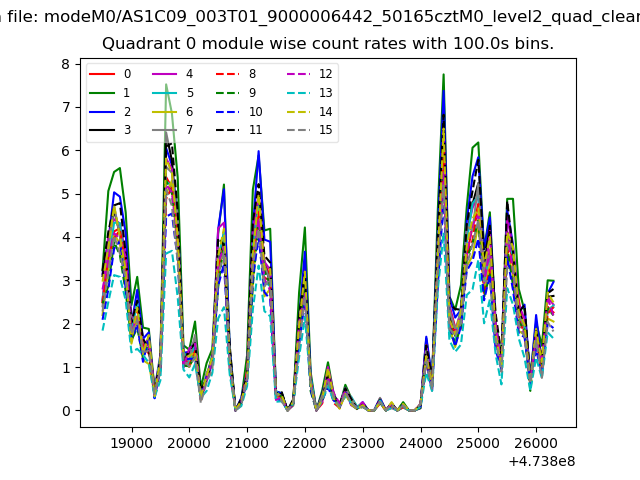 |
 |
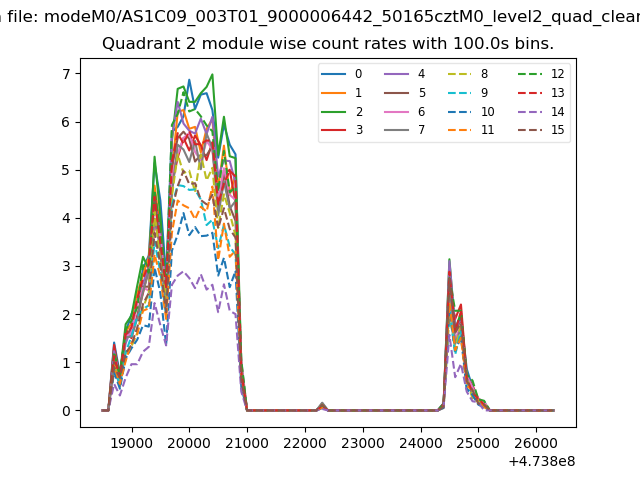
| Module-wise count rates for Quadrant B Data is divided into 100 sec bins |
 |
 |
| Module-wise count rates for Quadrant C Data is divided into 100 sec bins |
 |
 |
| Module-wise count rates for Quadrant D Data is divided into 100 sec bins |
 |
 |
| Parameter | Plot |
|---|---|
| CZT HV Monitor | 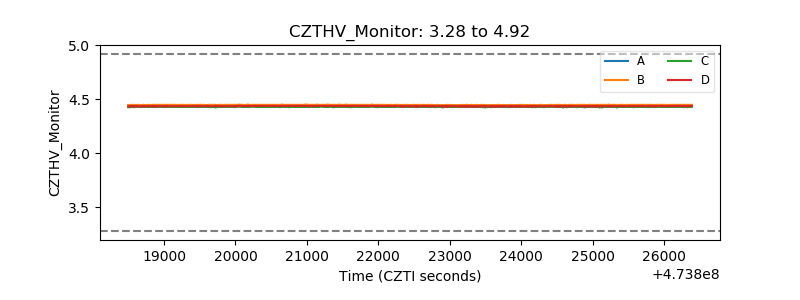 |
| D_VDD | 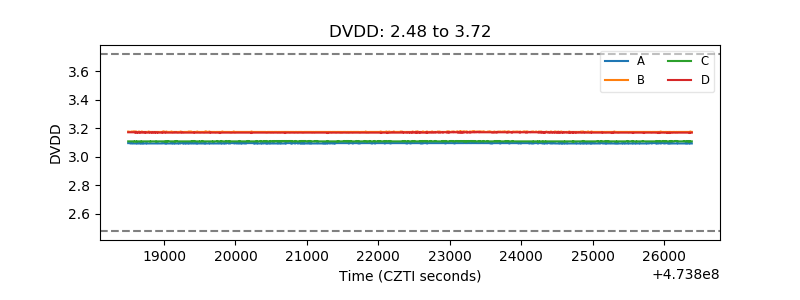 |
| Temperature 1 | 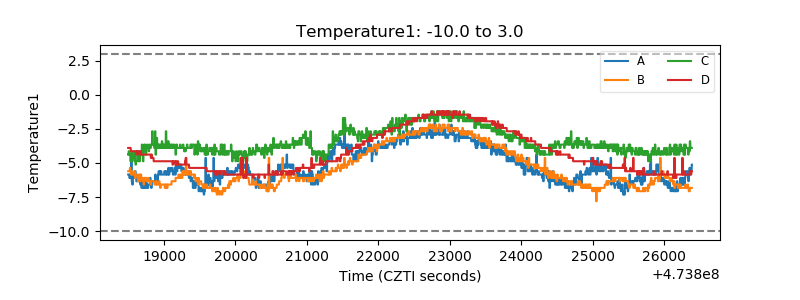 |
| Veto HV Monitor | 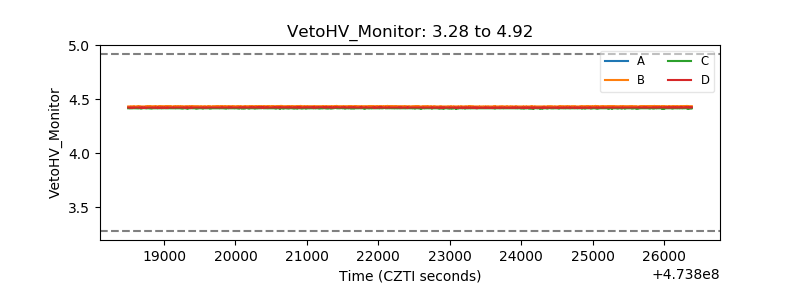 |
| Veto LLD |  |
| Alpha Counter | 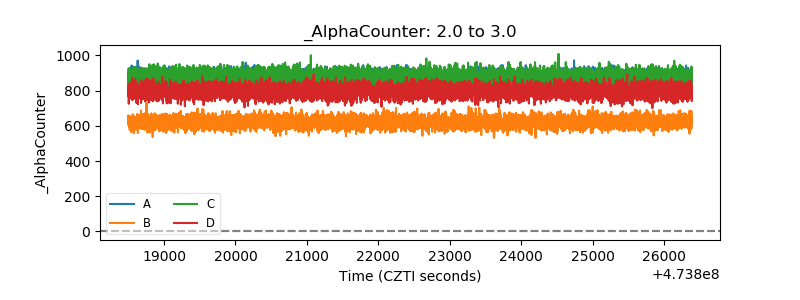 |
| _CPM_Rate | 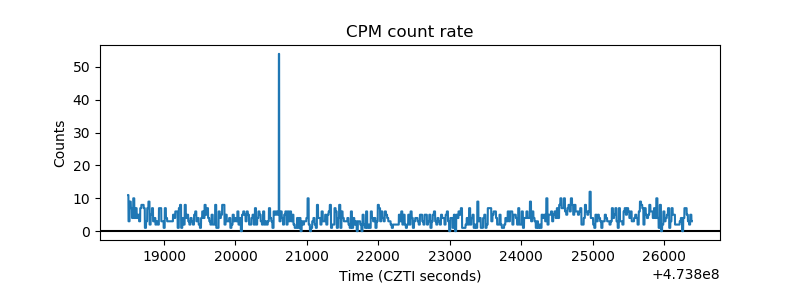 |
| CZT Counter |  |
| +2.5 Volts monitor | 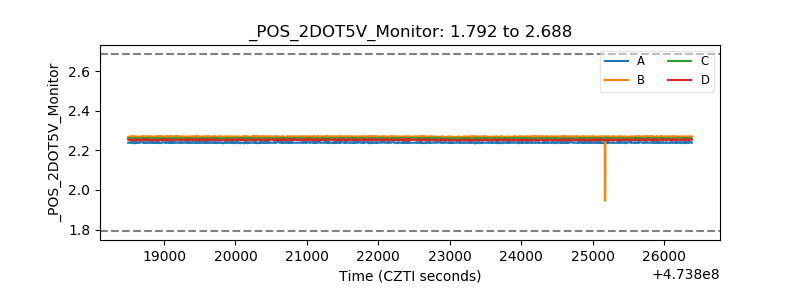 |
| +5 Volts monitor | 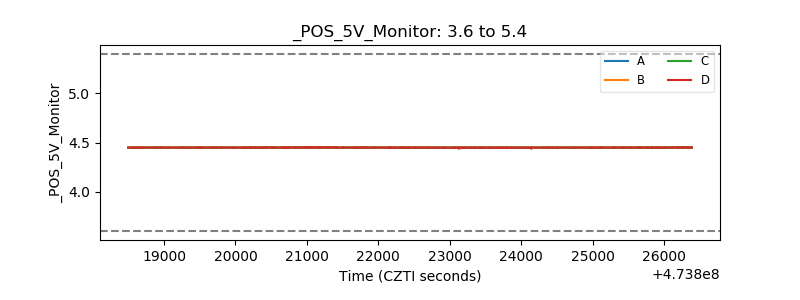 |
| _ROLL_ROT | 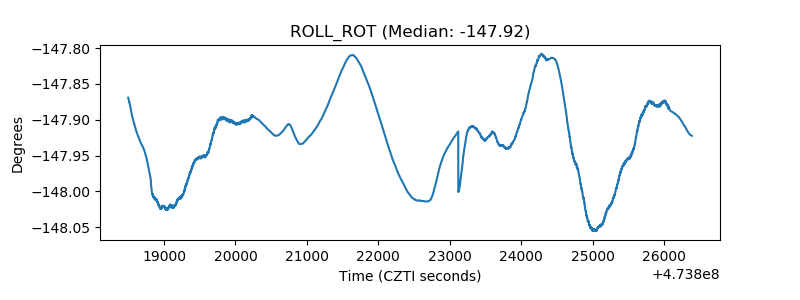 |
| _Roll_DEC | 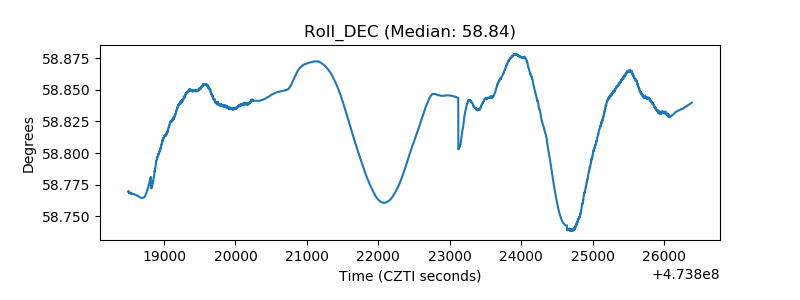 |
| _Roll_RA | 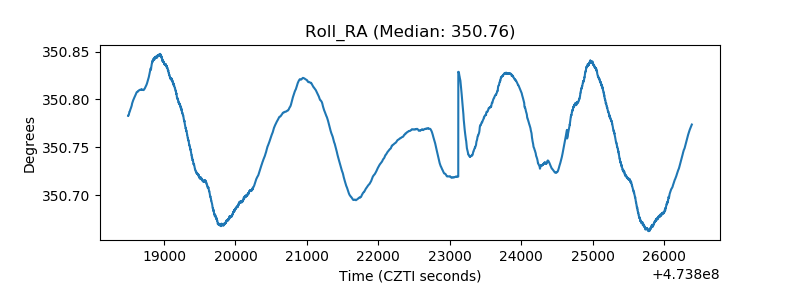 |
| Veto Counter | 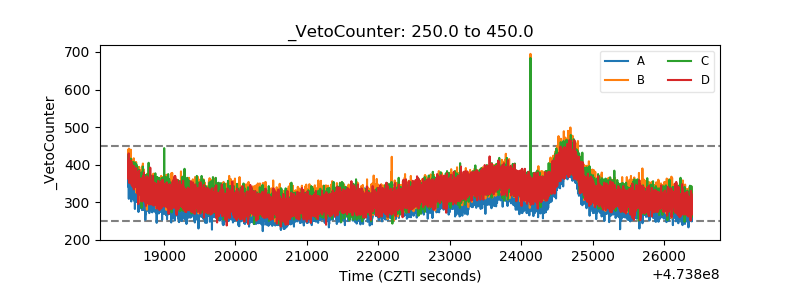 |