| Param | Original file | Final file |
|---|---|---|
| Filename | modeM0/AS1C09_003T01_9000006442_50237cztM0_level2.fits | modeM0/AS1C09_003T01_9000006442_50237cztM0_level2_quad_clean.evt |
| Size (bytes) | 34,554,240 | 1,474,560 |
| Size | 33.0 MB | 1.4 MB |
| Events in quadrant A | 277,513 | 8,890 |
| Events in quadrant B | 92,516 | 13,509 |
| Events in quadrant C | 436,413 | 143 |
| Events in quadrant D | 454,526 | 885 |
| Mode M0 | |||
|---|---|---|---|
| Quadrant | BADHDUFLAG | Total packets | Discarded packets |
| A | 0 | 942 | 0 |
| B | 0 | 391 | 0 |
| C | 0 | 1418 | 0 |
| D | 0 | 1477 | 0 |
| Mode SS | |||
|---|---|---|---|
| Quadrant | BADHDUFLAG | Total packets | Discarded packets |
| A | 0 | 4 | 0 |
| B | 0 | 4 | 0 |
| C | 0 | 4 | 0 |
| D | 0 | 4 | 0 |
| Quadrant | Total seconds | Saturated seconds | Saturation percentage |
|---|---|---|---|
| A | 184 | 75 | 40.760870% |
| B | 185 | 0 | 0.000000% |
| C | 185 | 184 | 99.459459% |
| D | 185 | 185 | 100.000000% |
Noise dominated data is calculated using 1-second bins in cleaned event files. If a bin has >2000 counts, and if more than 50% of those come from <1% of pixels, then it is considered to be noise-dominated and hence unusable.
| Quadrant | # 1 sec bins | Bins with >0 counts | Bins with >2000 counts | High rate bins dominated by noise | Noise dominated (total time) | Noise dominated (detector-on time) | Marked lightcurve |
|---|---|---|---|---|---|---|---|
| A | 184 | 184 | 67 | 67 | 36.41% | 36.41% | 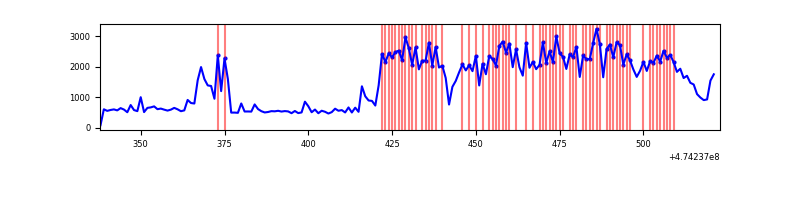 |
| B | 185 | 185 | 0 | 0 | 0.00% | 0.00% | 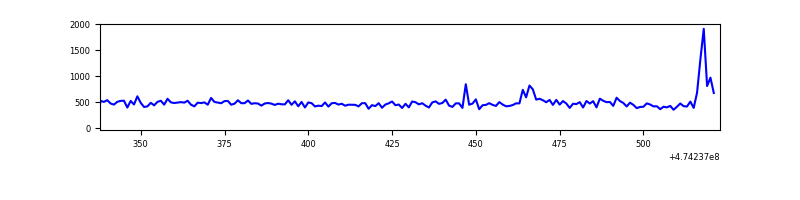 |
| C | 185 | 185 | 147 | 147 | 79.46% | 79.46% | 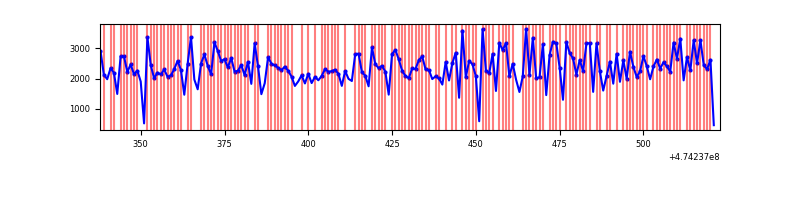 |
| D | 185 | 185 | 166 | 166 | 89.73% | 89.73% | 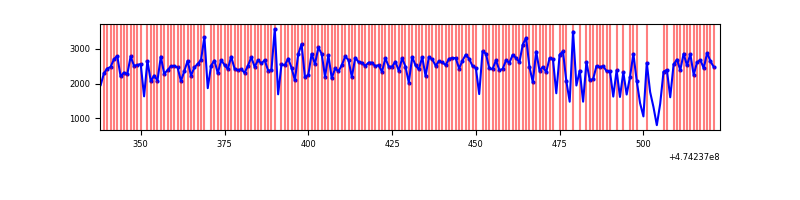 |
Top three noisy pixels from each quadrant. If the there are fewer than three noisy pixels in the level2.evt file, extra rows are filled as -1
| Pixel properties | Quadrant properties | ||||||
|---|---|---|---|---|---|---|---|
| Quadrant | DetID | PixID | Counts | Sigma | Mean | Median | Sigma |
| A | 8 | 249 | 94009 | 14947.28 | 18 | 17 | 6.3 |
| A | 0 | 98 | 91692 | 14578.81 | 18 | 17 | 6.3 |
| A | 4 | 3 | 5290 | 838.55 | 18 | 17 | 6.3 |
| B | 0 | 245 | 4187 | 659.06 | 21 | 20 | 6.3 |
| B | 5 | 185 | 2194 | 343.84 | 21 | 20 | 6.3 |
| B | 9 | 253 | 701 | 107.71 | 21 | 20 | 6.3 |
| C | 4 | 111 | 243829 | 109649.69 | 4 | 4 | 2.2 |
| C | 0 | 177 | 72879 | 32772.36 | 4 | 4 | 2.2 |
| C | 15 | 197 | 46427 | 20876.72 | 4 | 4 | 2.2 |
| D | 7 | 61 | 278189 | 93569.45 | 6 | 6 | 3.0 |
| D | 2 | 249 | 61006 | 20517.92 | 6 | 6 | 3.0 |
| D | 15 | 108 | 26273 | 8835.15 | 6 | 6 | 3.0 |
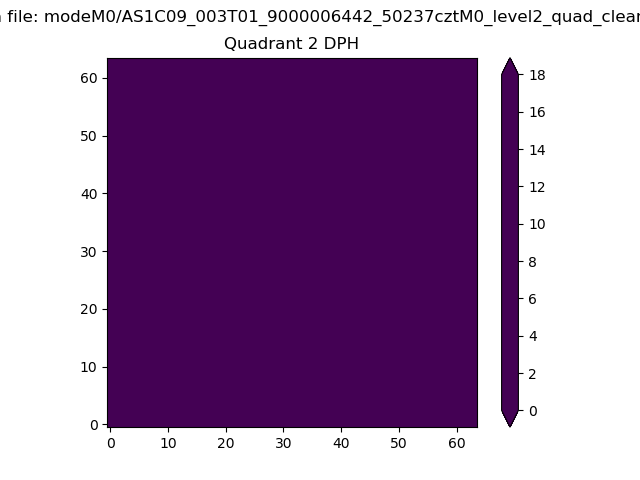
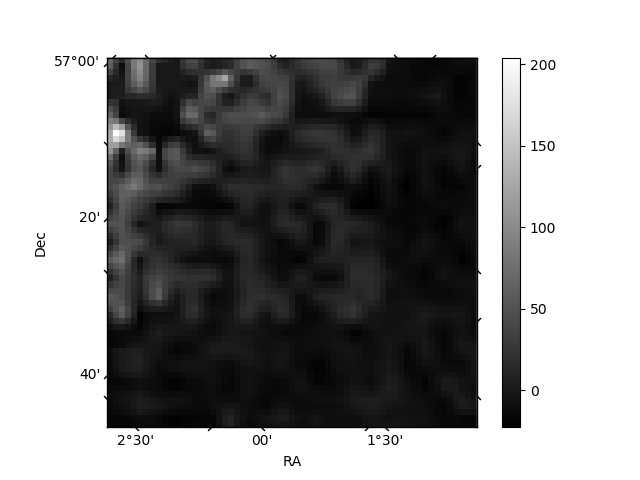
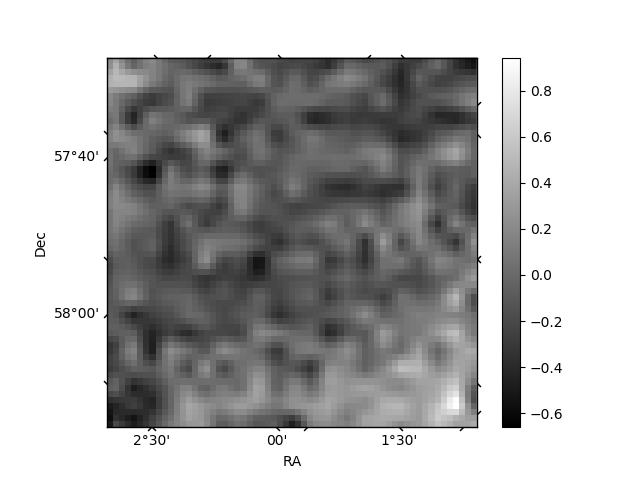
Histogram calculated using DETX and DETY for each event in the final _common_clean file
| Quadrant A |  |
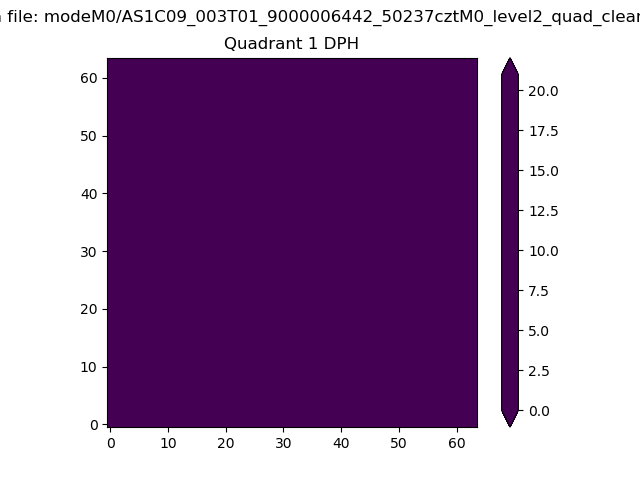 |
Quadrant B |
|---|---|---|---|
| Quadrant D | 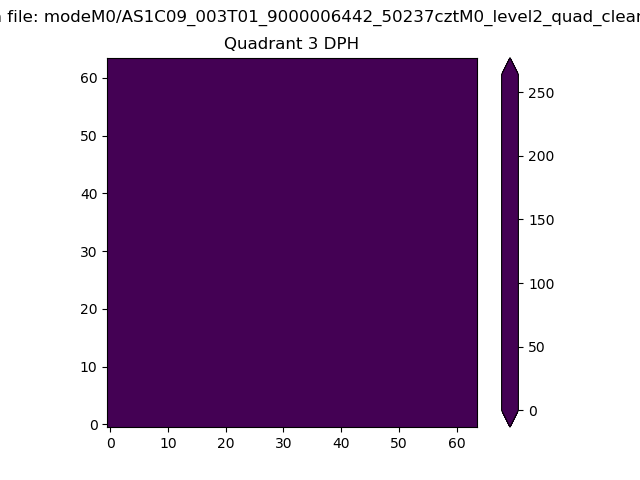 |
 |
Quadrant C |
| Plot type | Count rate plots | Images |
|---|---|---|
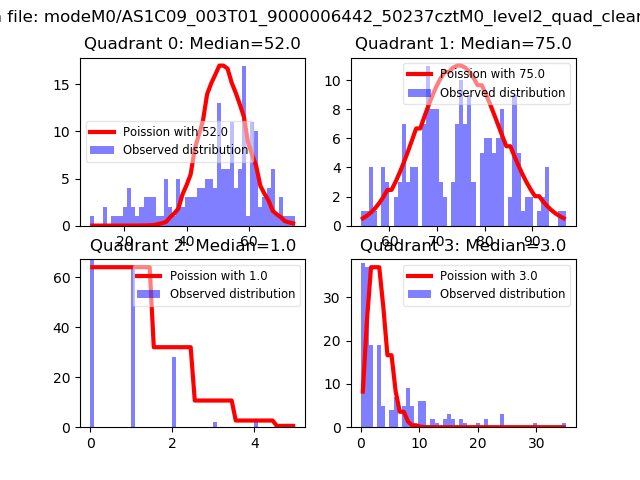
| Comparison with Poisson distribution Blue bars denote a histogram of data divided into 1 sec bins. Red curve is a Poisson curve with rate = median count rate of data. |
 |
 |
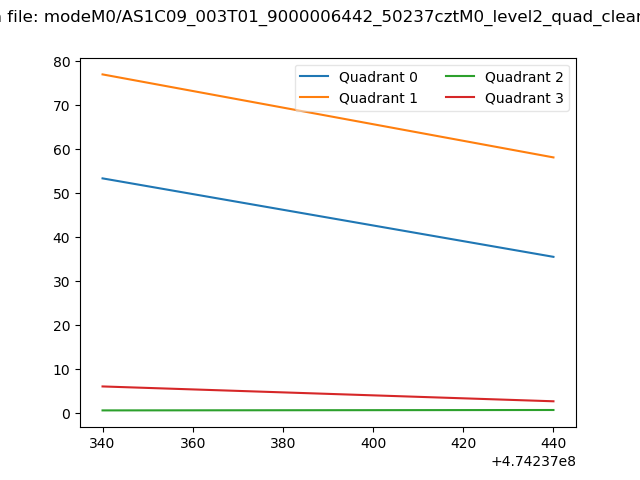
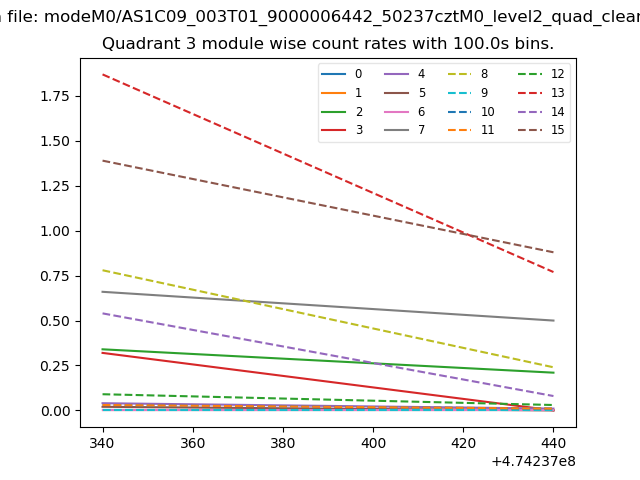
| Quadrant-wise count rates Data is divided into 100 sec bins |
 |
|
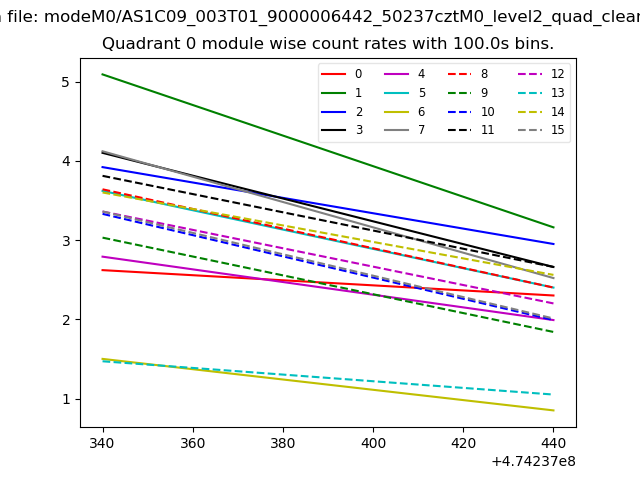
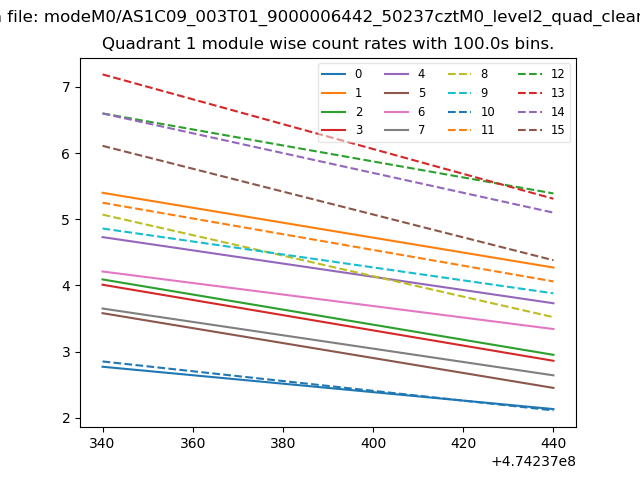
| Module-wise count rates for Quadrant A Data is divided into 100 sec bins |
 |
 |
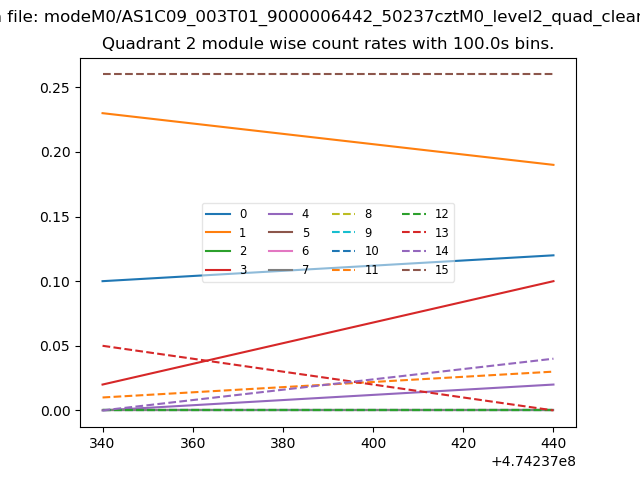
| Module-wise count rates for Quadrant B Data is divided into 100 sec bins |
 |
 |
| Module-wise count rates for Quadrant C Data is divided into 100 sec bins |
 |
 |
| Module-wise count rates for Quadrant D Data is divided into 100 sec bins |
 |
 |
| Parameter | Plot |
|---|---|
| CZT HV Monitor | 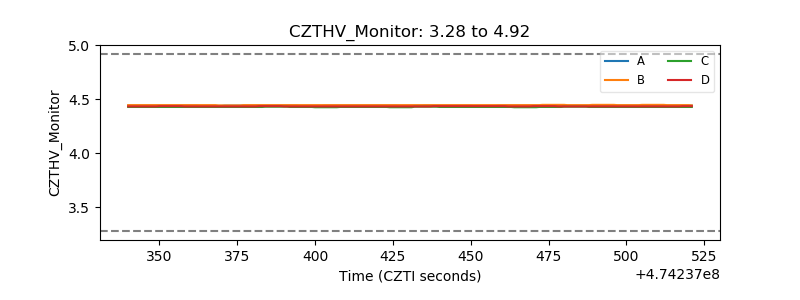 |
| D_VDD | 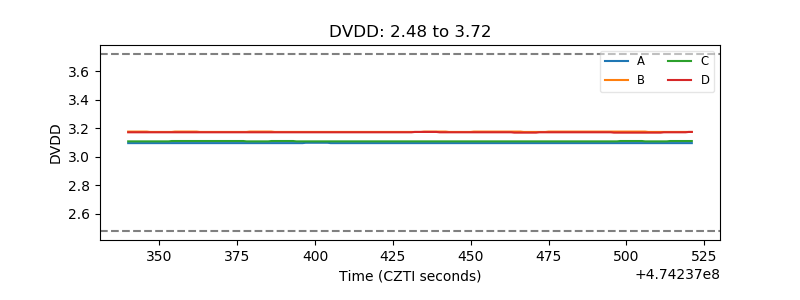 |
| Temperature 1 | 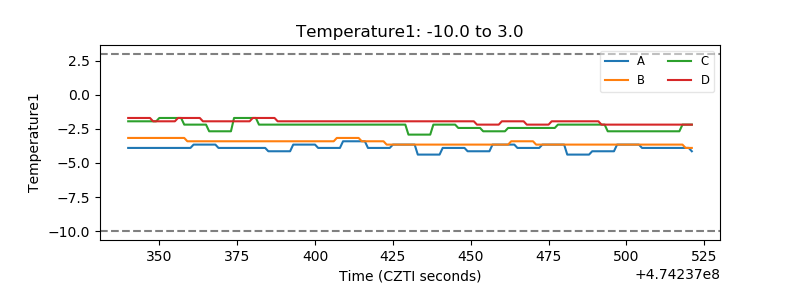 |
| Veto HV Monitor | 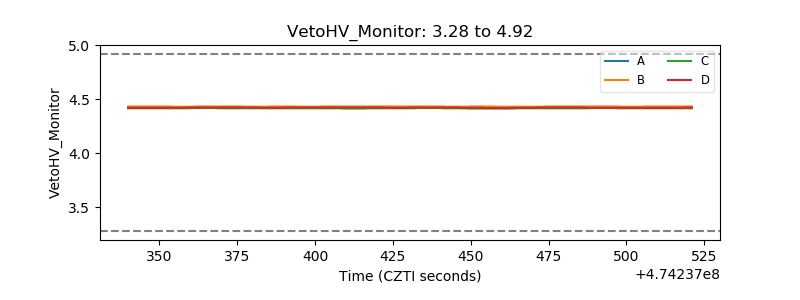 |
| Veto LLD | 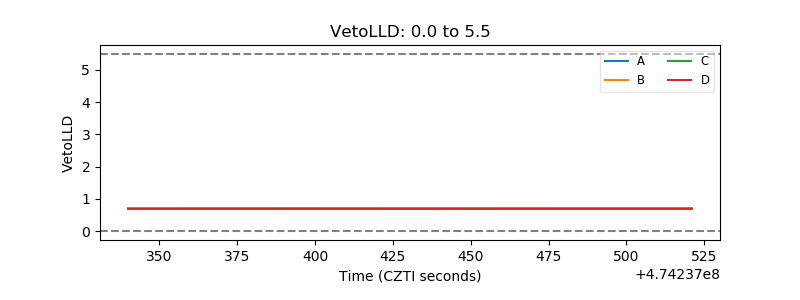 |
| Alpha Counter | 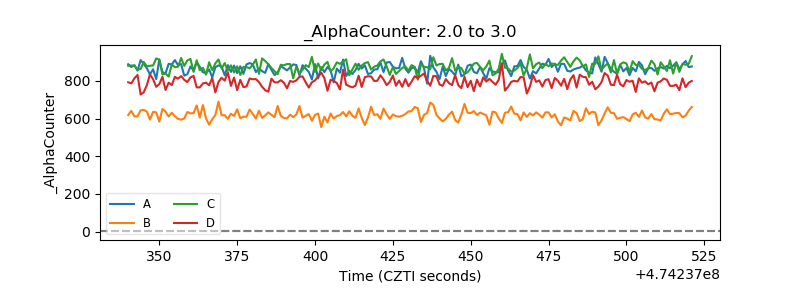 |
| _CPM_Rate | 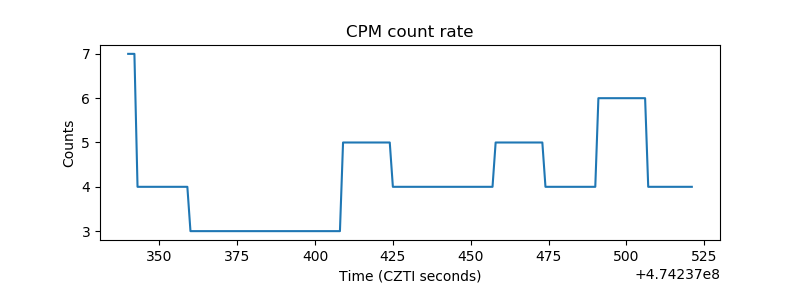 |
| CZT Counter | 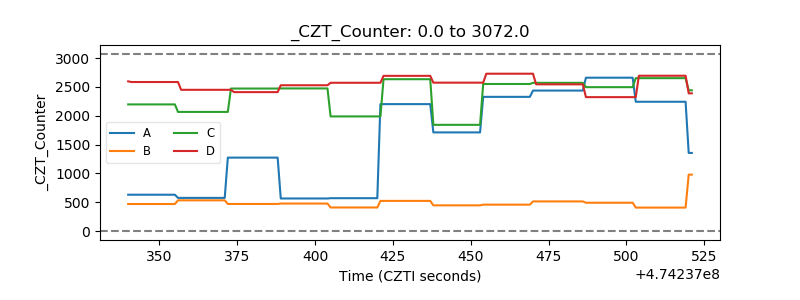 |
| +2.5 Volts monitor |  |
| +5 Volts monitor | 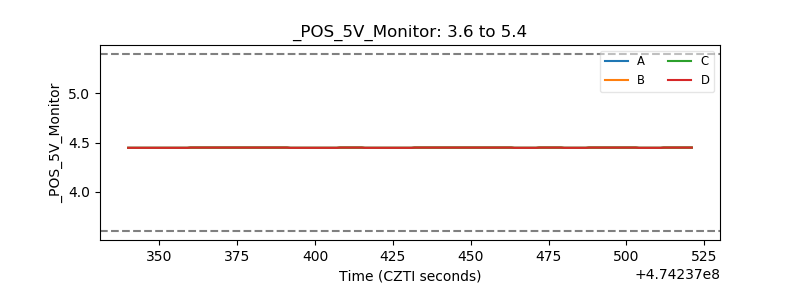 |
| _ROLL_ROT | 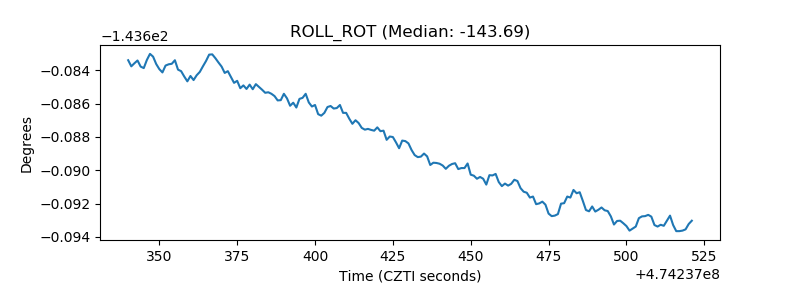 |
| _Roll_DEC | 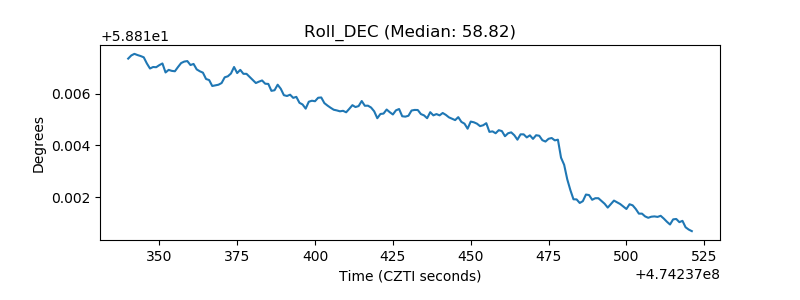 |
| _Roll_RA | 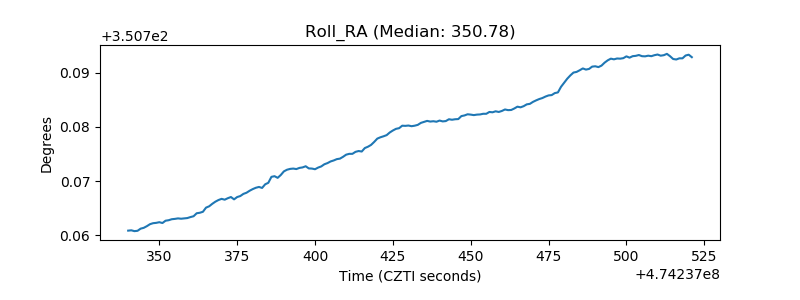 |
| Veto Counter | 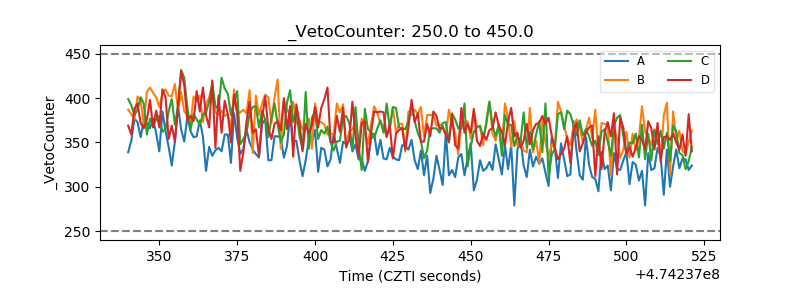 |