| Param | Original file | Final file |
|---|---|---|
| Filename | modeM0/AS1C09_003T01_9000006442_50323cztM0_level2.fits | modeM0/AS1C09_003T01_9000006442_50323cztM0_level2_quad_clean.evt |
| Size (bytes) | 1,272,156,480 | 58,345,920 |
| Size | 1.2 GB | 55.6 MB |
| Events in quadrant A | 11,387,446 | 453,185 |
| Events in quadrant B | 3,838,959 | 717,367 |
| Events in quadrant C | 15,021,062 | 31,169 |
| Events in quadrant D | 16,298,058 | 71,925 |
| Mode M0 | |||
|---|---|---|---|
| Quadrant | BADHDUFLAG | Total packets | Discarded packets |
| A | 0 | 38799 | 0 |
| B | 0 | 16324 | 0 |
| C | 0 | 49463 | 4 |
| D | 0 | 53293 | 0 |
| Mode SS | |||
|---|---|---|---|
| Quadrant | BADHDUFLAG | Total packets | Discarded packets |
| A | 0 | 142 | 0 |
| B | 0 | 142 | 0 |
| C | 0 | 142 | 0 |
| D | 0 | 142 | 0 |
| Quadrant | Total seconds | Saturated seconds | Saturation percentage |
|---|---|---|---|
| A | 7070 | 2525 | 35.714286% |
| B | 7070 | 95 | 1.343706% |
| C | 7069 | 6778 | 95.883435% |
| D | 7069 | 6310 | 89.262979% |
Noise dominated data is calculated using 1-second bins in cleaned event files. If a bin has >2000 counts, and if more than 50% of those come from <1% of pixels, then it is considered to be noise-dominated and hence unusable.
| Quadrant | # 1 sec bins | Bins with >0 counts | Bins with >2000 counts | High rate bins dominated by noise | Noise dominated (total time) | Noise dominated (detector-on time) | Marked lightcurve |
|---|---|---|---|---|---|---|---|
| A | 7070 | 7070 | 2310 | 2310 | 32.67% | 32.67% | 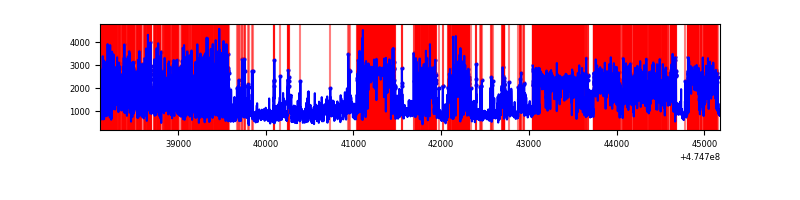 |
| B | 7070 | 7070 | 29 | 29 | 0.41% | 0.41% | 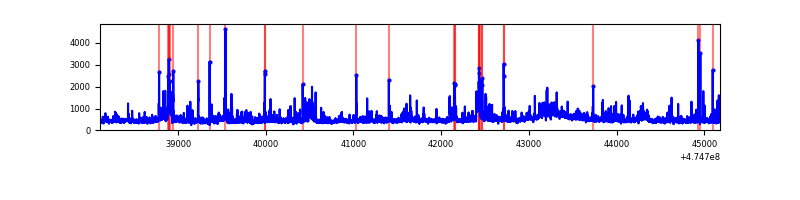 |
| C | 7068 | 7068 | 4682 | 4682 | 66.24% | 66.24% | 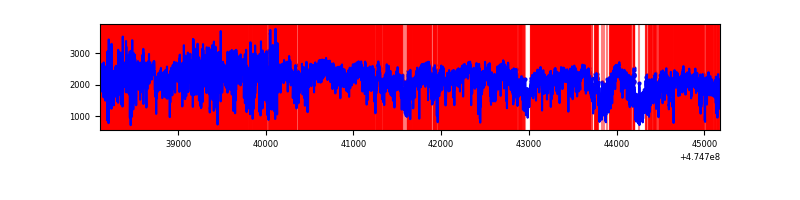 |
| D | 7068 | 7068 | 5778 | 5778 | 81.75% | 81.75% | 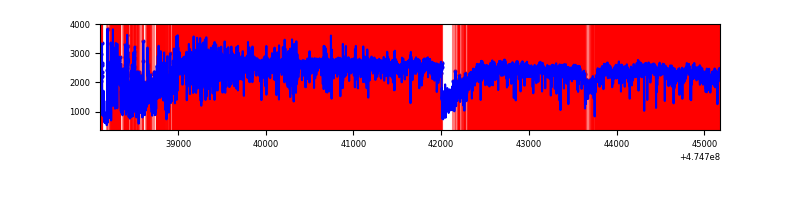 |
Top three noisy pixels from each quadrant. If the there are fewer than three noisy pixels in the level2.evt file, extra rows are filled as -1
| Pixel properties | Quadrant properties | ||||||
|---|---|---|---|---|---|---|---|
| Quadrant | DetID | PixID | Counts | Sigma | Mean | Median | Sigma |
| A | 0 | 98 | 3648573 | 22772.65 | 642 | 625 | 160.2 |
| A | 6 | 250 | 2012907 | 12561.86 | 642 | 625 | 160.2 |
| A | 3 | 14 | 1407519 | 8782.67 | 642 | 625 | 160.2 |
| B | 10 | 254 | 147282 | 918.27 | 752 | 726 | 159.6 |
| B | 12 | 0 | 118137 | 735.66 | 752 | 726 | 159.6 |
| B | 0 | 198 | 67528 | 418.56 | 752 | 726 | 159.6 |
| C | 15 | 197 | 9025611 | 203983.8 | 148 | 146 | 44.2 |
| C | 4 | 111 | 4362671 | 98597.07 | 148 | 146 | 44.2 |
| C | 15 | 127 | 303193 | 6849.14 | 148 | 146 | 44.2 |
| D | 7 | 61 | 10724867 | 126515.32 | 273 | 262 | 84.8 |
| D | 2 | 37 | 1116206 | 13164.49 | 273 | 262 | 84.8 |
| D | 12 | 6 | 718098 | 8468.12 | 273 | 262 | 84.8 |
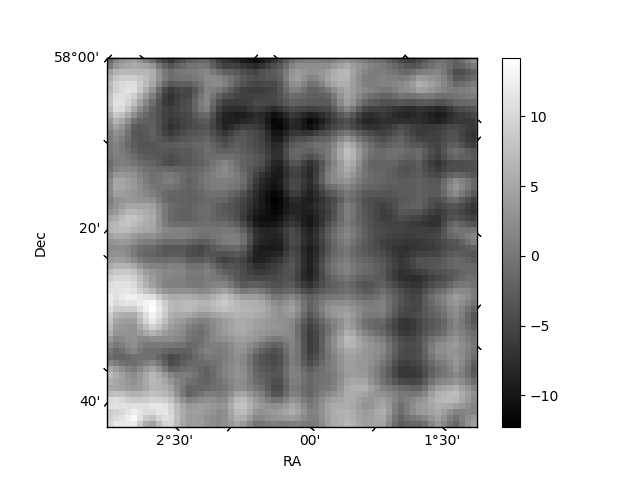
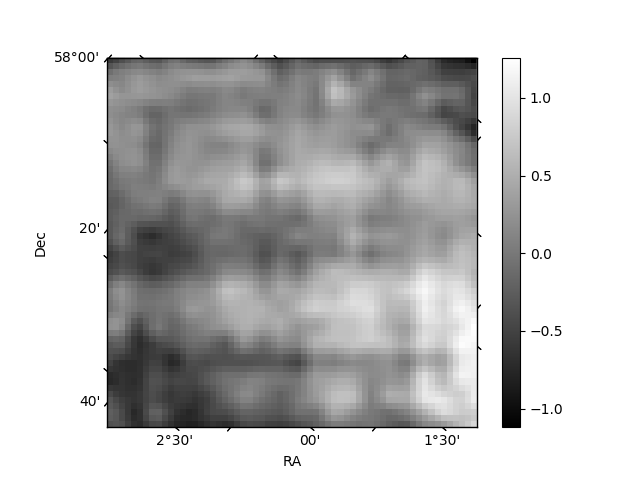
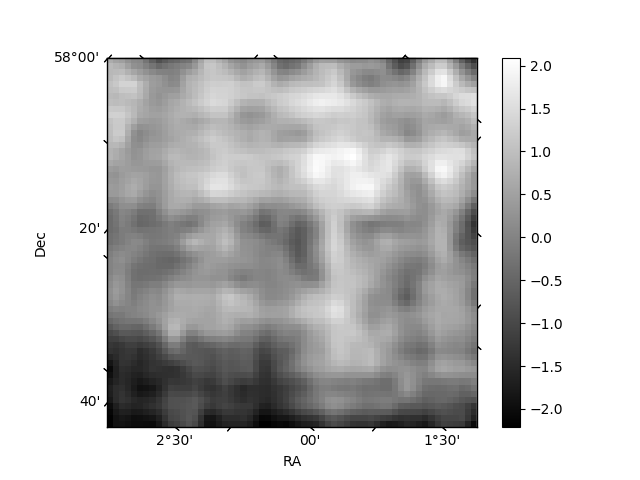
Histogram calculated using DETX and DETY for each event in the final _common_clean file
| Quadrant A | 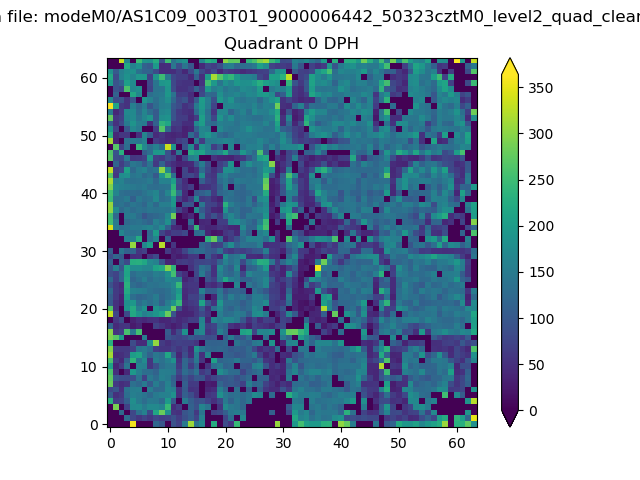 |
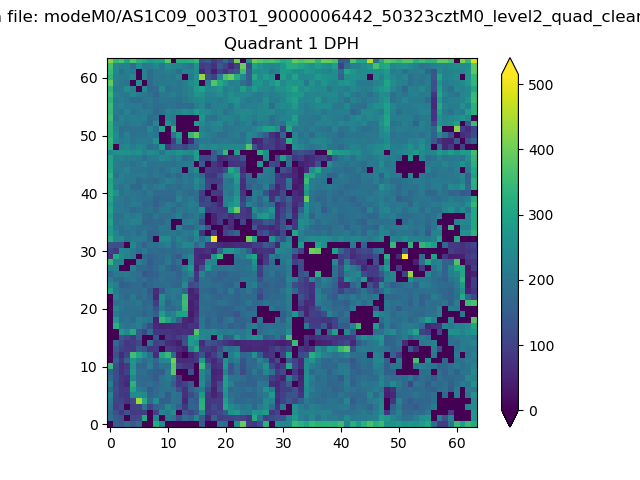 |
Quadrant B |
|---|---|---|---|
| Quadrant D | 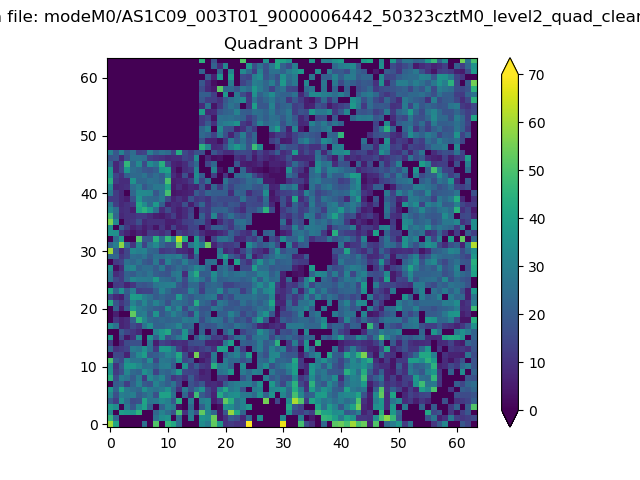 |
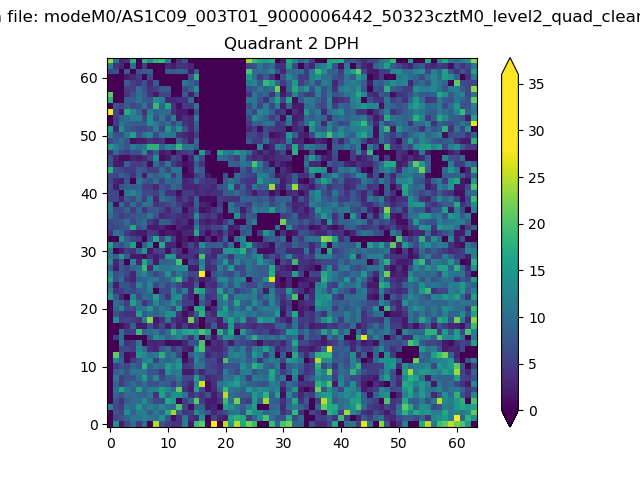 |
Quadrant C |
| Plot type | Count rate plots | Images |
|---|---|---|
| Comparison with Poisson distribution Blue bars denote a histogram of data divided into 1 sec bins. Red curve is a Poisson curve with rate = median count rate of data. |
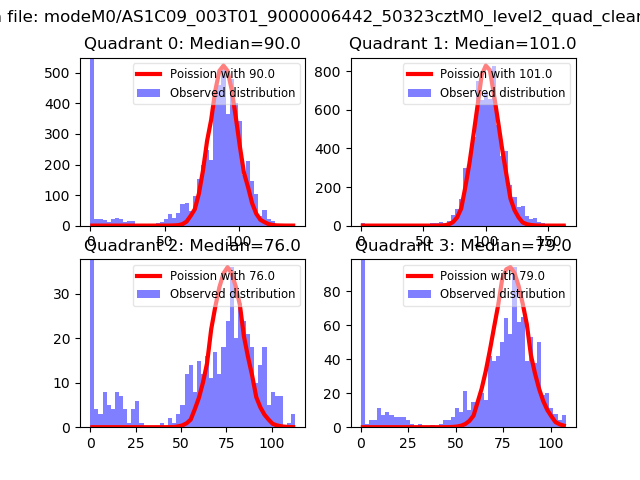 |
 |
| Quadrant-wise count rates Data is divided into 100 sec bins |
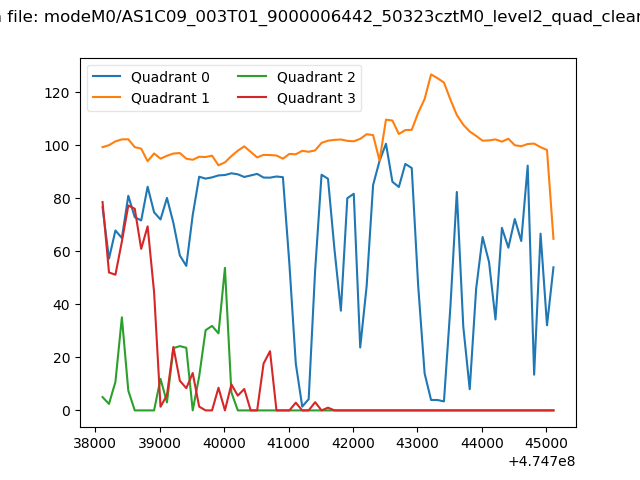 |
|
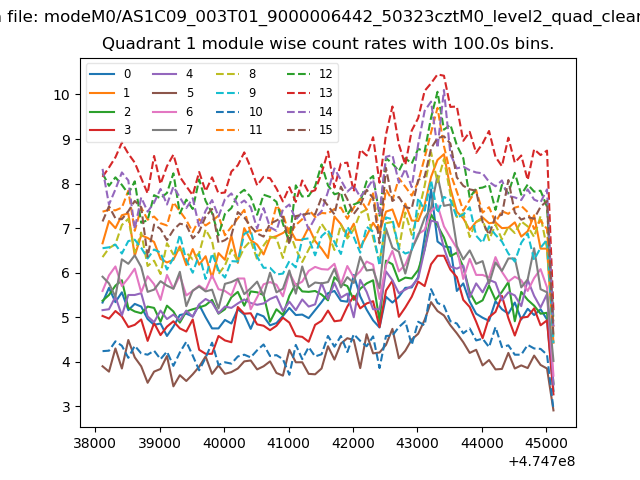
| Module-wise count rates for Quadrant A Data is divided into 100 sec bins |
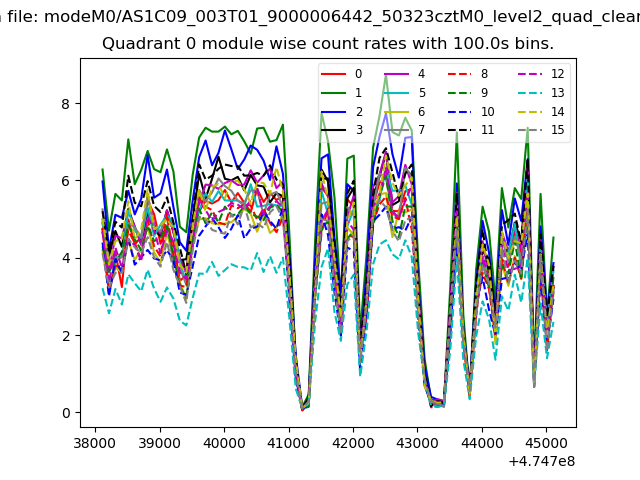 |
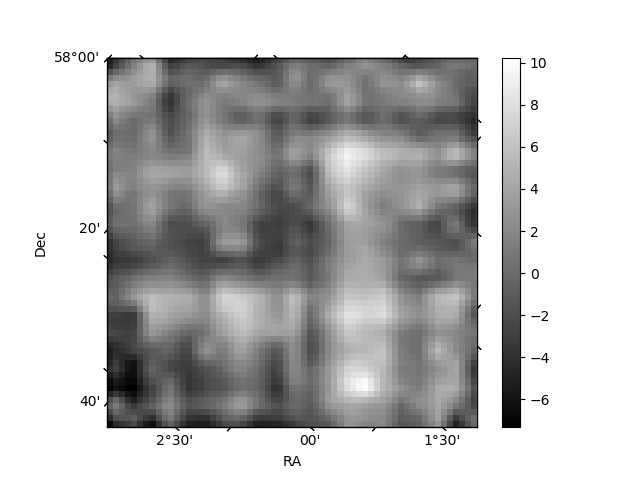 |
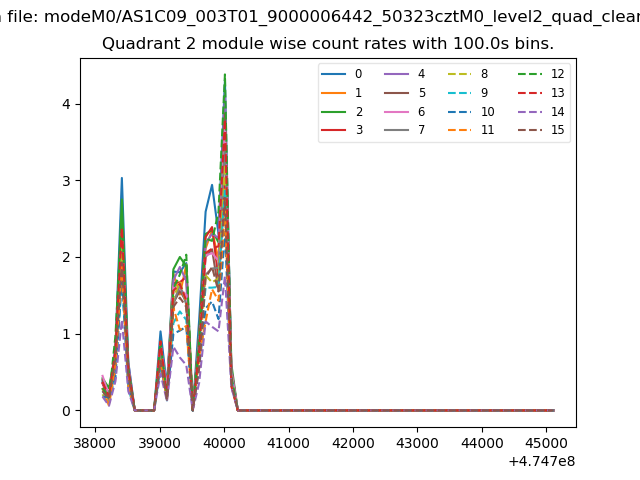
| Module-wise count rates for Quadrant B Data is divided into 100 sec bins |
 |
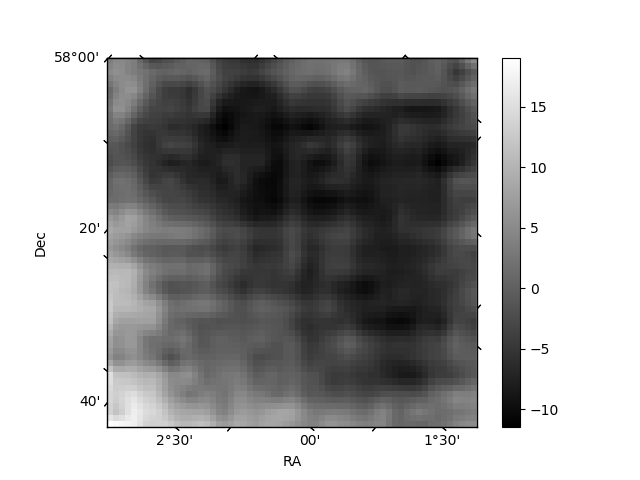 |
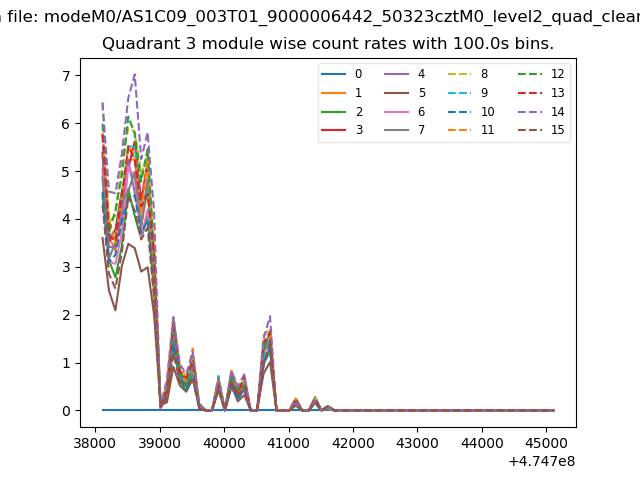
| Module-wise count rates for Quadrant C Data is divided into 100 sec bins |
 |
 |
| Module-wise count rates for Quadrant D Data is divided into 100 sec bins |
 |
 |
| Parameter | Plot |
|---|---|
| CZT HV Monitor | 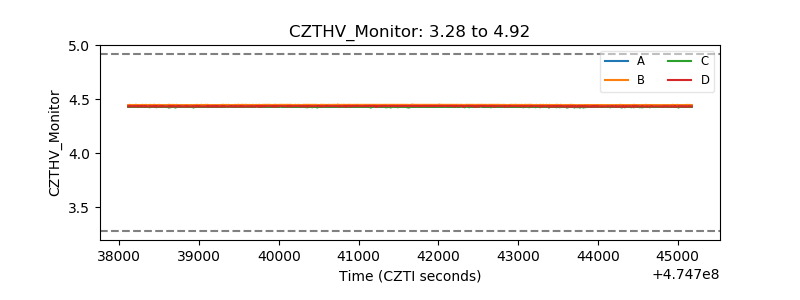 |
| D_VDD | 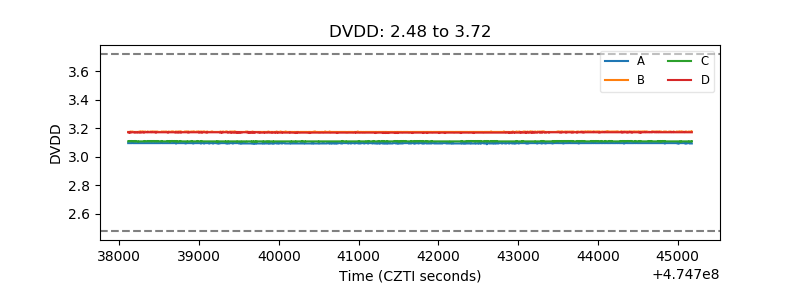 |
| Temperature 1 | 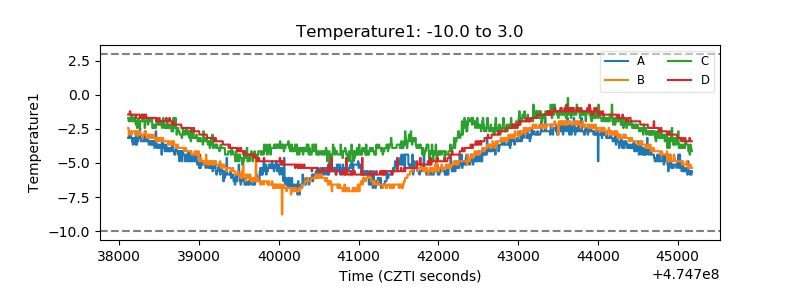 |
| Veto HV Monitor | 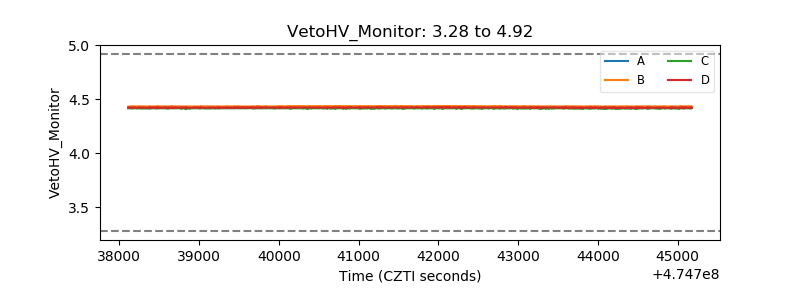 |
| Veto LLD | 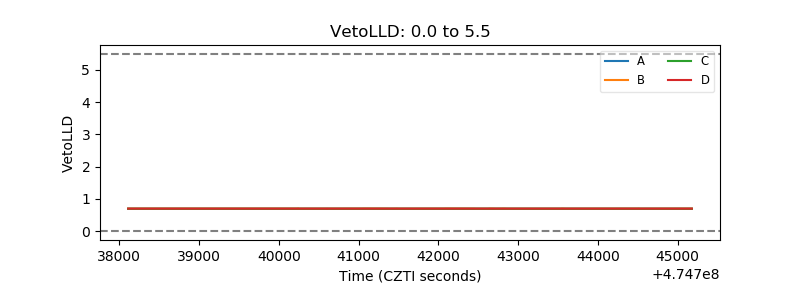 |
| Alpha Counter | 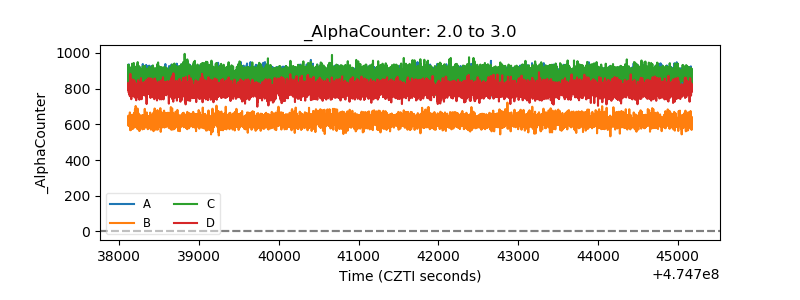 |
| _CPM_Rate | 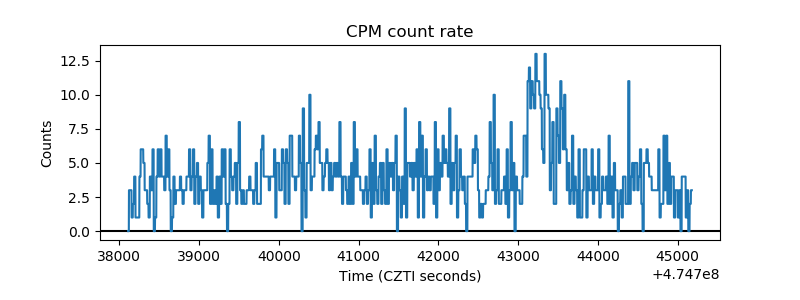 |
| CZT Counter | 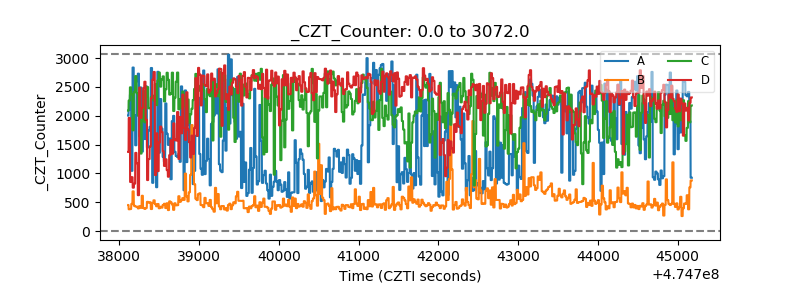 |
| +2.5 Volts monitor | 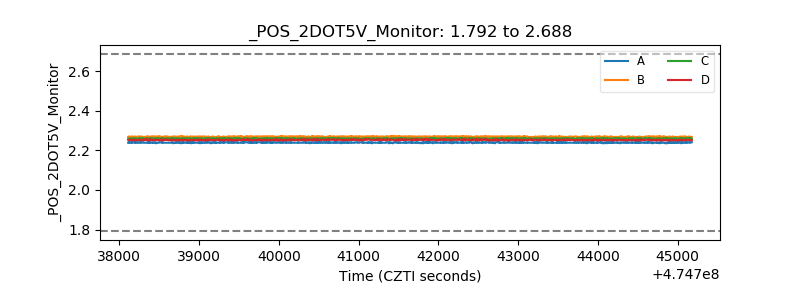 |
| +5 Volts monitor | 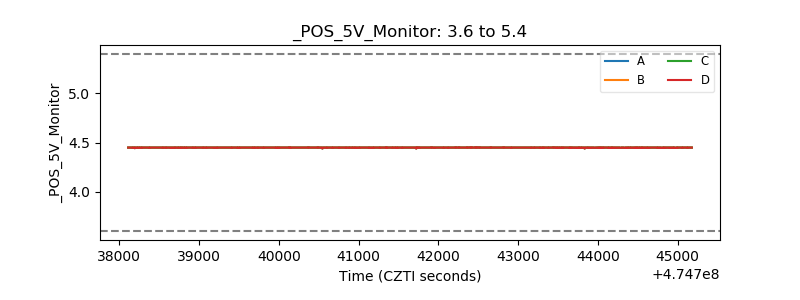 |
| _ROLL_ROT | 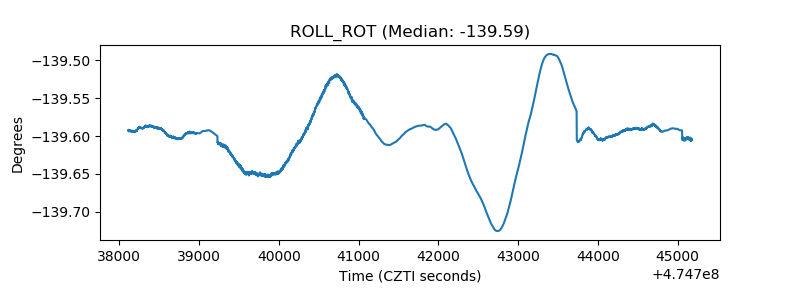 |
| _Roll_DEC | 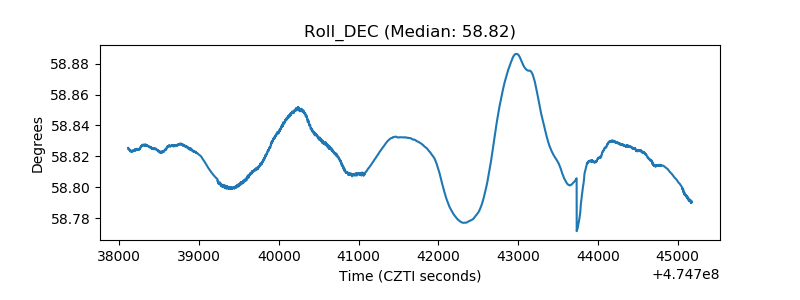 |
| _Roll_RA | 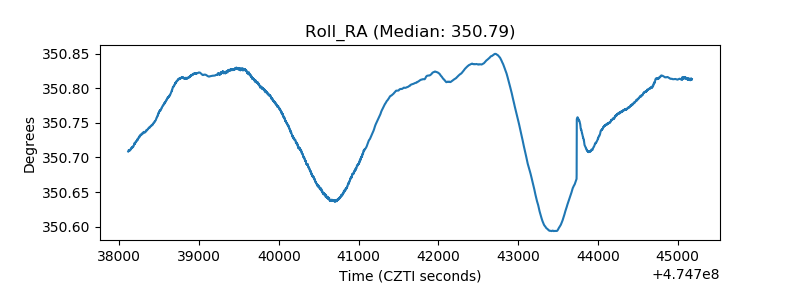 |
| Veto Counter | 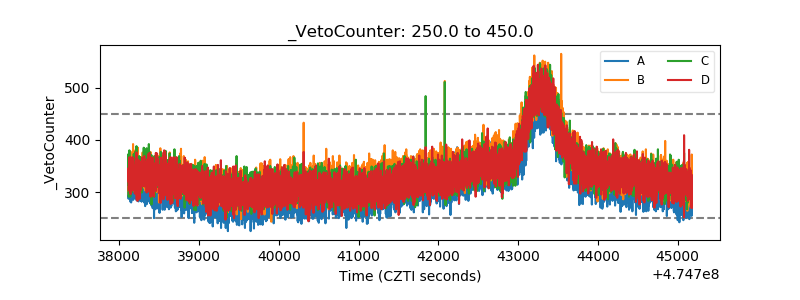 |