| Param | Original file | Final file |
|---|---|---|
| Filename | modeM0/AS1T05_239T01_9000006444_50499cztM0_level2.fits | modeM0/AS1T05_239T01_9000006444_50499cztM0_level2_quad_clean.evt |
| Size (bytes) | 1,112,097,600 | 73,656,000 |
| Size | 1.0 GB | 70.2 MB |
| Events in quadrant A | 5,347,033 | 665,639 |
| Events in quadrant B | 3,497,207 | 737,108 |
| Events in quadrant C | 14,263,089 | 312,089 |
| Events in quadrant D | 17,497,883 | 9,436 |
| Mode M0 | |||
|---|---|---|---|
| Quadrant | BADHDUFLAG | Total packets | Discarded packets |
| A | 0 | 20865 | 0 |
| B | 0 | 15513 | 0 |
| C | 0 | 47370 | 0 |
| D | 0 | 56841 | 0 |
| Mode SS | |||
|---|---|---|---|
| Quadrant | BADHDUFLAG | Total packets | Discarded packets |
| A | 0 | 146 | 0 |
| B | 0 | 146 | 0 |
| C | 0 | 146 | 0 |
| D | 0 | 146 | 0 |
| Quadrant | Total seconds | Saturated seconds | Saturation percentage |
|---|---|---|---|
| A | 7256 | 255 | 3.514333% |
| B | 7255 | 39 | 0.537560% |
| C | 7255 | 4181 | 57.629221% |
| D | 7255 | 7173 | 98.869745% |
Noise dominated data is calculated using 1-second bins in cleaned event files. If a bin has >2000 counts, and if more than 50% of those come from <1% of pixels, then it is considered to be noise-dominated and hence unusable.
| Quadrant | # 1 sec bins | Bins with >0 counts | Bins with >2000 counts | High rate bins dominated by noise | Noise dominated (total time) | Noise dominated (detector-on time) | Marked lightcurve |
|---|---|---|---|---|---|---|---|
| A | 7256 | 7256 | 200 | 200 | 2.76% | 2.76% | 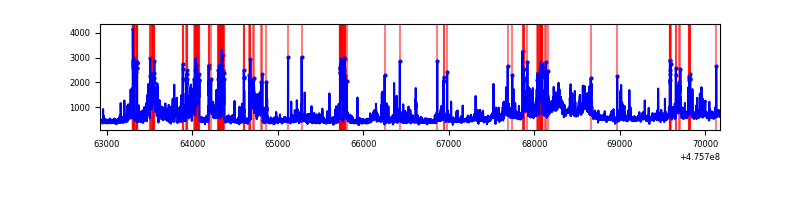 |
| B | 7255 | 7255 | 25 | 25 | 0.34% | 0.34% | 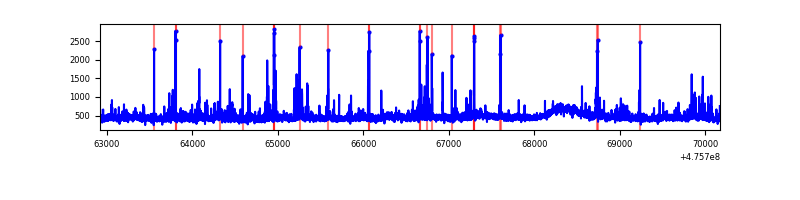 |
| C | 7255 | 7255 | 3973 | 3973 | 54.76% | 54.76% | 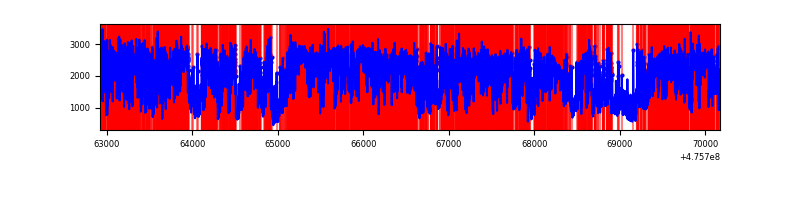 |
| D | 7254 | 7254 | 6763 | 6763 | 93.23% | 93.23% | 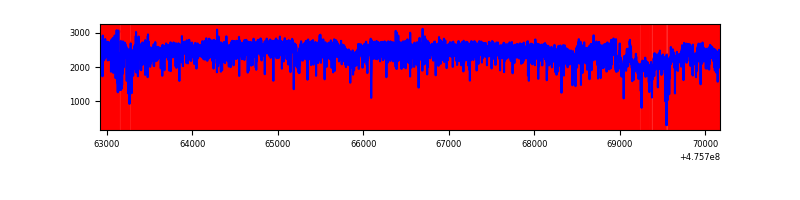 |
Top three noisy pixels from each quadrant. If the there are fewer than three noisy pixels in the level2.evt file, extra rows are filled as -1
| Pixel properties | Quadrant properties | ||||||
|---|---|---|---|---|---|---|---|
| Quadrant | DetID | PixID | Counts | Sigma | Mean | Median | Sigma |
| A | 10 | 253 | 907855 | 4785.91 | 770 | 750 | 189.5 |
| A | 4 | 3 | 445156 | 2344.7 | 770 | 750 | 189.5 |
| A | 3 | 44 | 167004 | 877.16 | 770 | 750 | 189.5 |
| B | 10 | 246 | 61507 | 368.37 | 772 | 746 | 164.9 |
| B | 8 | 128 | 59118 | 353.89 | 772 | 746 | 164.9 |
| B | 9 | 218 | 46883 | 279.71 | 772 | 746 | 164.9 |
| C | 15 | 235 | 3795486 | 23093.75 | 590 | 586 | 164.3 |
| C | 15 | 196 | 1849692 | 11252.68 | 590 | 586 | 164.3 |
| C | 15 | 236 | 931474 | 5664.89 | 590 | 586 | 164.3 |
| D | 7 | 61 | 12123407 | 140299.83 | 297 | 285 | 86.4 |
| D | 15 | 184 | 1516640 | 17548.64 | 297 | 285 | 86.4 |
| D | 14 | 67 | 299778 | 3466.01 | 297 | 285 | 86.4 |
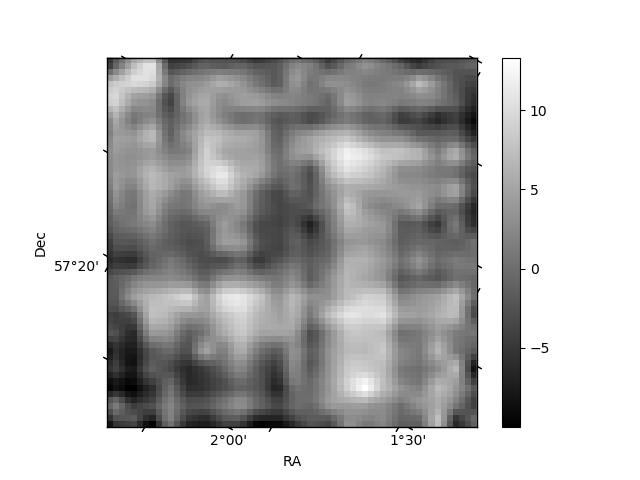
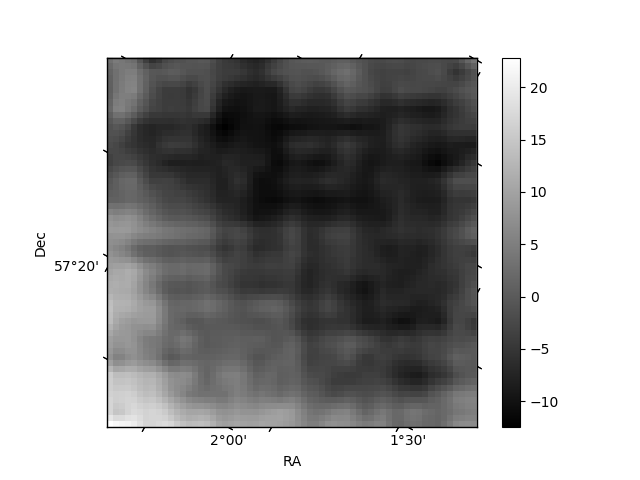
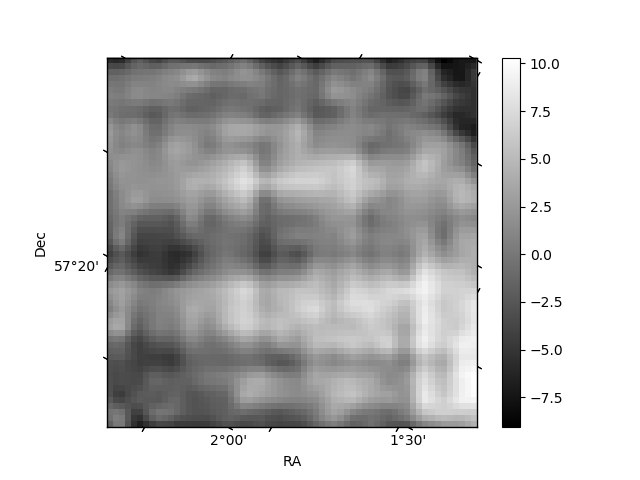
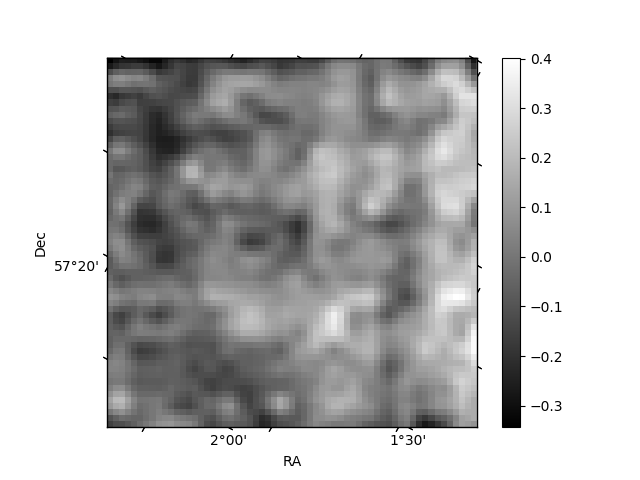
Histogram calculated using DETX and DETY for each event in the final _common_clean file
| Quadrant A | 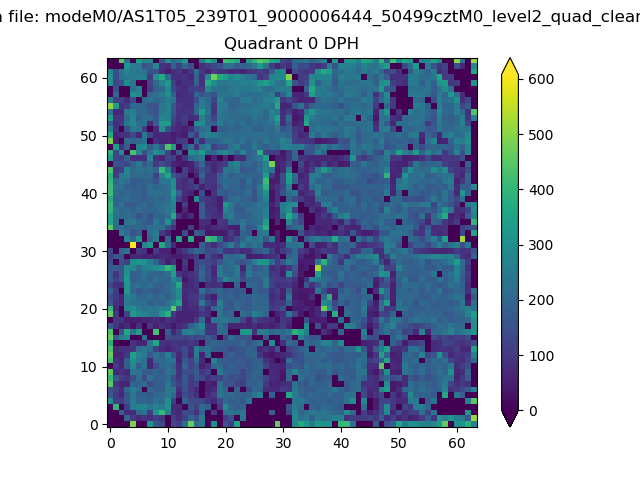 |
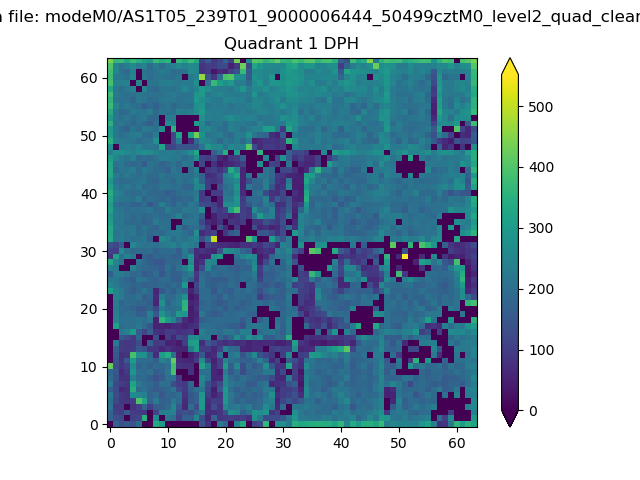 |
Quadrant B |
|---|---|---|---|
| Quadrant D | 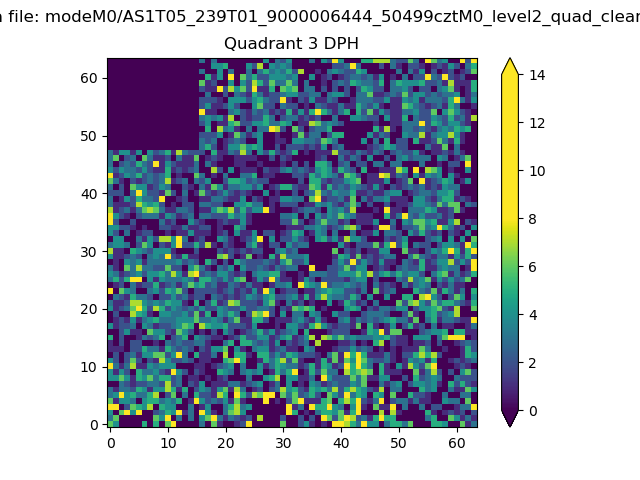 |
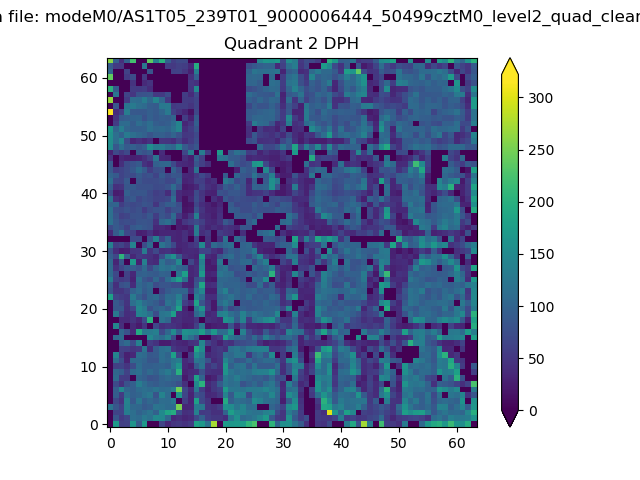 |
Quadrant C |
| Plot type | Count rate plots | Images |
|---|---|---|
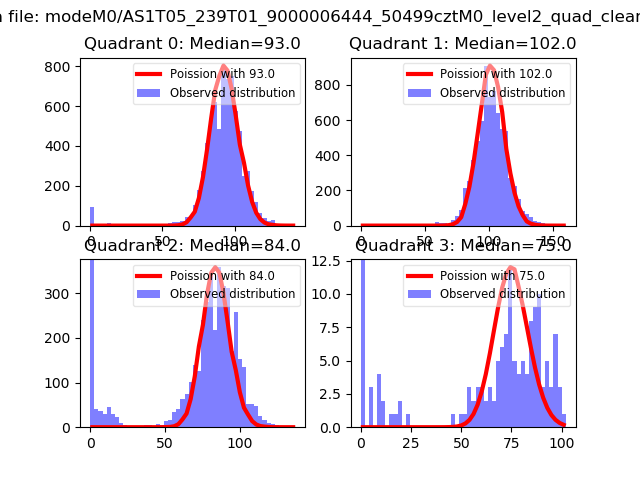
| Comparison with Poisson distribution Blue bars denote a histogram of data divided into 1 sec bins. Red curve is a Poisson curve with rate = median count rate of data. |
 |
 |
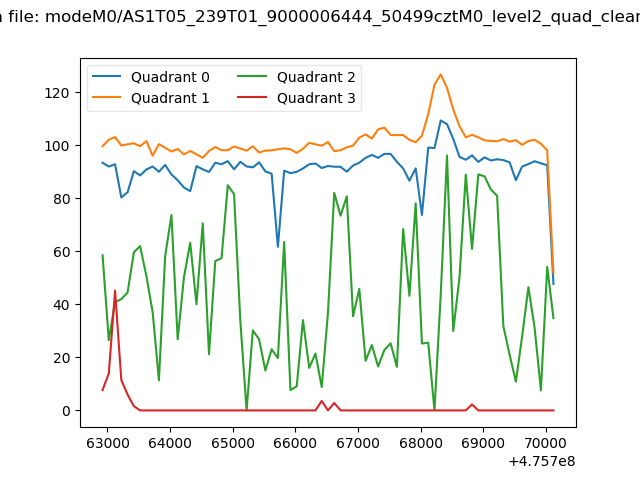
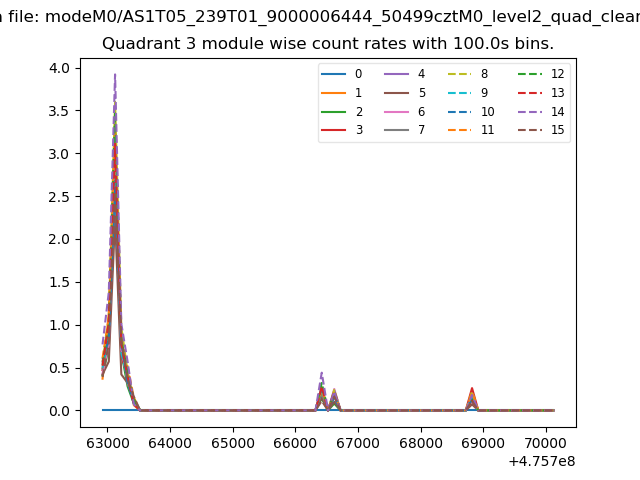
| Quadrant-wise count rates Data is divided into 100 sec bins |
 |
|
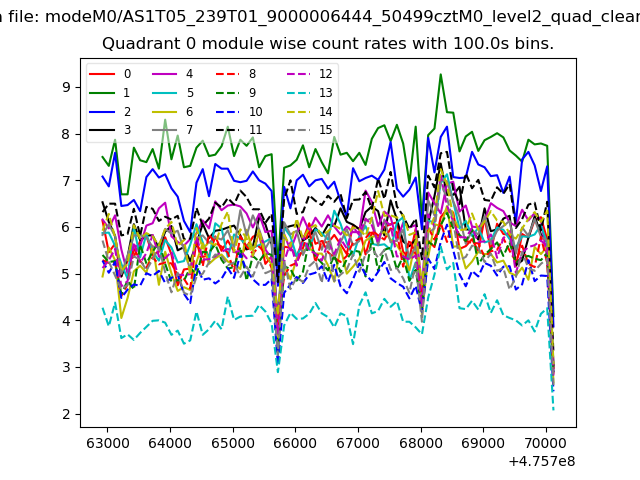
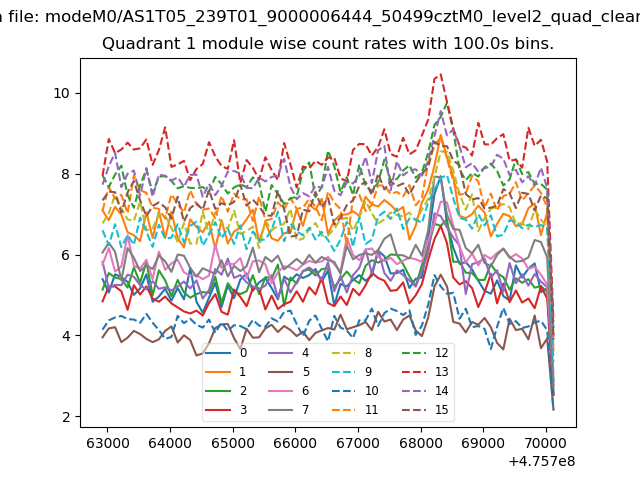
| Module-wise count rates for Quadrant A Data is divided into 100 sec bins |
 |
 |
| Module-wise count rates for Quadrant B Data is divided into 100 sec bins |
 |
 |
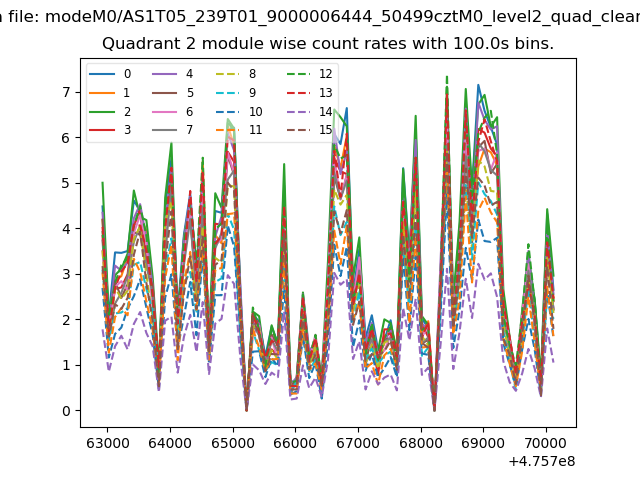
| Module-wise count rates for Quadrant C Data is divided into 100 sec bins |
 |
 |
| Module-wise count rates for Quadrant D Data is divided into 100 sec bins |
 |
 |
| Parameter | Plot |
|---|---|
| CZT HV Monitor | 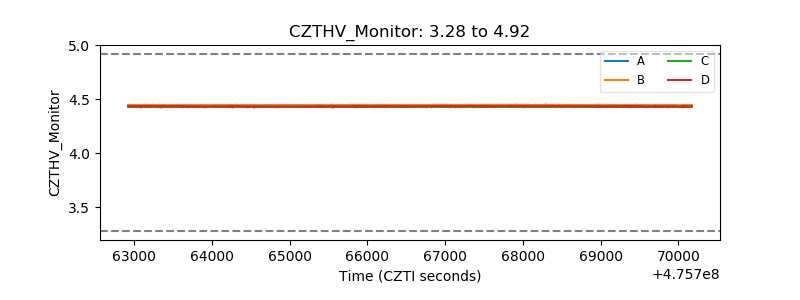 |
| D_VDD | 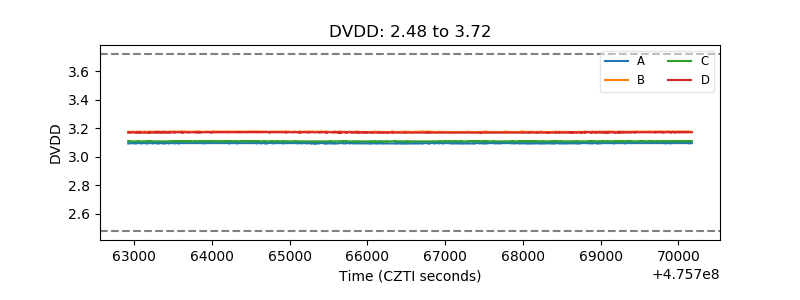 |
| Temperature 1 | 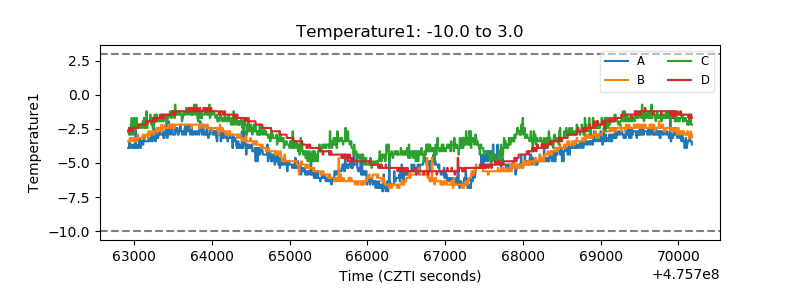 |
| Veto HV Monitor |  |
| Veto LLD |  |
| Alpha Counter | 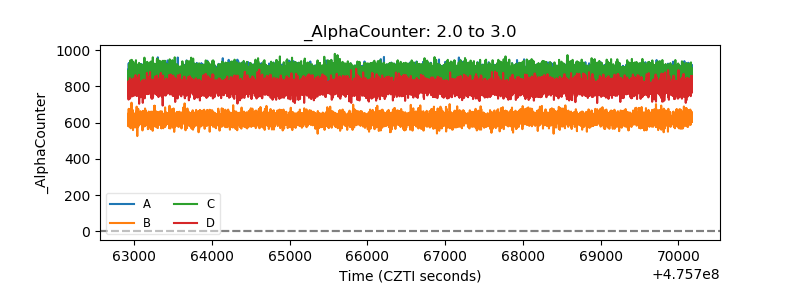 |
| _CPM_Rate | 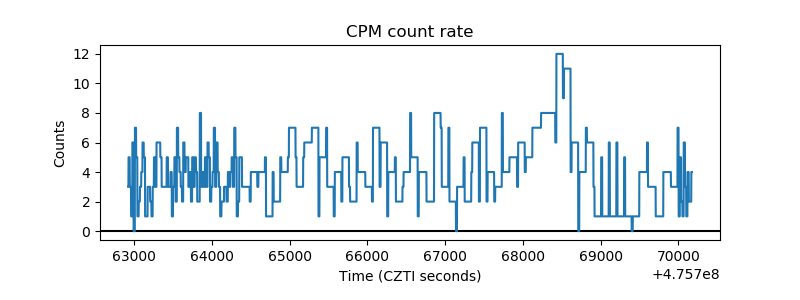 |
| CZT Counter | 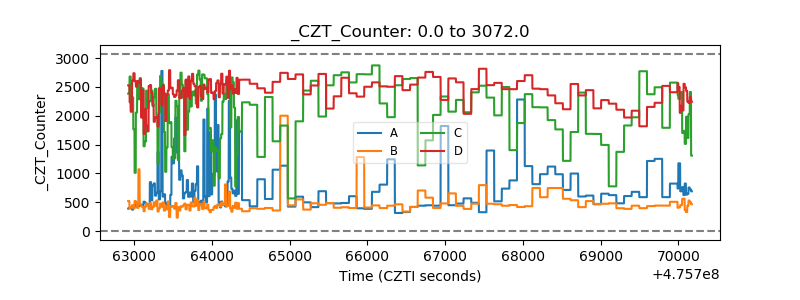 |
| +2.5 Volts monitor | 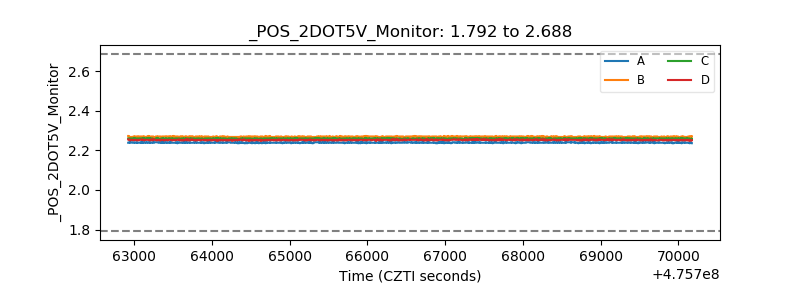 |
| +5 Volts monitor |  |
| _ROLL_ROT | 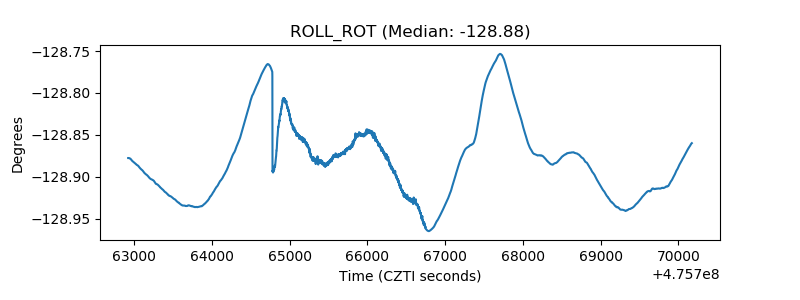 |
| _Roll_DEC | 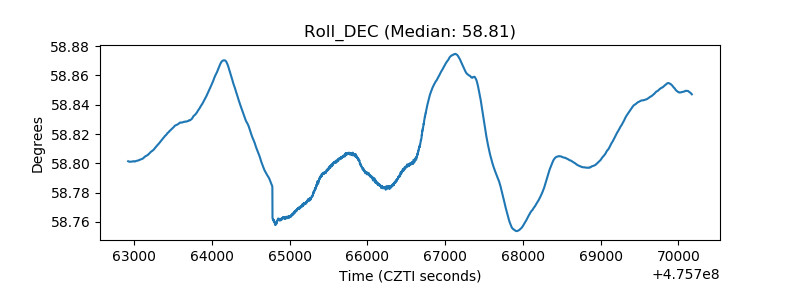 |
| _Roll_RA | 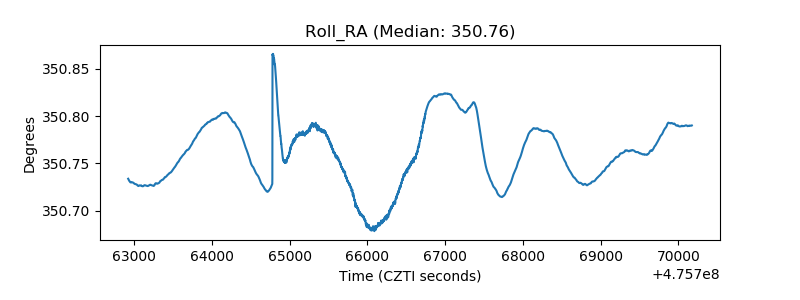 |
| Veto Counter | 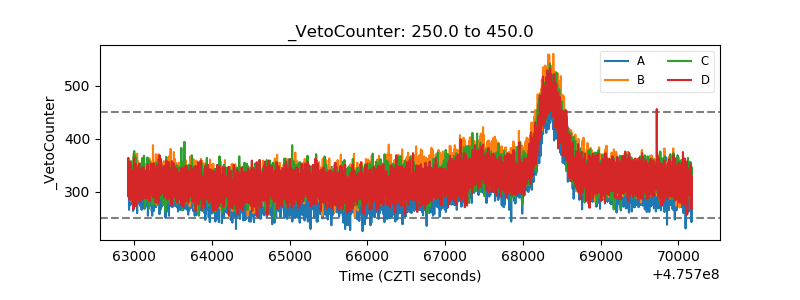 |