| Param | Original file | Final file |
|---|---|---|
| Filename | modeM0/AS1T05_239T01_9000006444_50526cztM0_level2.fits | modeM0/AS1T05_239T01_9000006444_50526cztM0_level2_quad_clean.evt |
| Size (bytes) | 829,120,320 | 94,233,600 |
| Size | 790.7 MB | 89.9 MB |
| Events in quadrant A | 6,190,802 | 642,923 |
| Events in quadrant B | 6,512,947 | 642,682 |
| Events in quadrant C | 6,576,761 | 610,598 |
| Events in quadrant D | 10,840,543 | 443,285 |
| Mode M0 | |||
|---|---|---|---|
| Quadrant | BADHDUFLAG | Total packets | Discarded packets |
| A | 0 | 23337 | 0 |
| B | 0 | 24531 | 0 |
| C | 0 | 24597 | 0 |
| D | 0 | 37384 | 0 |
| Mode SS | |||
|---|---|---|---|
| Quadrant | BADHDUFLAG | Total packets | Discarded packets |
| A | 0 | 148 | 0 |
| B | 0 | 148 | 0 |
| C | 0 | 148 | 0 |
| D | 0 | 148 | 0 |
| Quadrant | Total seconds | Saturated seconds | Saturation percentage |
|---|---|---|---|
| A | 7374 | 601 | 8.150258% |
| B | 7375 | 1175 | 15.932203% |
| C | 7375 | 707 | 9.586441% |
| D | 7375 | 2375 | 32.203390% |
Noise dominated data is calculated using 1-second bins in cleaned event files. If a bin has >2000 counts, and if more than 50% of those come from <1% of pixels, then it is considered to be noise-dominated and hence unusable.
| Quadrant | # 1 sec bins | Bins with >0 counts | Bins with >2000 counts | High rate bins dominated by noise | Noise dominated (total time) | Noise dominated (detector-on time) | Marked lightcurve |
|---|---|---|---|---|---|---|---|
| A | 7374 | 7374 | 487 | 487 | 6.60% | 6.60% | 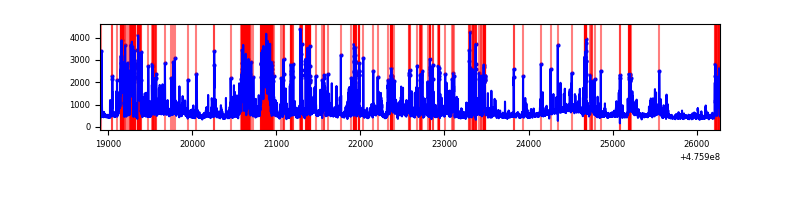 |
| B | 7375 | 7375 | 972 | 972 | 13.18% | 13.18% | 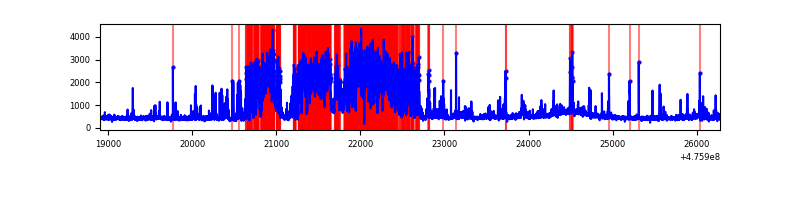 |
| C | 7375 | 7375 | 612 | 612 | 8.30% | 8.30% | 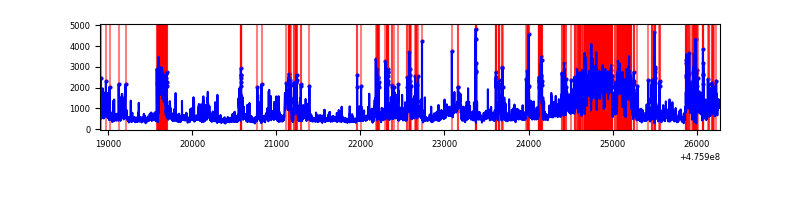 |
| D | 7375 | 7375 | 2149 | 2149 | 29.14% | 29.14% | 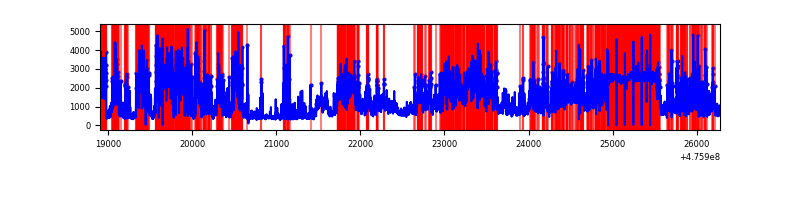 |
Top three noisy pixels from each quadrant. If the there are fewer than three noisy pixels in the level2.evt file, extra rows are filled as -1
| Pixel properties | Quadrant properties | ||||||
|---|---|---|---|---|---|---|---|
| Quadrant | DetID | PixID | Counts | Sigma | Mean | Median | Sigma |
| A | 6 | 161 | 854603 | 4519.01 | 770 | 752 | 188.9 |
| A | 4 | 249 | 772333 | 4083.6 | 770 | 752 | 188.9 |
| A | 12 | 250 | 481531 | 2544.52 | 770 | 752 | 188.9 |
| B | 7 | 0 | 2587512 | 16427.78 | 736 | 709 | 157.5 |
| B | 10 | 28 | 556243 | 3527.98 | 736 | 709 | 157.5 |
| B | 4 | 170 | 66615 | 418.54 | 736 | 709 | 157.5 |
| C | 1 | 44 | 980435 | 4797.46 | 740 | 736 | 204.2 |
| C | 15 | 232 | 495017 | 2420.43 | 740 | 736 | 204.2 |
| C | 15 | 196 | 438812 | 2145.2 | 740 | 736 | 204.2 |
| D | 6 | 42 | 2705557 | 15212.89 | 635 | 612 | 177.8 |
| D | 7 | 61 | 1755299 | 9868.54 | 635 | 612 | 177.8 |
| D | 15 | 184 | 1453932 | 8173.62 | 635 | 612 | 177.8 |
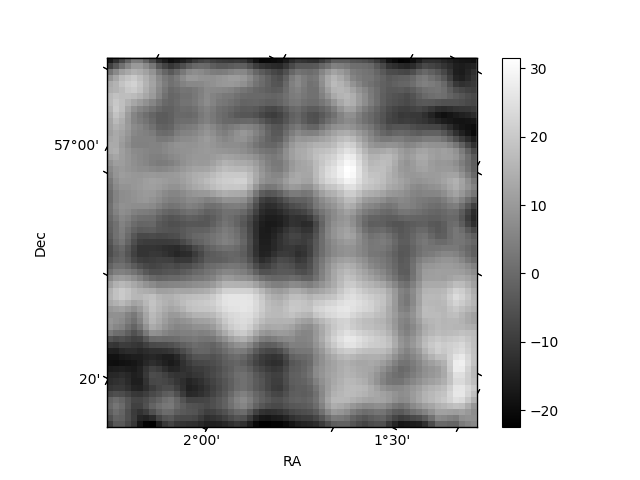
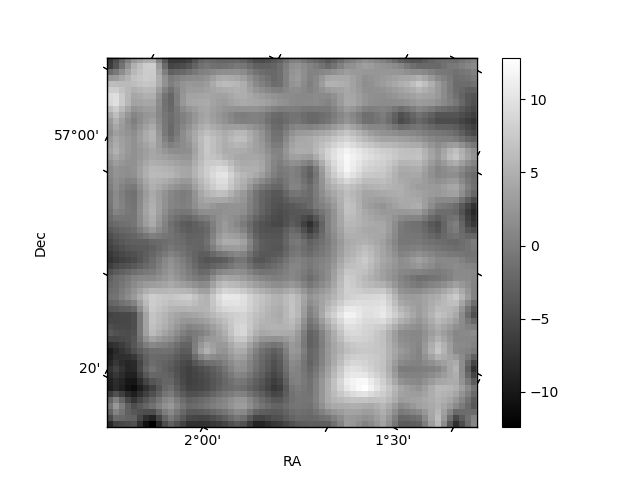
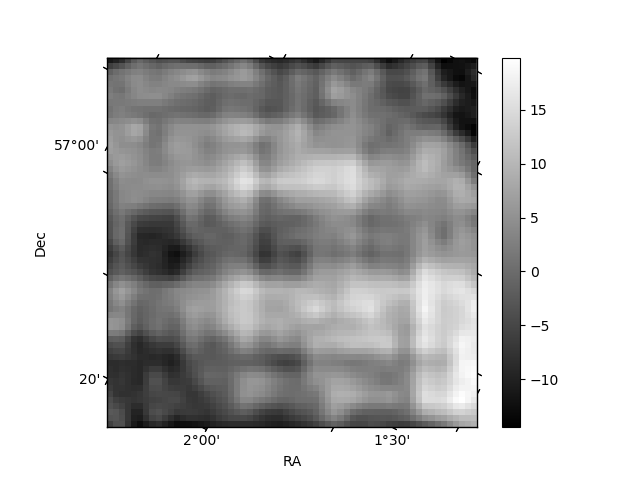
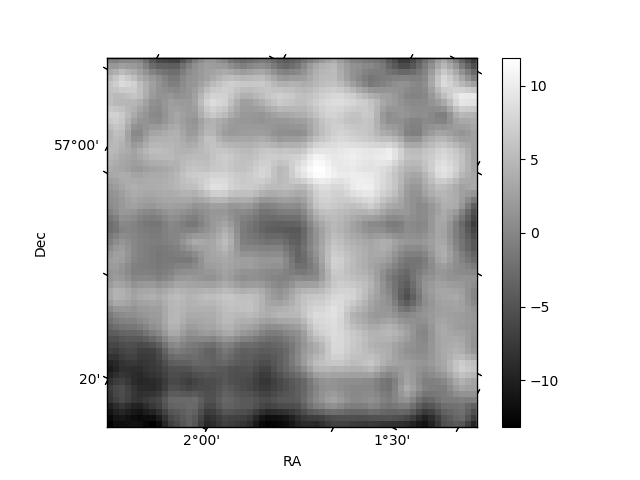
Histogram calculated using DETX and DETY for each event in the final _common_clean file
| Quadrant A | 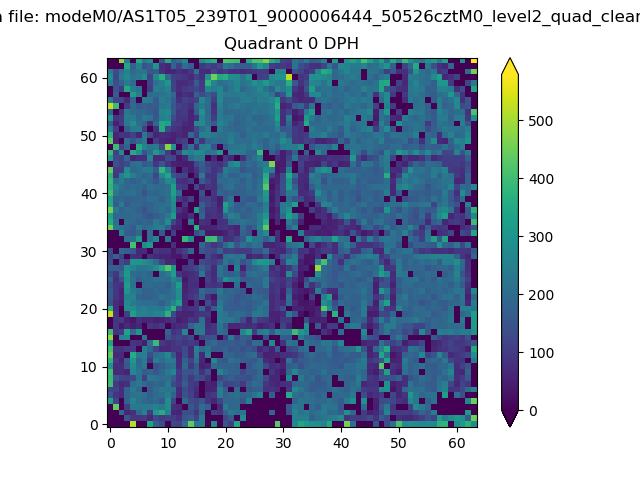 |
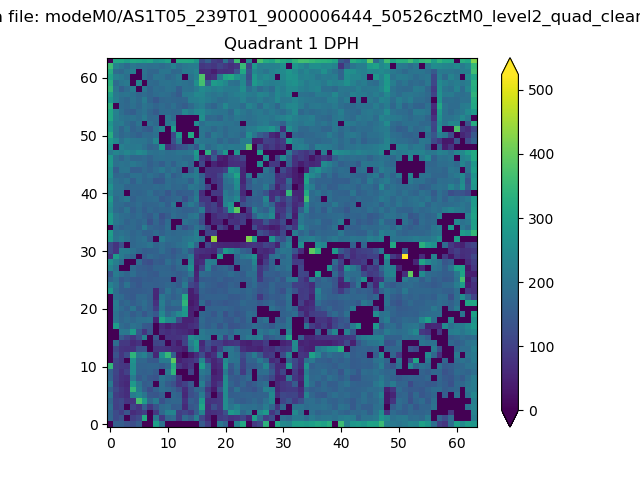 |
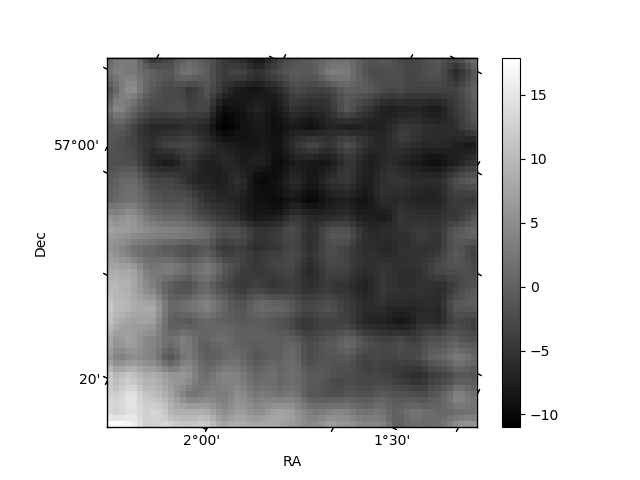
Quadrant B |
|---|---|---|---|
| Quadrant D | 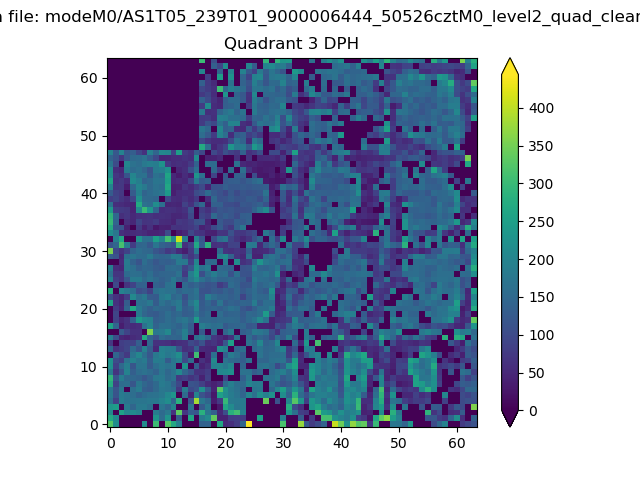 |
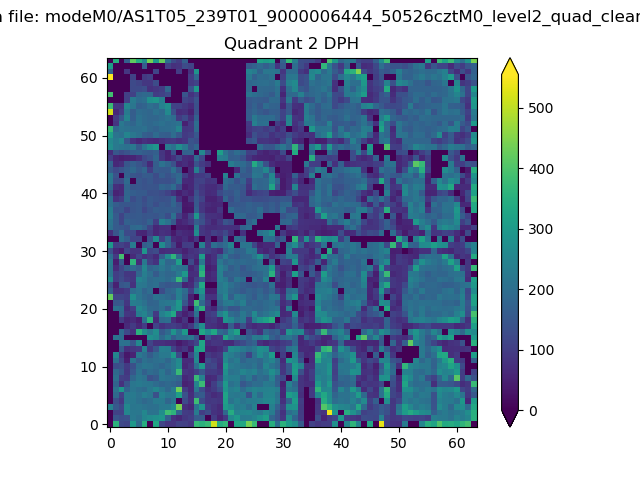 |
Quadrant C |
| Plot type | Count rate plots | Images |
|---|---|---|
| Comparison with Poisson distribution Blue bars denote a histogram of data divided into 1 sec bins. Red curve is a Poisson curve with rate = median count rate of data. |
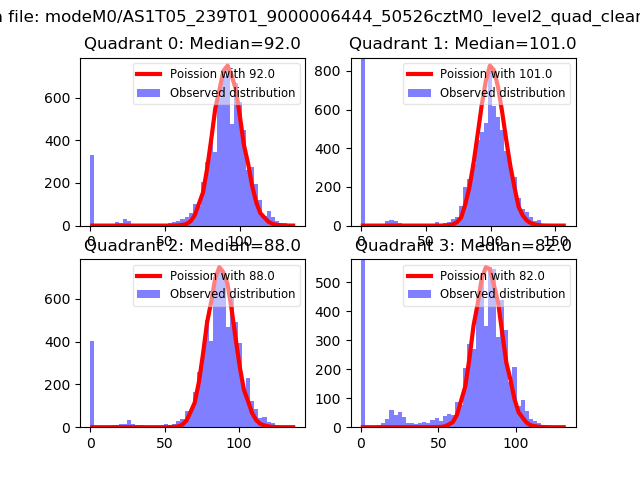 |
 |
| Quadrant-wise count rates Data is divided into 100 sec bins |
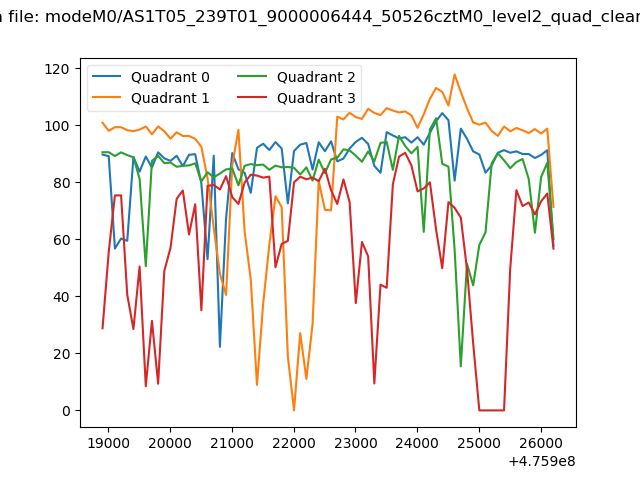 |
|
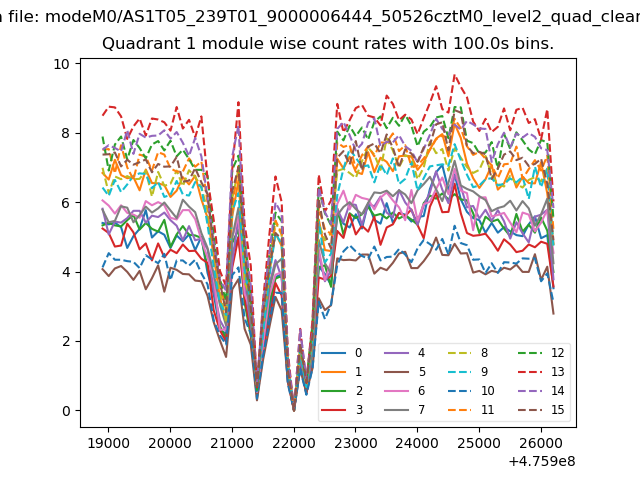
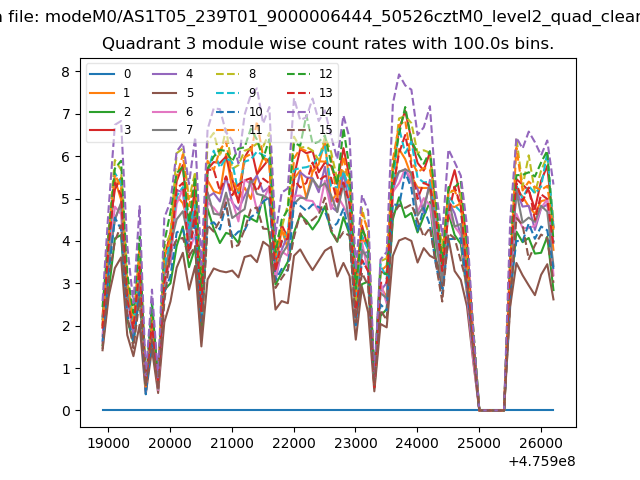
| Module-wise count rates for Quadrant A Data is divided into 100 sec bins |
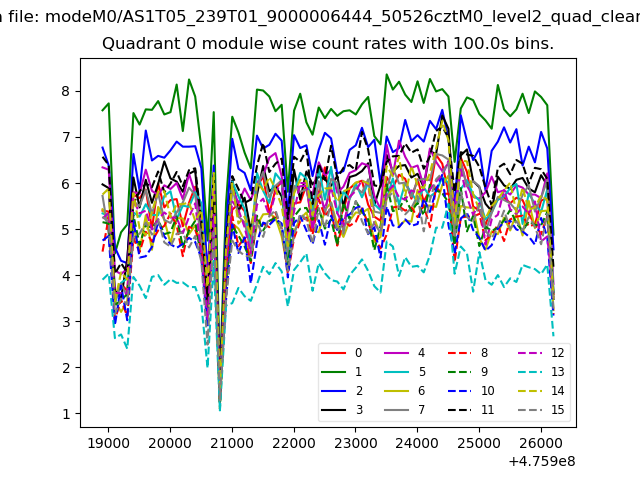 |
 |
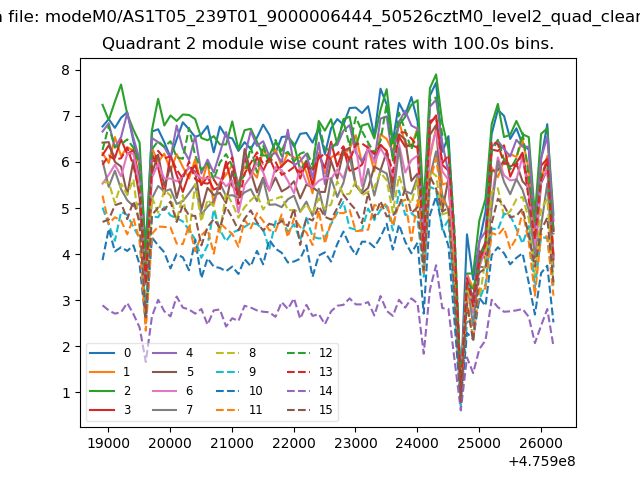
| Module-wise count rates for Quadrant B Data is divided into 100 sec bins |
 |
 |
| Module-wise count rates for Quadrant C Data is divided into 100 sec bins |
 |
 |
| Module-wise count rates for Quadrant D Data is divided into 100 sec bins |
 |
 |
| Parameter | Plot |
|---|---|
| CZT HV Monitor | 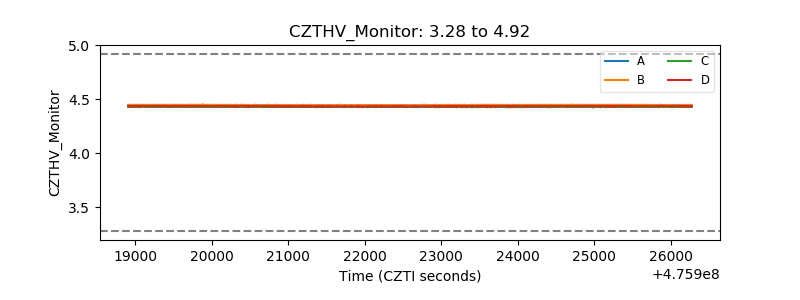 |
| D_VDD | 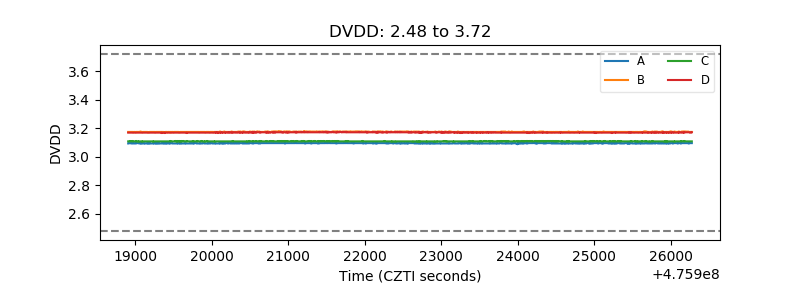 |
| Temperature 1 | 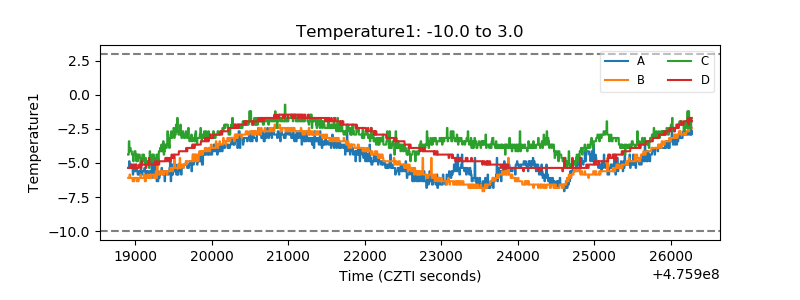 |
| Veto HV Monitor | 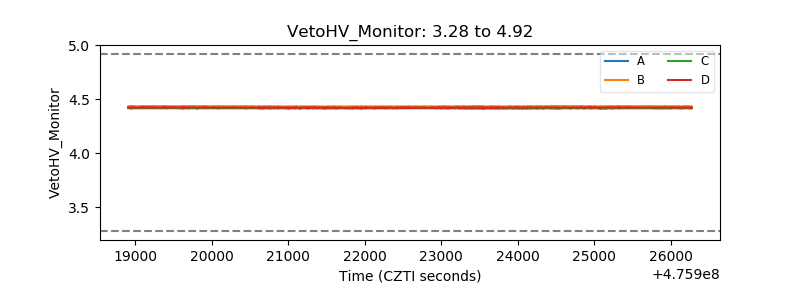 |
| Veto LLD | 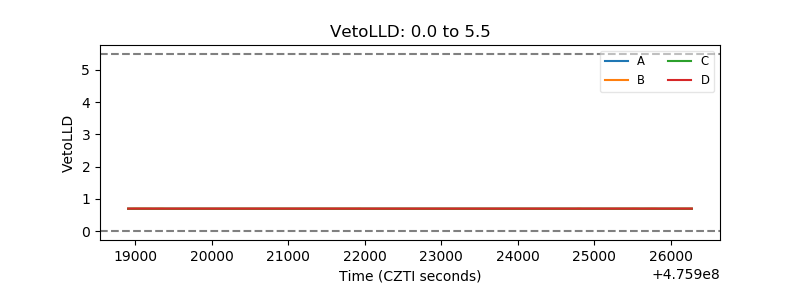 |
| Alpha Counter | 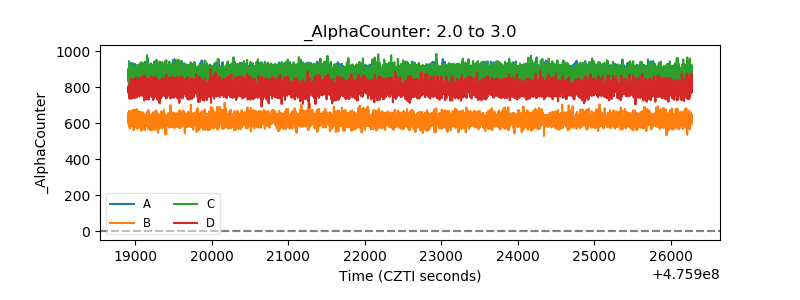 |
| _CPM_Rate | 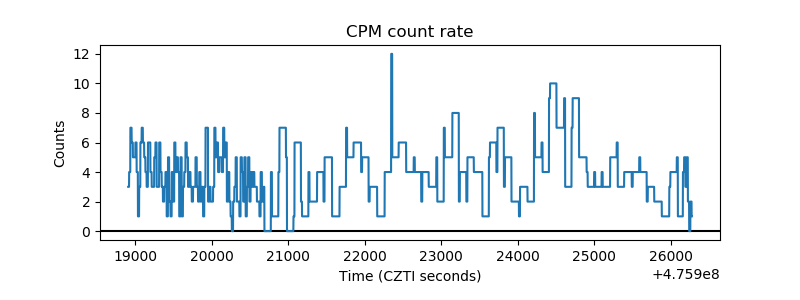 |
| CZT Counter | 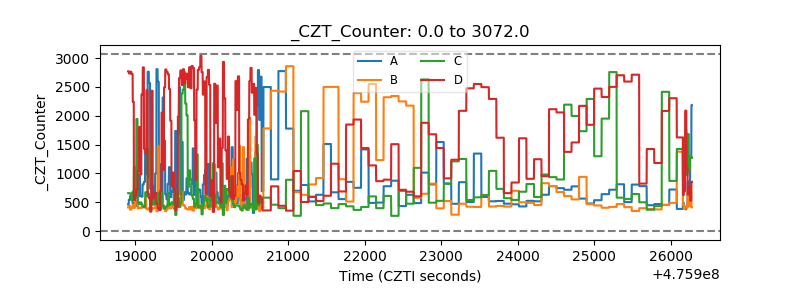 |
| +2.5 Volts monitor |  |
| +5 Volts monitor |  |
| _ROLL_ROT | 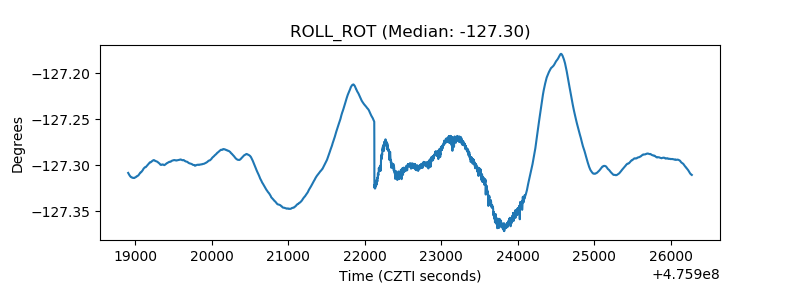 |
| _Roll_DEC | 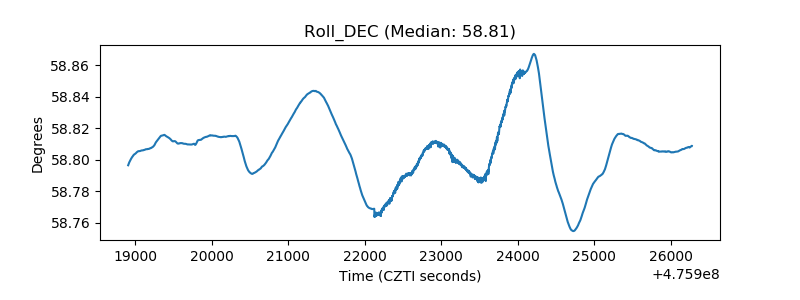 |
| _Roll_RA | 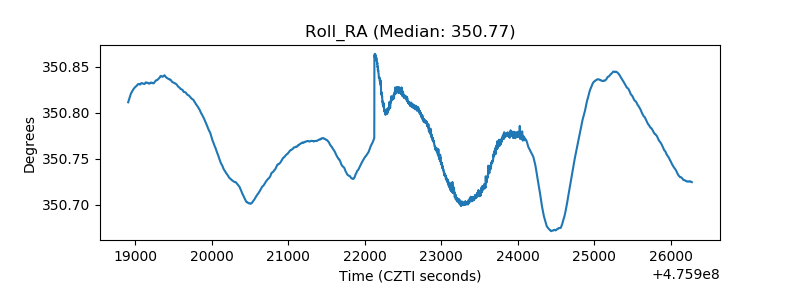 |
| Veto Counter | 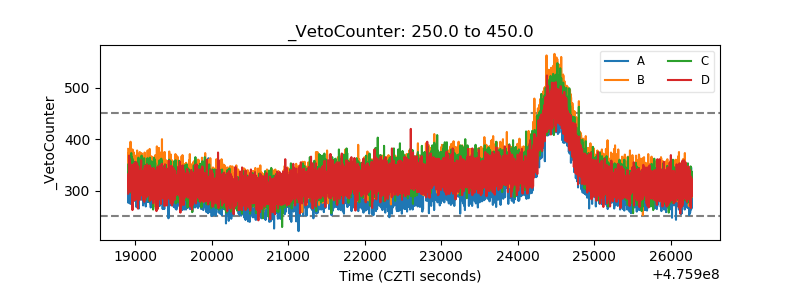 |