| Param | Original file | Final file |
|---|---|---|
| Filename | modeM0/AS1T05_239T01_9000006444_50527cztM0_level2.fits | modeM0/AS1T05_239T01_9000006444_50527cztM0_level2_quad_clean.evt |
| Size (bytes) | 1,018,635,840 | 79,960,320 |
| Size | 971.4 MB | 76.3 MB |
| Events in quadrant A | 7,454,210 | 537,373 |
| Events in quadrant B | 4,281,221 | 701,431 |
| Events in quadrant C | 11,572,898 | 417,421 |
| Events in quadrant D | 13,853,744 | 272,475 |
| Mode M0 | |||
|---|---|---|---|
| Quadrant | BADHDUFLAG | Total packets | Discarded packets |
| A | 0 | 26868 | 0 |
| B | 0 | 17372 | 0 |
| C | 0 | 39311 | 1 |
| D | 0 | 45991 | 0 |
| Mode SS | |||
|---|---|---|---|
| Quadrant | BADHDUFLAG | Total packets | Discarded packets |
| A | 0 | 142 | 0 |
| B | 0 | 142 | 0 |
| C | 0 | 142 | 0 |
| D | 0 | 142 | 0 |
| Quadrant | Total seconds | Saturated seconds | Saturation percentage |
|---|---|---|---|
| A | 7060 | 1404 | 19.886686% |
| B | 7061 | 192 | 2.719162% |
| C | 7060 | 2674 | 37.875354% |
| D | 7060 | 3980 | 56.373938% |
Noise dominated data is calculated using 1-second bins in cleaned event files. If a bin has >2000 counts, and if more than 50% of those come from <1% of pixels, then it is considered to be noise-dominated and hence unusable.
| Quadrant | # 1 sec bins | Bins with >0 counts | Bins with >2000 counts | High rate bins dominated by noise | Noise dominated (total time) | Noise dominated (detector-on time) | Marked lightcurve |
|---|---|---|---|---|---|---|---|
| A | 7060 | 7060 | 1150 | 1150 | 16.29% | 16.29% | 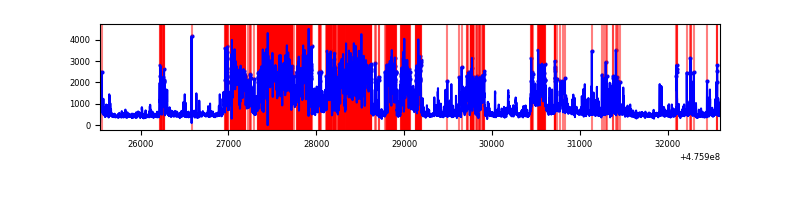 |
| B | 7061 | 7061 | 118 | 118 | 1.67% | 1.67% | 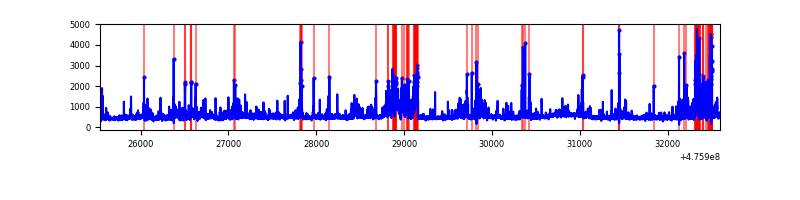 |
| C | 7060 | 7060 | 2271 | 2271 | 32.17% | 32.17% | 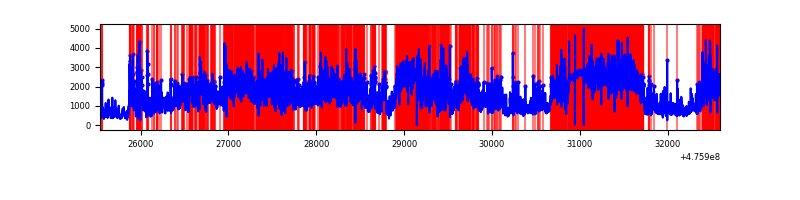 |
| D | 7060 | 7057 | 3743 | 3743 | 53.02% | 53.04% | 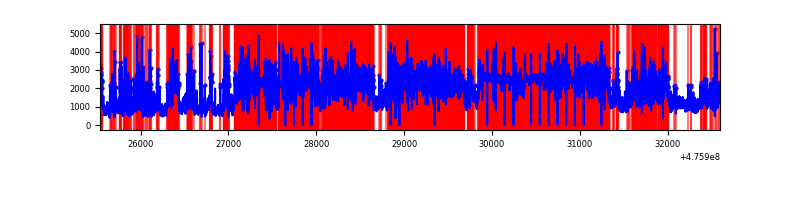 |
Top three noisy pixels from each quadrant. If the there are fewer than three noisy pixels in the level2.evt file, extra rows are filled as -1
| Pixel properties | Quadrant properties | ||||||
|---|---|---|---|---|---|---|---|
| Quadrant | DetID | PixID | Counts | Sigma | Mean | Median | Sigma |
| A | 12 | 250 | 1995343 | 11520.45 | 693 | 676 | 173.1 |
| A | 4 | 78 | 942496 | 5439.6 | 693 | 676 | 173.1 |
| A | 7 | 221 | 391348 | 2256.37 | 693 | 676 | 173.1 |
| B | 7 | 0 | 313662 | 1978.91 | 735 | 708 | 158.1 |
| B | 1 | 255 | 246825 | 1556.28 | 735 | 708 | 158.1 |
| B | 4 | 170 | 185346 | 1167.53 | 735 | 708 | 158.1 |
| C | 15 | 174 | 2781707 | 16659.26 | 600 | 595 | 166.9 |
| C | 15 | 147 | 1467336 | 8785.99 | 600 | 595 | 166.9 |
| C | 1 | 44 | 832106 | 4980.87 | 600 | 595 | 166.9 |
| D | 15 | 184 | 4790457 | 36118.65 | 468 | 451 | 132.6 |
| D | 7 | 61 | 4079171 | 30755.25 | 468 | 451 | 132.6 |
| D | 7 | 60 | 574520 | 4328.72 | 468 | 451 | 132.6 |
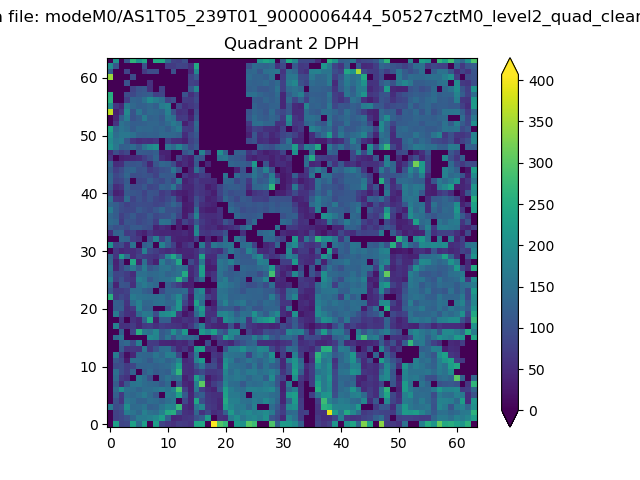
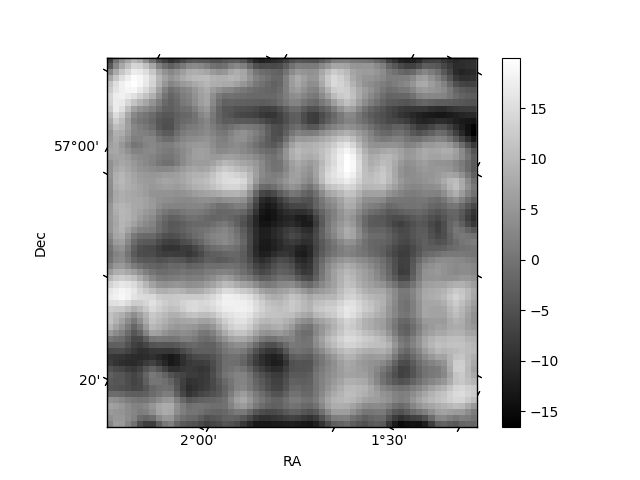
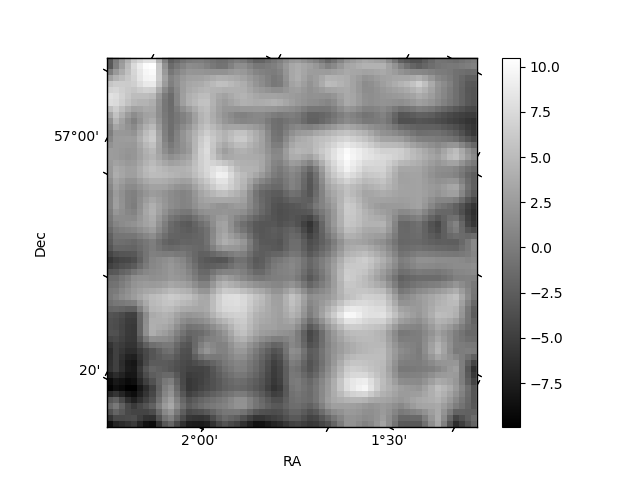
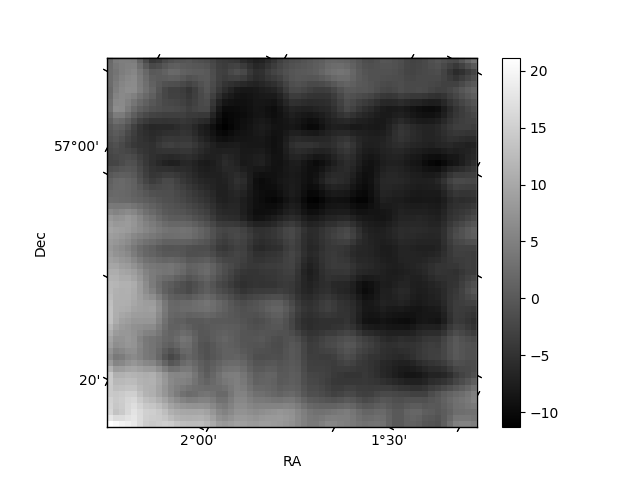
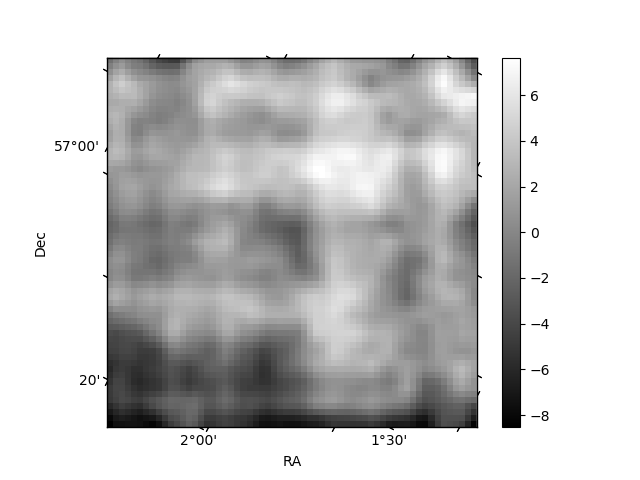
Histogram calculated using DETX and DETY for each event in the final _common_clean file
| Quadrant A | 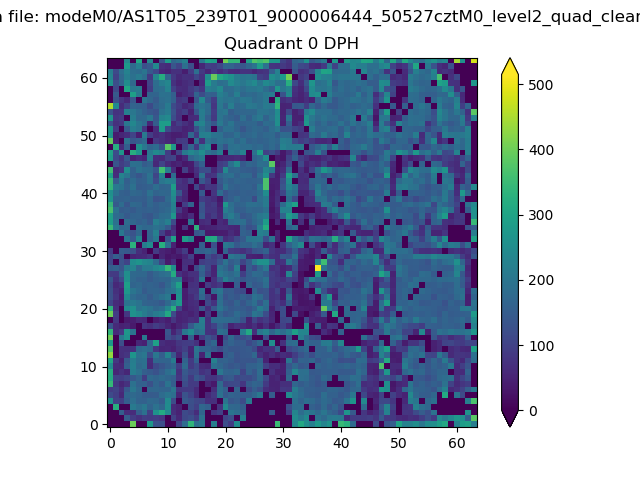 |
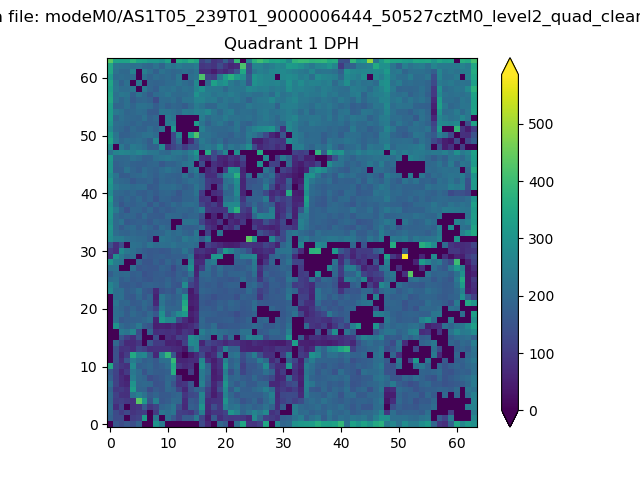 |
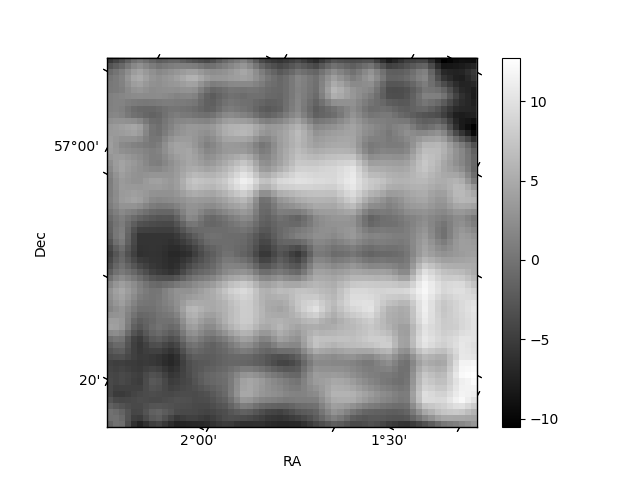
Quadrant B |
|---|---|---|---|
| Quadrant D | 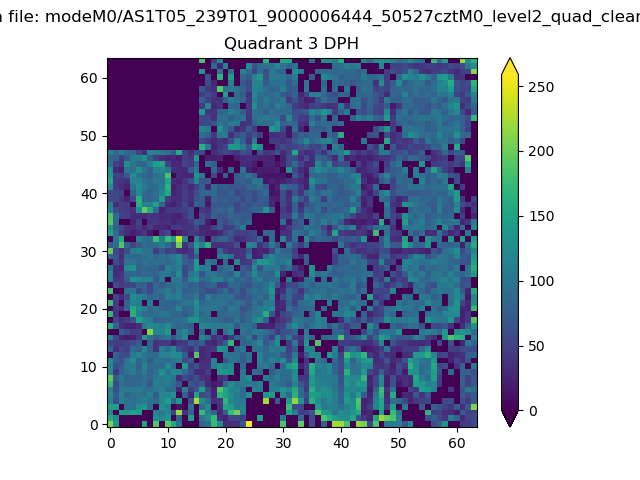 |
 |
Quadrant C |
| Plot type | Count rate plots | Images |
|---|---|---|
| Comparison with Poisson distribution Blue bars denote a histogram of data divided into 1 sec bins. Red curve is a Poisson curve with rate = median count rate of data. |
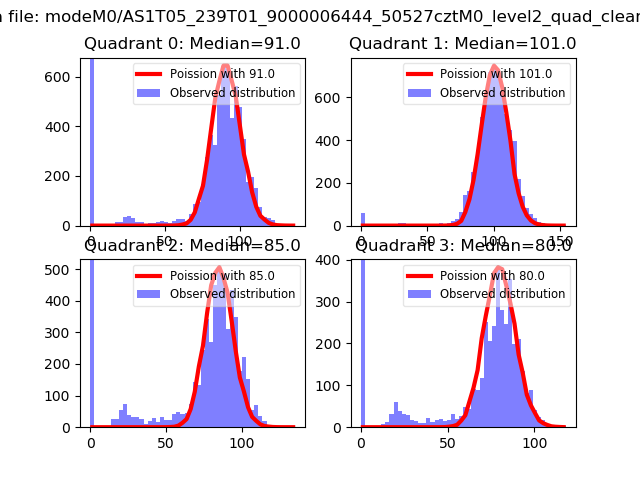 |
 |
| Quadrant-wise count rates Data is divided into 100 sec bins |
 |
|
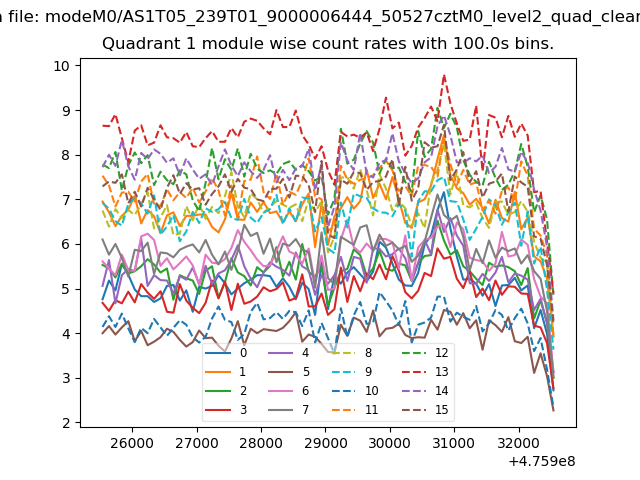
| Module-wise count rates for Quadrant A Data is divided into 100 sec bins |
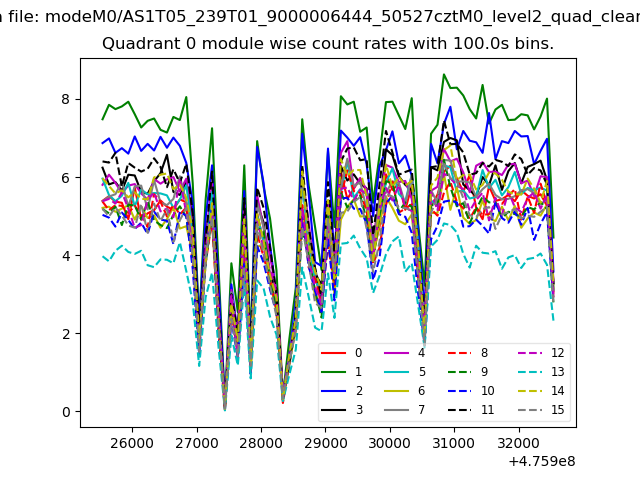 |
 |
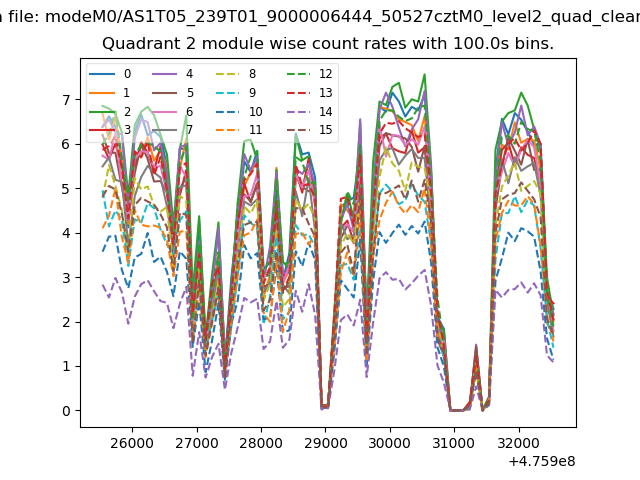
| Module-wise count rates for Quadrant B Data is divided into 100 sec bins |
 |
 |
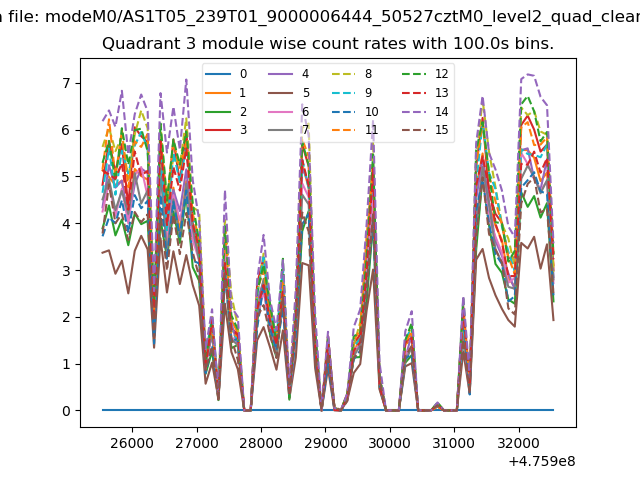
| Module-wise count rates for Quadrant C Data is divided into 100 sec bins |
 |
 |
| Module-wise count rates for Quadrant D Data is divided into 100 sec bins |
 |
 |
| Parameter | Plot |
|---|---|
| CZT HV Monitor | 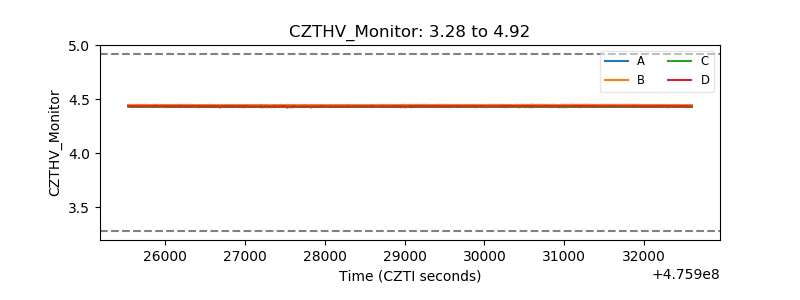 |
| D_VDD | 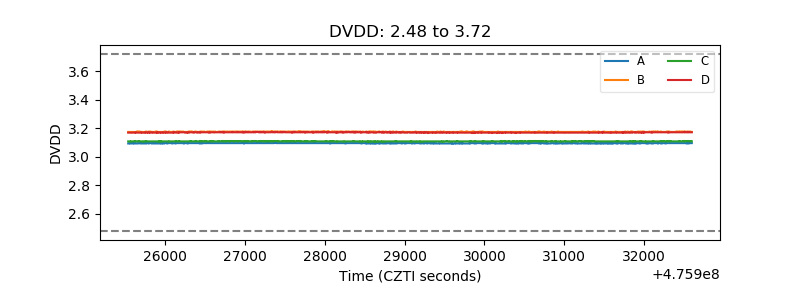 |
| Temperature 1 | 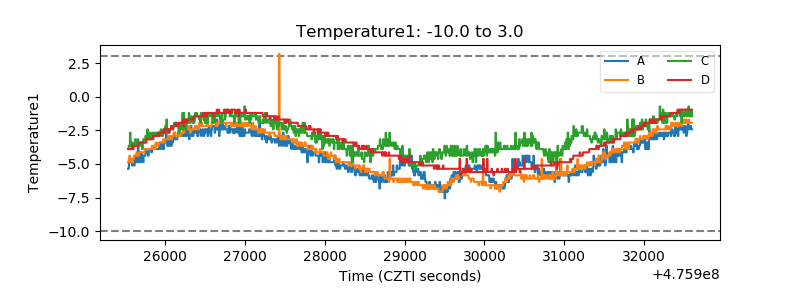 |
| Veto HV Monitor |  |
| Veto LLD | 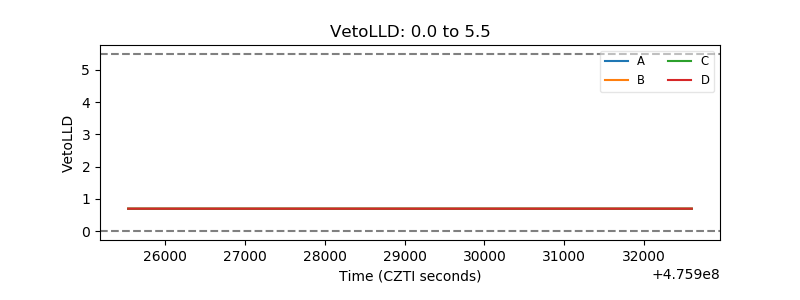 |
| Alpha Counter | 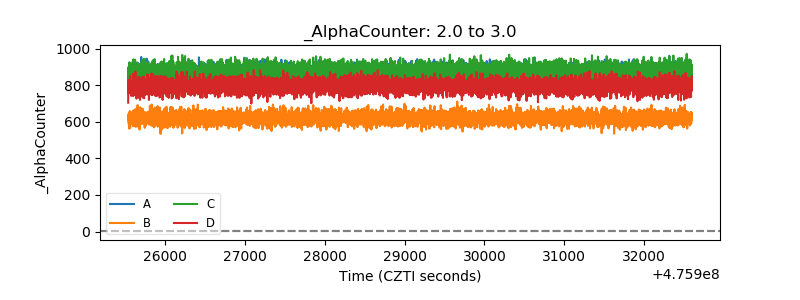 |
| _CPM_Rate | 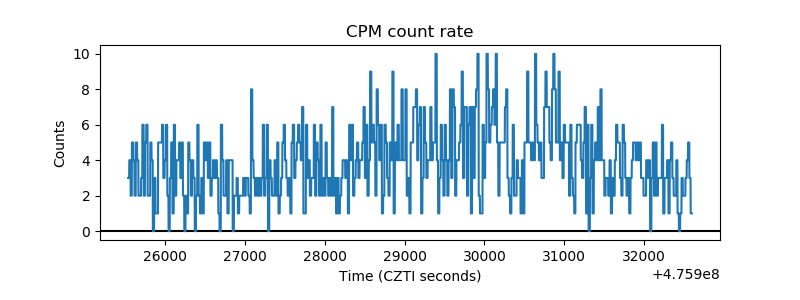 |
| CZT Counter | 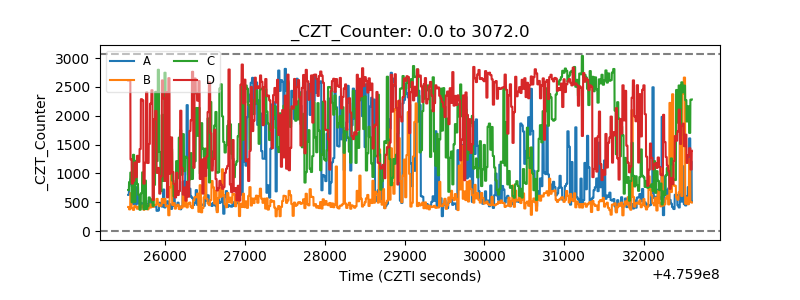 |
| +2.5 Volts monitor | 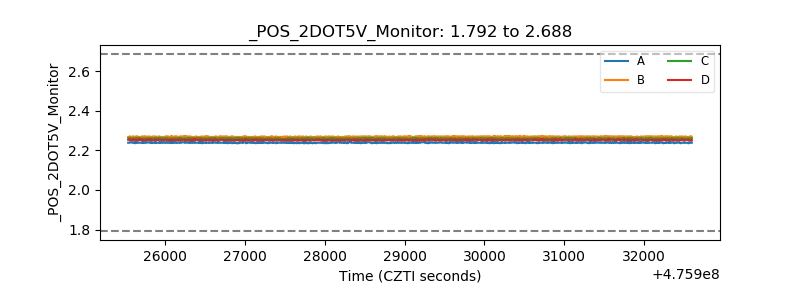 |
| +5 Volts monitor | 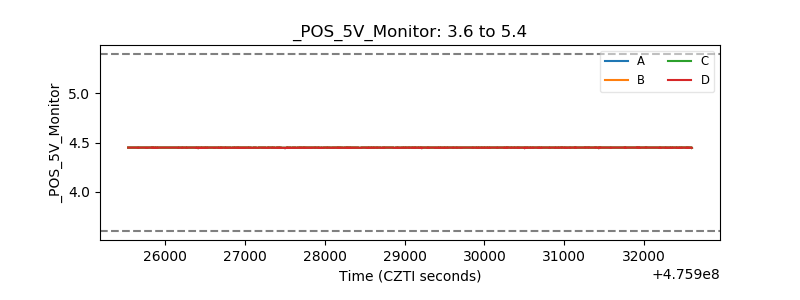 |
| _ROLL_ROT | 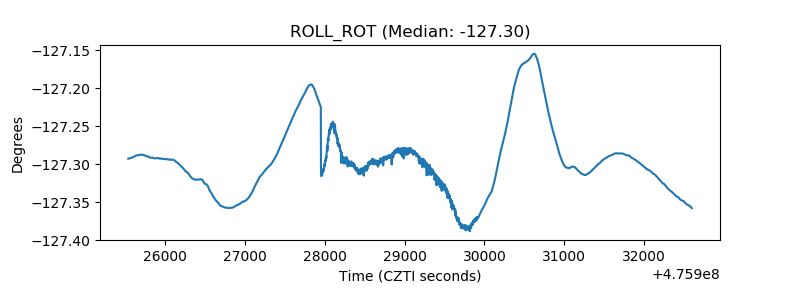 |
| _Roll_DEC | 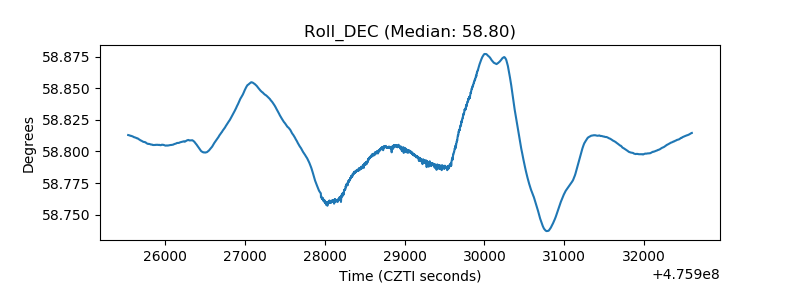 |
| _Roll_RA | 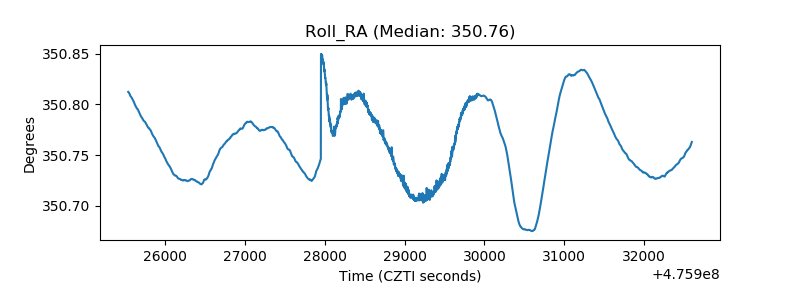 |
| Veto Counter | 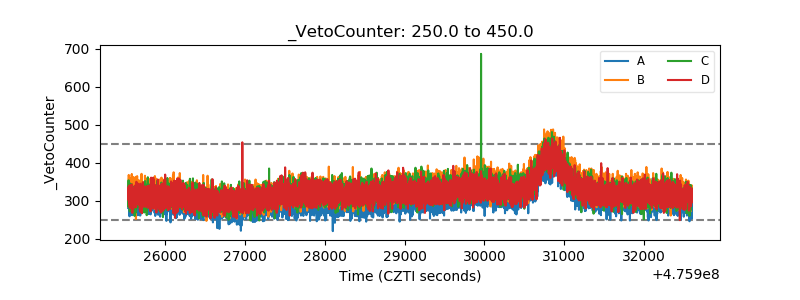 |