| Param | Original file | Final file |
|---|---|---|
| Filename | modeM0/AS1T05_239T01_9000006444_50571cztM0_level2.fits | modeM0/AS1T05_239T01_9000006444_50571cztM0_level2_quad_clean.evt |
| Size (bytes) | 885,741,120 | 88,683,840 |
| Size | 844.7 MB | 84.6 MB |
| Events in quadrant A | 4,315,461 | 666,742 |
| Events in quadrant B | 6,093,089 | 700,331 |
| Events in quadrant C | 13,810,725 | 243,071 |
| Events in quadrant D | 8,003,651 | 566,920 |
| Mode M0 | |||
|---|---|---|---|
| Quadrant | BADHDUFLAG | Total packets | Discarded packets |
| A | 0 | 17603 | 0 |
| B | 0 | 23293 | 0 |
| C | 0 | 46068 | 0 |
| D | 0 | 28865 | 0 |
| Mode SS | |||
|---|---|---|---|
| Quadrant | BADHDUFLAG | Total packets | Discarded packets |
| A | 0 | 146 | 0 |
| B | 0 | 146 | 0 |
| C | 0 | 146 | 0 |
| D | 0 | 146 | 0 |
| Quadrant | Total seconds | Saturated seconds | Saturation percentage |
|---|---|---|---|
| A | 7294 | 127 | 1.741157% |
| B | 7294 | 471 | 6.457362% |
| C | 7295 | 4910 | 67.306374% |
| D | 7295 | 670 | 9.184373% |
Noise dominated data is calculated using 1-second bins in cleaned event files. If a bin has >2000 counts, and if more than 50% of those come from <1% of pixels, then it is considered to be noise-dominated and hence unusable.
| Quadrant | # 1 sec bins | Bins with >0 counts | Bins with >2000 counts | High rate bins dominated by noise | Noise dominated (total time) | Noise dominated (detector-on time) | Marked lightcurve |
|---|---|---|---|---|---|---|---|
| A | 7294 | 7294 | 88 | 88 | 1.21% | 1.21% | 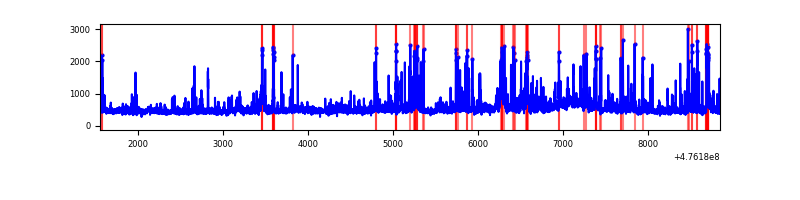 |
| B | 7294 | 7294 | 255 | 255 | 3.50% | 3.50% | 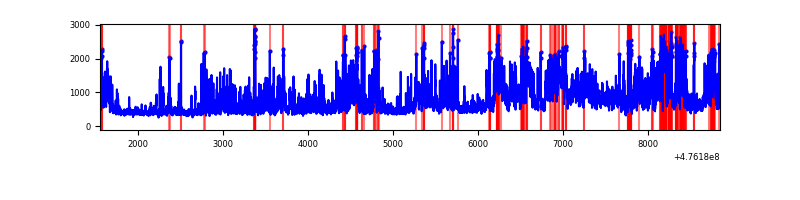 |
| C | 7295 | 7295 | 3969 | 3969 | 54.41% | 54.41% | 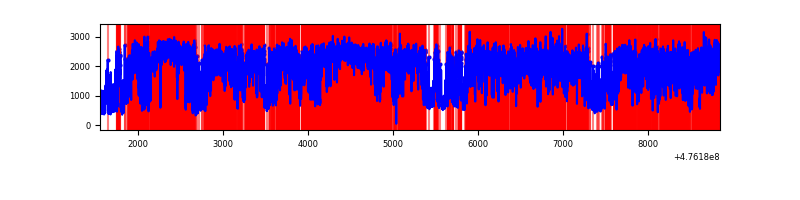 |
| D | 7295 | 7295 | 711 | 711 | 9.75% | 9.75% | 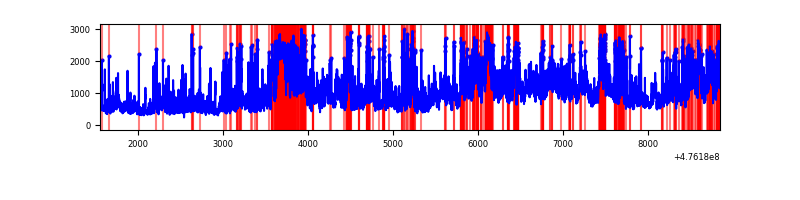 |
Top three noisy pixels from each quadrant. If the there are fewer than three noisy pixels in the level2.evt file, extra rows are filled as -1
| Pixel properties | Quadrant properties | ||||||
|---|---|---|---|---|---|---|---|
| Quadrant | DetID | PixID | Counts | Sigma | Mean | Median | Sigma |
| A | 12 | 250 | 269792 | 1447.39 | 755 | 735 | 185.9 |
| A | 4 | 3 | 242799 | 1302.18 | 755 | 735 | 185.9 |
| A | 11 | 3 | 132863 | 710.78 | 755 | 735 | 185.9 |
| B | 4 | 170 | 1499247 | 9505.89 | 739 | 713 | 157.6 |
| B | 0 | 229 | 574416 | 3639.26 | 739 | 713 | 157.6 |
| B | 7 | 0 | 393036 | 2488.68 | 739 | 713 | 157.6 |
| C | 15 | 214 | 3042669 | 23240.32 | 465 | 462 | 130.9 |
| C | 15 | 196 | 2847713 | 21750.99 | 465 | 462 | 130.9 |
| C | 15 | 236 | 2554118 | 19508.13 | 465 | 462 | 130.9 |
| D | 7 | 61 | 1893260 | 9751.66 | 706 | 685 | 194.1 |
| D | 14 | 67 | 621173 | 3197.12 | 706 | 685 | 194.1 |
| D | 6 | 42 | 407194 | 2094.57 | 706 | 685 | 194.1 |
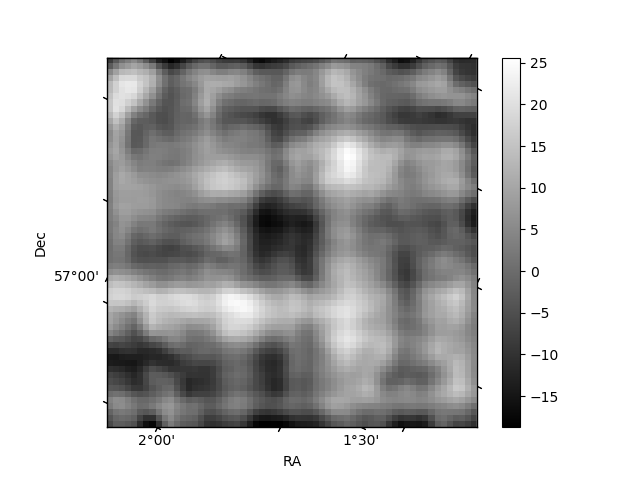
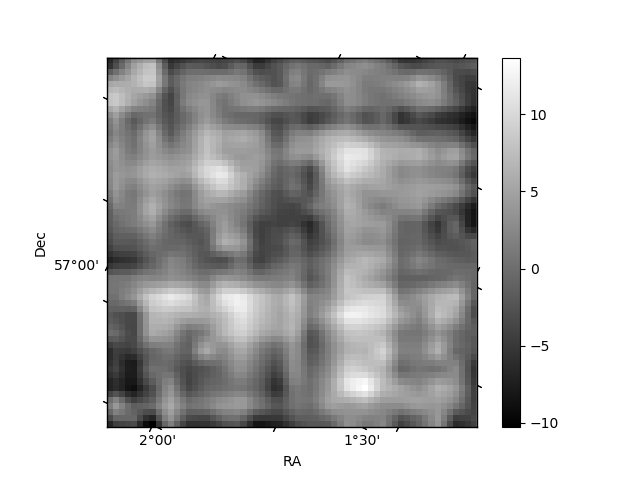
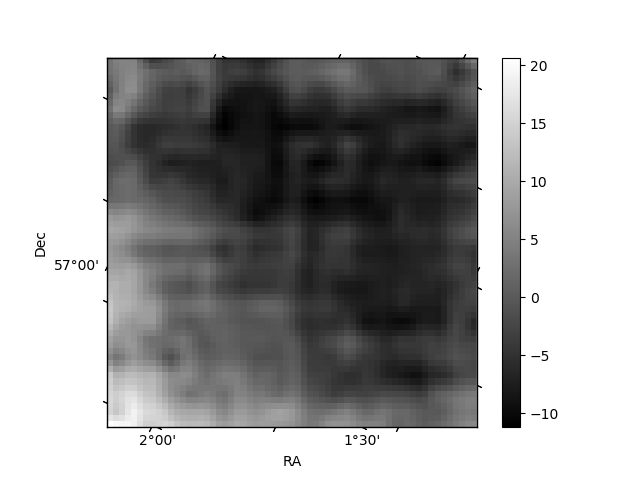
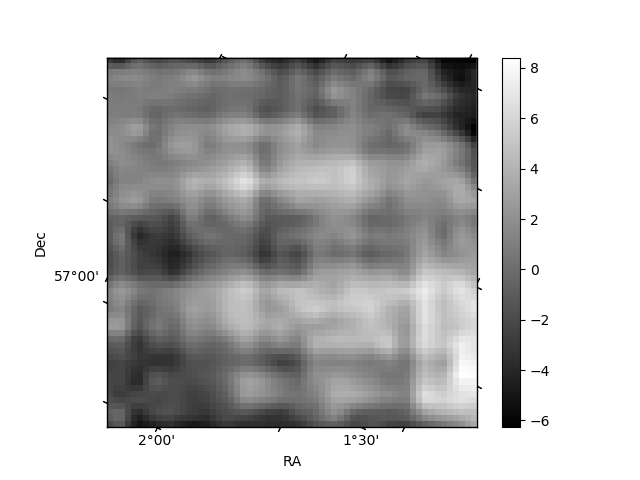
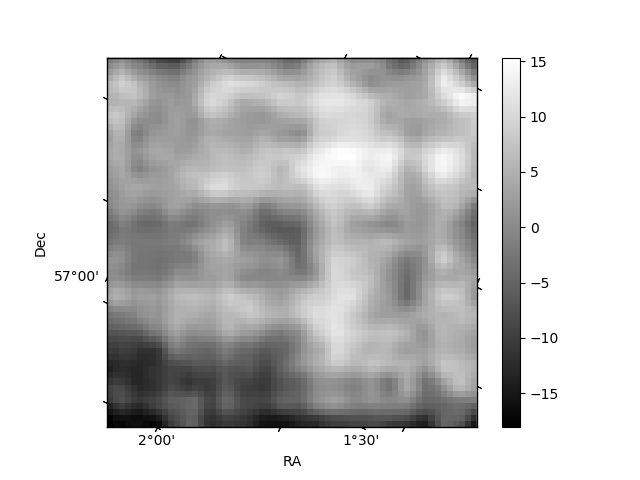
Histogram calculated using DETX and DETY for each event in the final _common_clean file
| Quadrant A | 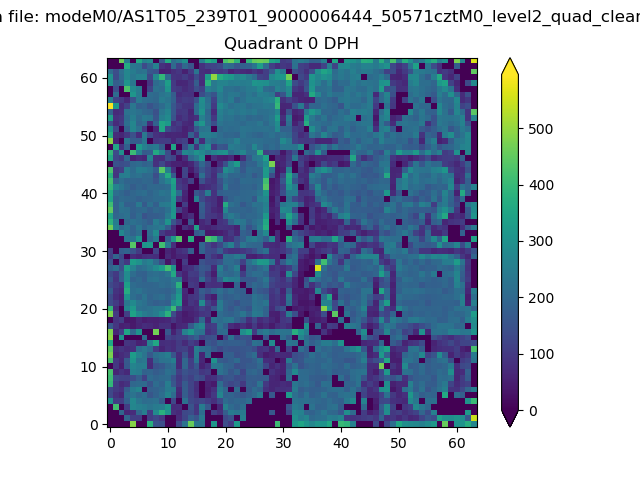 |
 |
Quadrant B |
|---|---|---|---|
| Quadrant D | 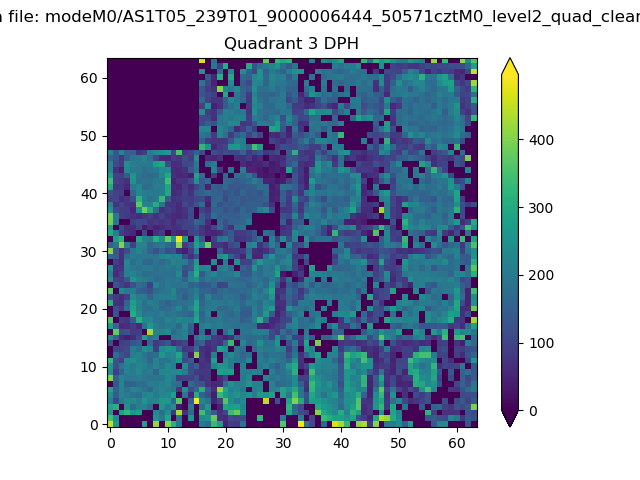 |
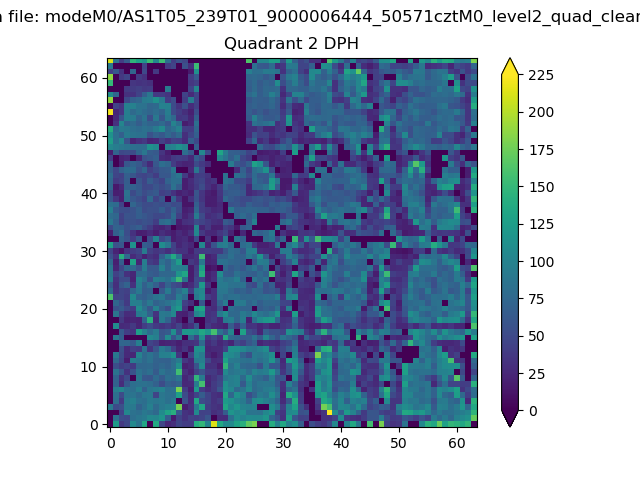 |
Quadrant C |
| Plot type | Count rate plots | Images |
|---|---|---|
| Comparison with Poisson distribution Blue bars denote a histogram of data divided into 1 sec bins. Red curve is a Poisson curve with rate = median count rate of data. |
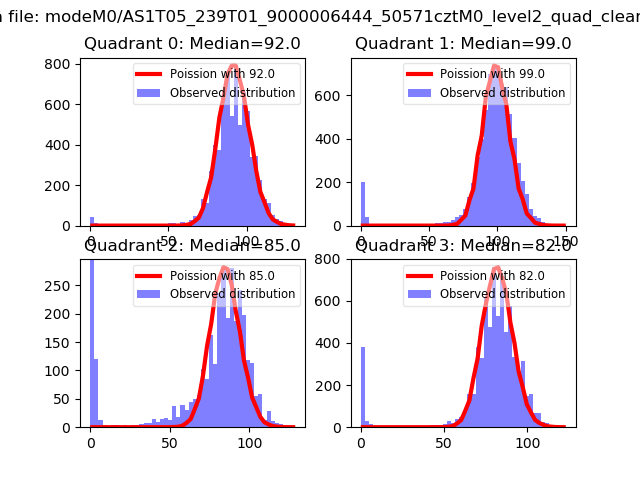 |
 |
| Quadrant-wise count rates Data is divided into 100 sec bins |
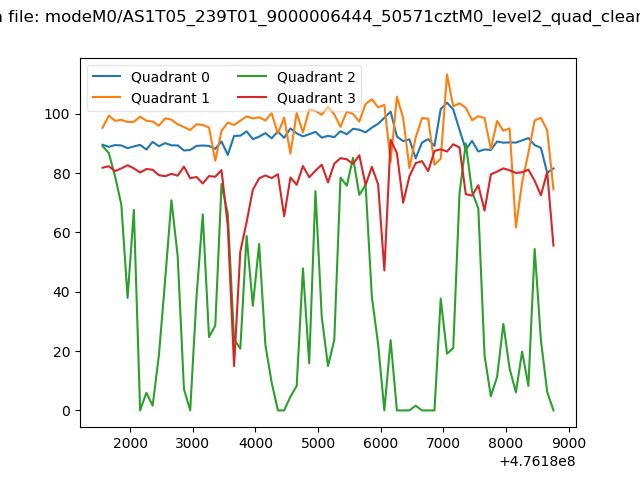 |
|
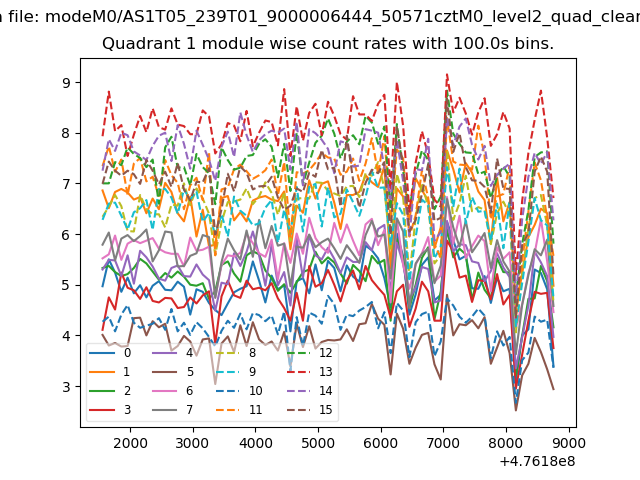
| Module-wise count rates for Quadrant A Data is divided into 100 sec bins |
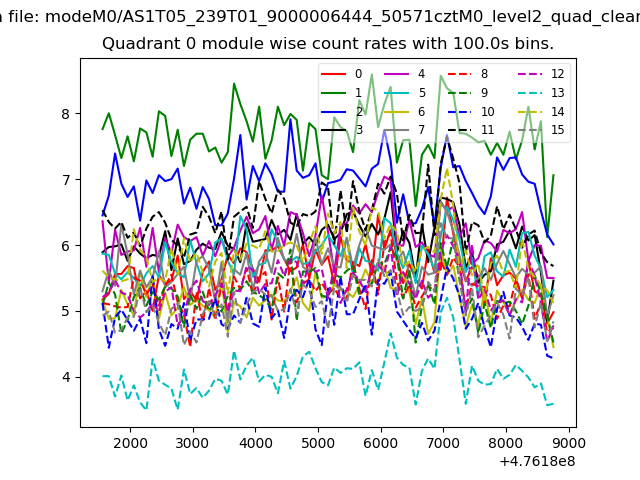 |
 |
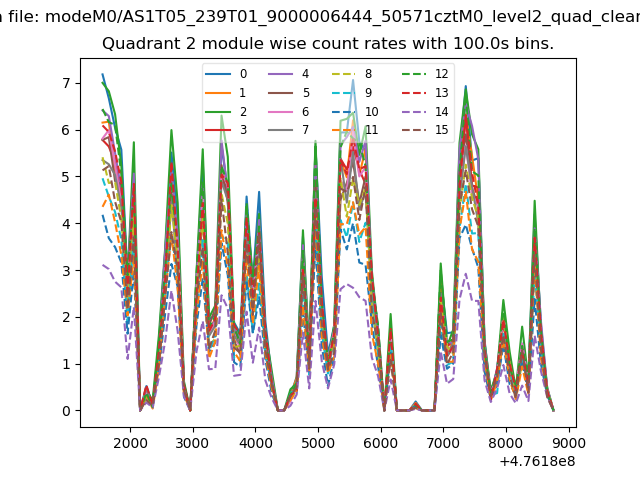
| Module-wise count rates for Quadrant B Data is divided into 100 sec bins |
 |
 |
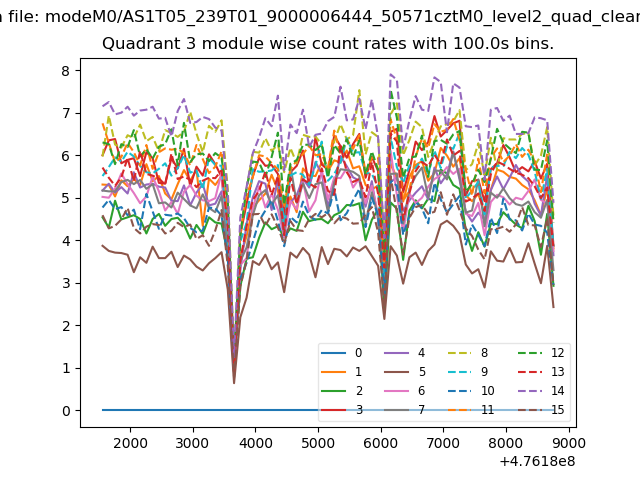
| Module-wise count rates for Quadrant C Data is divided into 100 sec bins |
 |
 |
| Module-wise count rates for Quadrant D Data is divided into 100 sec bins |
 |
 |
| Parameter | Plot |
|---|---|
| CZT HV Monitor | 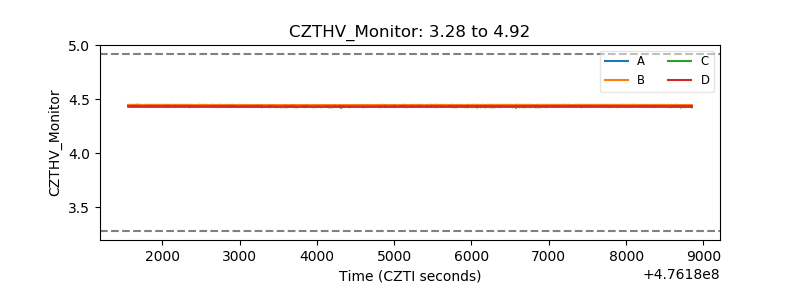 |
| D_VDD | 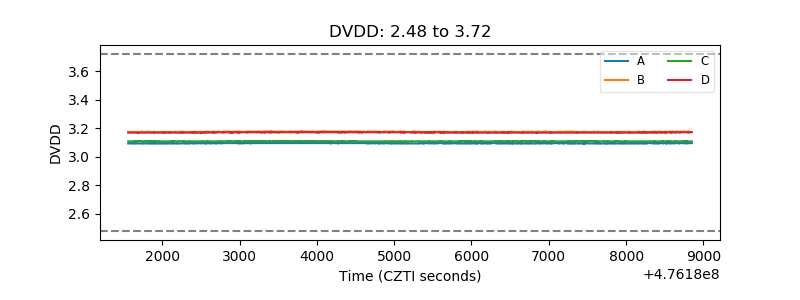 |
| Temperature 1 | 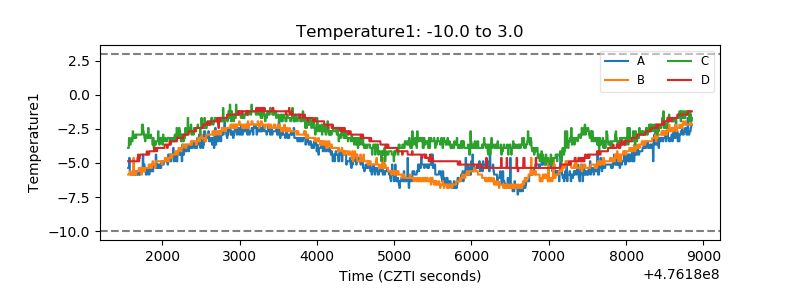 |
| Veto HV Monitor | 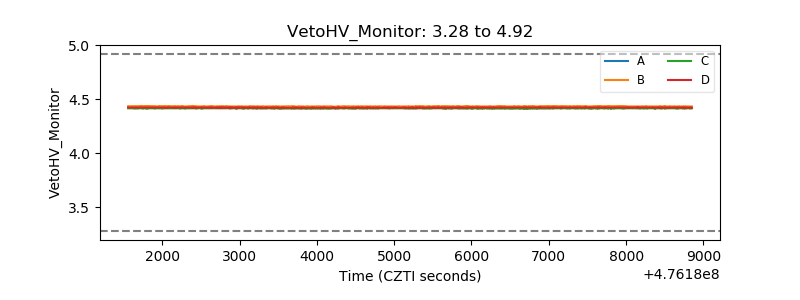 |
| Veto LLD | 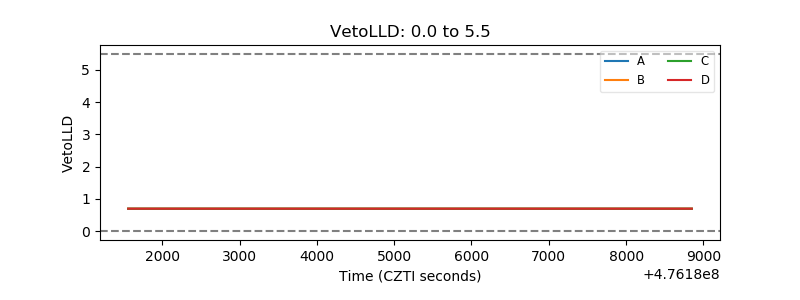 |
| Alpha Counter | 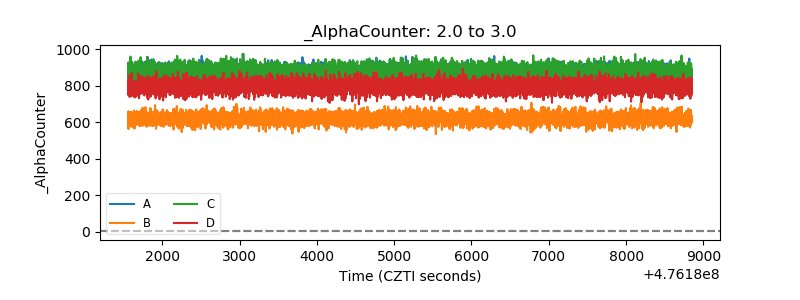 |
| _CPM_Rate | 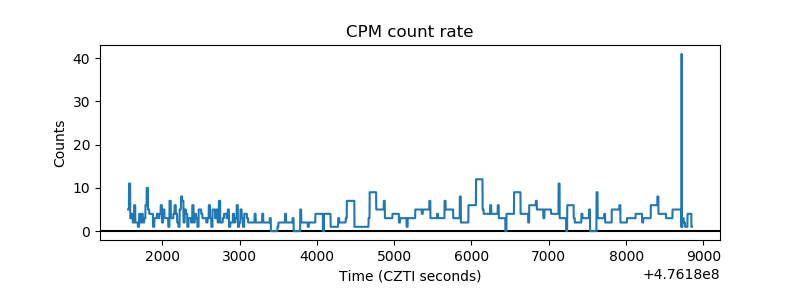 |
| CZT Counter | 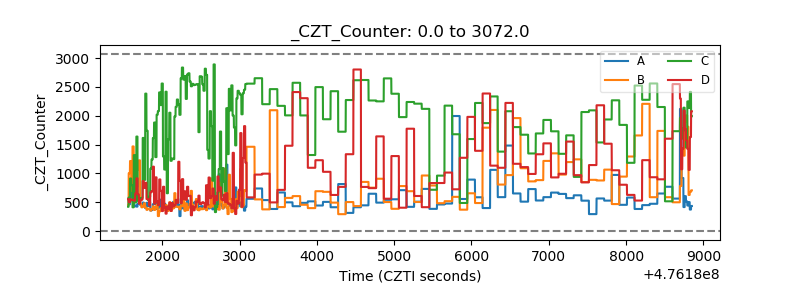 |
| +2.5 Volts monitor | 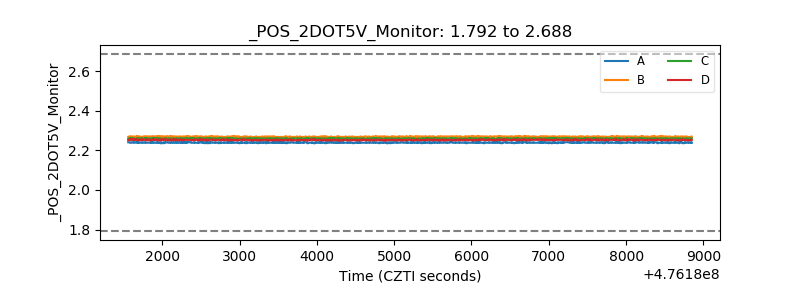 |
| +5 Volts monitor |  |
| _ROLL_ROT | 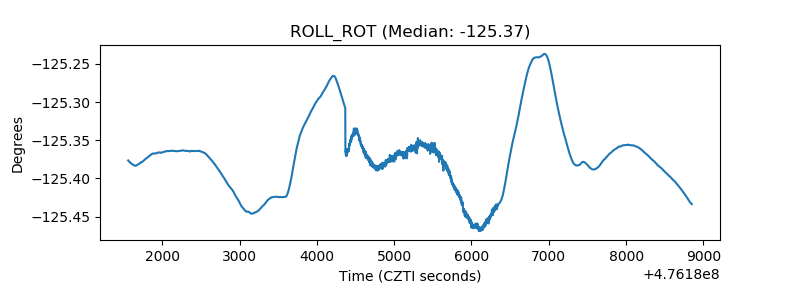 |
| _Roll_DEC | 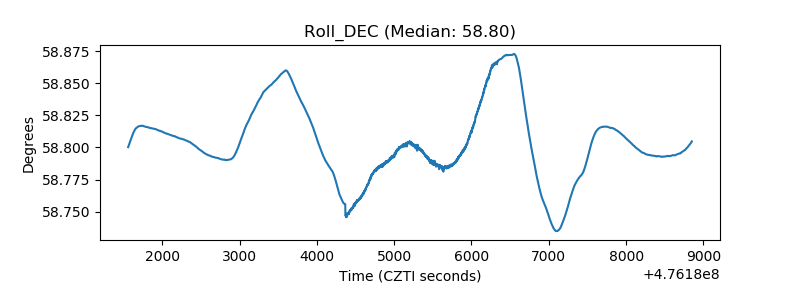 |
| _Roll_RA | 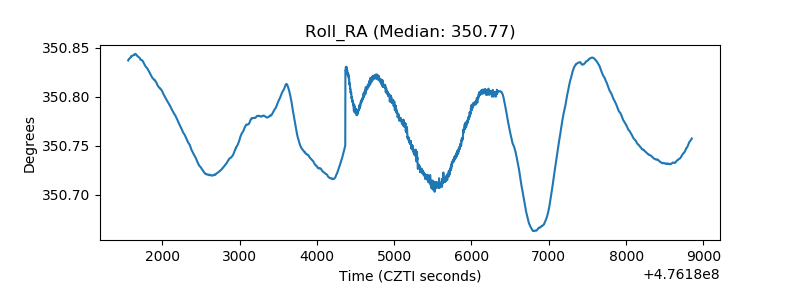 |
| Veto Counter | 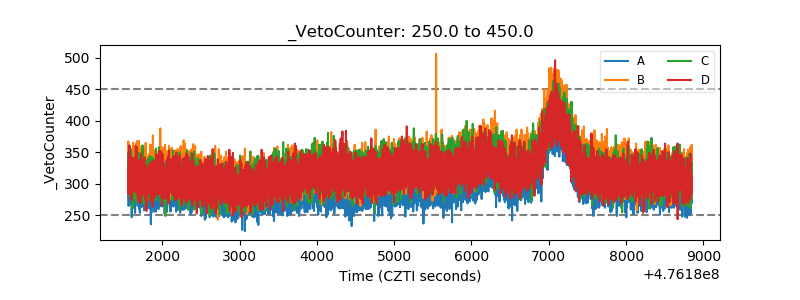 |