| Param | Original file | Final file |
|---|---|---|
| Filename | modeM0/AS1T05_239T01_9000006444_50584cztM0_level2.fits | modeM0/AS1T05_239T01_9000006444_50584cztM0_level2_quad_clean.evt |
| Size (bytes) | 1,863,210,240 | 225,630,720 |
| Size | 1.7 GB | 215.2 MB |
| Events in quadrant A | 10,056,121 | 1,591,743 |
| Events in quadrant B | 17,948,502 | 1,529,958 |
| Events in quadrant C | 24,672,070 | 1,108,476 |
| Events in quadrant D | 14,923,634 | 1,375,688 |
| Mode M0 | |||
|---|---|---|---|
| Quadrant | BADHDUFLAG | Total packets | Discarded packets |
| A | 0 | 41979 | 2 |
| B | 0 | 65793 | 2 |
| C | 0 | 85723 | 4 |
| D | 0 | 57003 | 2 |
| Mode M9 | |||
|---|---|---|---|
| Quadrant | BADHDUFLAG | Total packets | Discarded packets |
| A | 0 | 15 | 0 |
| B | 0 | 15 | 0 |
| C | 0 | 15 | 0 |
| D | 0 | 15 | 0 |
| Mode SS | |||
|---|---|---|---|
| Quadrant | BADHDUFLAG | Total packets | Discarded packets |
| A | 0 | 360 | 0 |
| B | 0 | 360 | 0 |
| C | 0 | 360 | 0 |
| D | 0 | 360 | 0 |
| Quadrant | Total seconds | Saturated seconds | Saturation percentage |
|---|---|---|---|
| A | 17765 | 567 | 3.191669% |
| B | 17765 | 2700 | 15.198424% |
| C | 17764 | 5586 | 31.445620% |
| D | 17764 | 1422 | 8.004954% |
Noise dominated data is calculated using 1-second bins in cleaned event files. If a bin has >2000 counts, and if more than 50% of those come from <1% of pixels, then it is considered to be noise-dominated and hence unusable.
| Quadrant | # 1 sec bins | Bins with >0 counts | Bins with >2000 counts | High rate bins dominated by noise | Noise dominated (total time) | Noise dominated (detector-on time) | Marked lightcurve |
|---|---|---|---|---|---|---|---|
| A | 19300 | 17768 | 214 | 214 | 1.11% | 1.20% | 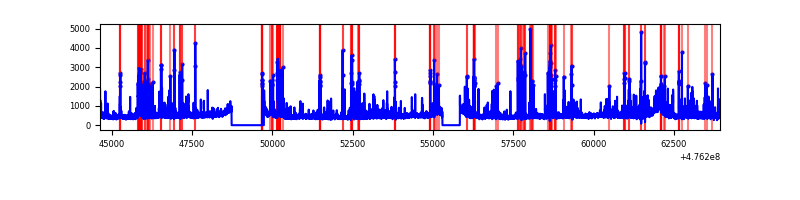 |
| B | 19300 | 17768 | 1687 | 1687 | 8.74% | 9.49% | 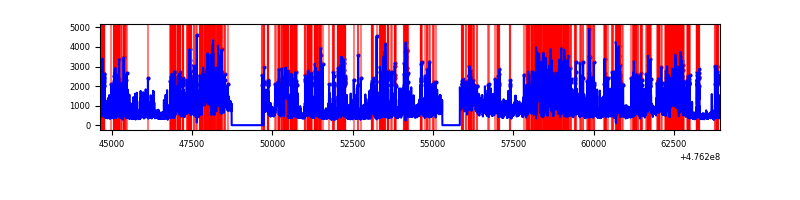 |
| C | 19299 | 17766 | 4752 | 4752 | 24.62% | 26.75% | 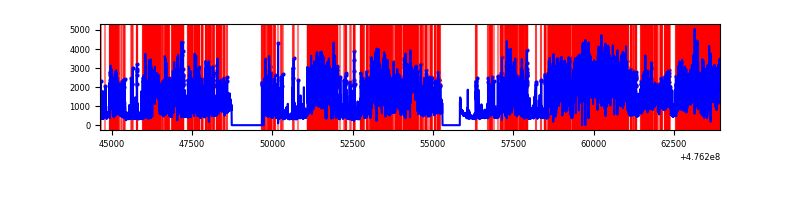 |
| D | 19299 | 17767 | 1102 | 1102 | 5.71% | 6.20% | 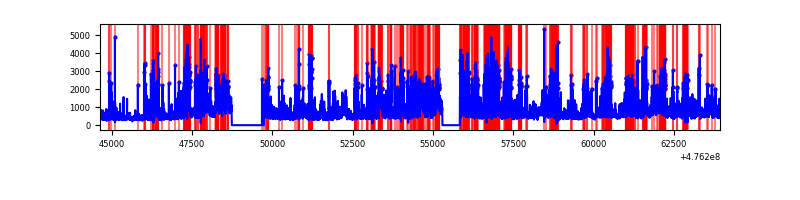 |
Top three noisy pixels from each quadrant. If the there are fewer than three noisy pixels in the level2.evt file, extra rows are filled as -1
| Pixel properties | Quadrant properties | ||||||
|---|---|---|---|---|---|---|---|
| Quadrant | DetID | PixID | Counts | Sigma | Mean | Median | Sigma |
| A | 4 | 3 | 652431 | 1411.68 | 1857 | 1810 | 460.9 |
| A | 12 | 250 | 364048 | 785.96 | 1857 | 1810 | 460.9 |
| A | 4 | 249 | 315246 | 680.07 | 1857 | 1810 | 460.9 |
| B | 4 | 170 | 4654145 | 12476.83 | 1762 | 1698 | 372.9 |
| B | 7 | 0 | 2183701 | 5851.65 | 1762 | 1698 | 372.9 |
| B | 5 | 172 | 1457752 | 3904.81 | 1762 | 1698 | 372.9 |
| C | 15 | 196 | 9247748 | 20824.74 | 1585 | 1574 | 444.0 |
| C | 15 | 195 | 3742485 | 8425.49 | 1585 | 1574 | 444.0 |
| C | 15 | 157 | 1383697 | 3112.89 | 1585 | 1574 | 444.0 |
| D | 8 | 48 | 1321211 | 2697.72 | 1757 | 1694 | 489.1 |
| D | 2 | 249 | 1223085 | 2497.11 | 1757 | 1694 | 489.1 |
| D | 1 | 7 | 1201018 | 2451.99 | 1757 | 1694 | 489.1 |
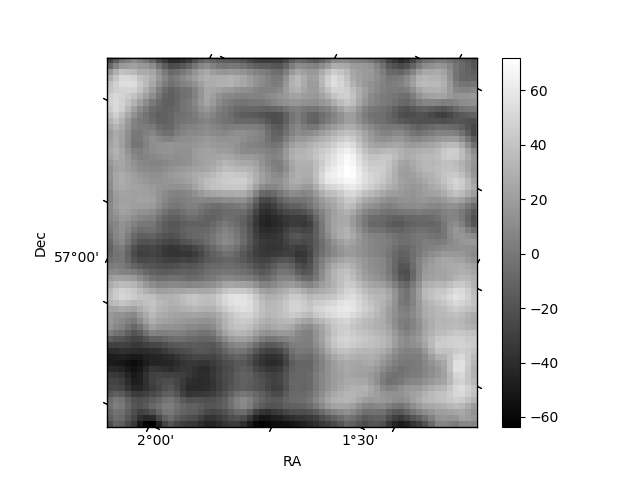
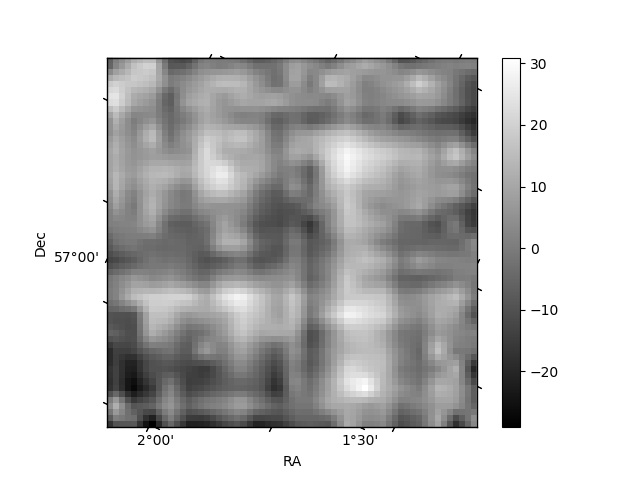
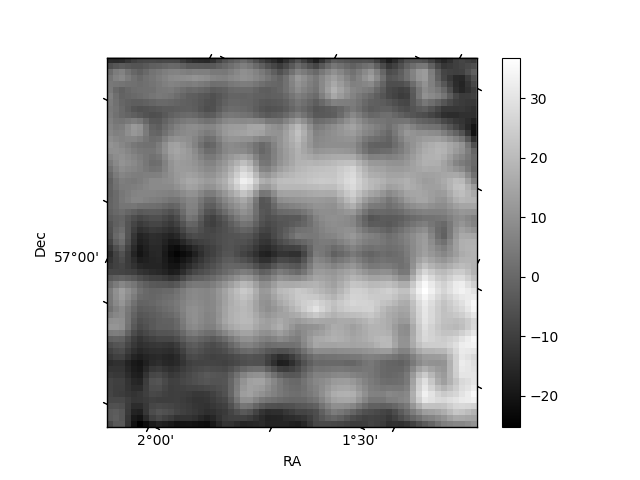
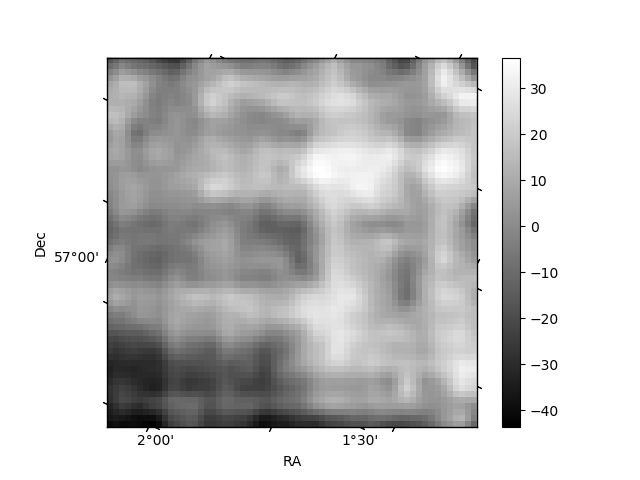
Histogram calculated using DETX and DETY for each event in the final _common_clean file
| Quadrant A | 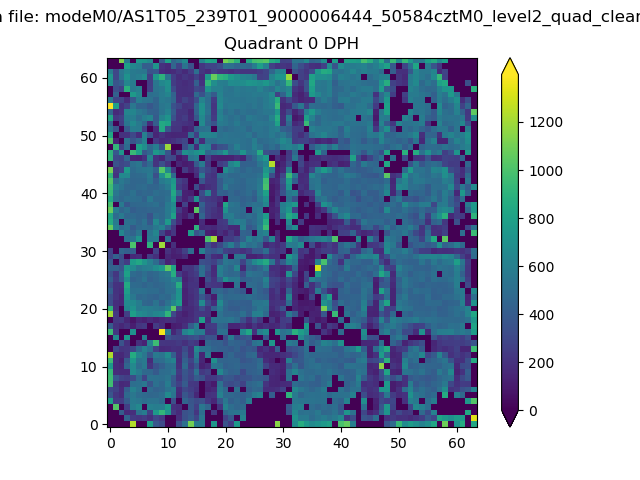 |
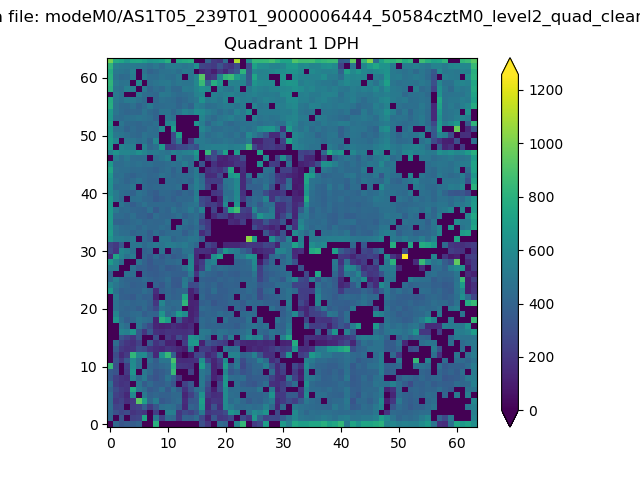 |
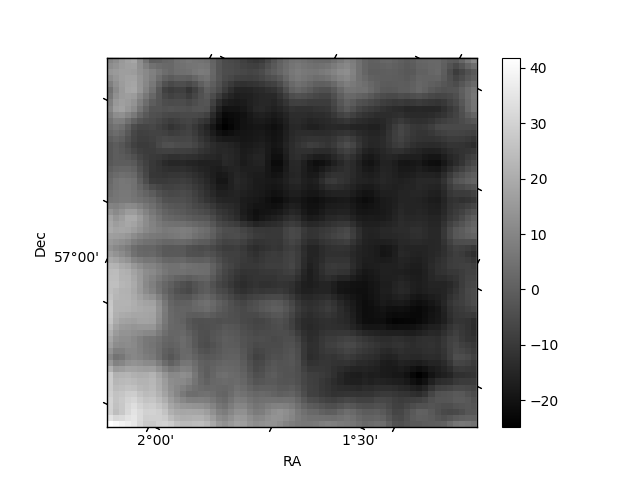
Quadrant B |
|---|---|---|---|
| Quadrant D | 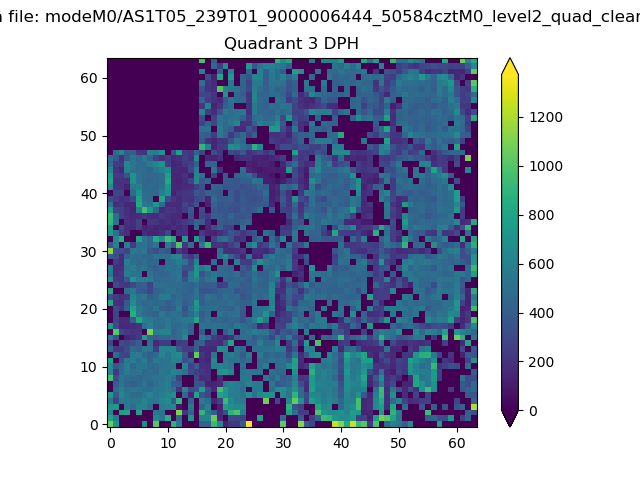 |
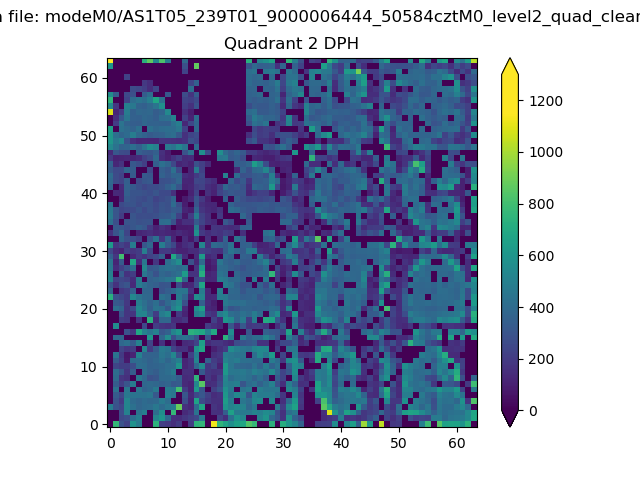 |
Quadrant C |
| Plot type | Count rate plots | Images |
|---|---|---|
| Comparison with Poisson distribution Blue bars denote a histogram of data divided into 1 sec bins. Red curve is a Poisson curve with rate = median count rate of data. |
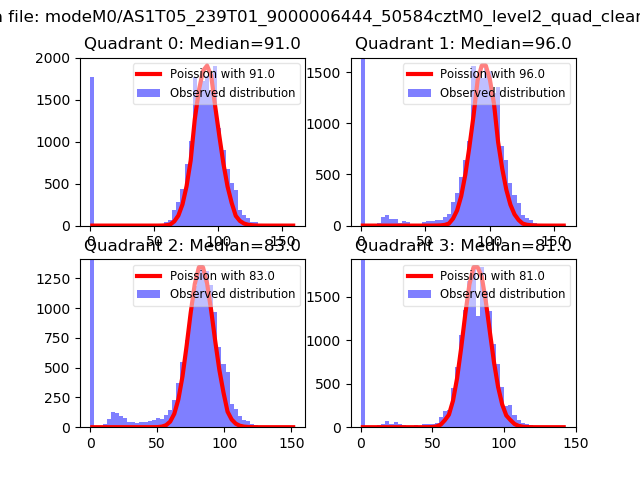 |
 |
| Quadrant-wise count rates Data is divided into 100 sec bins |
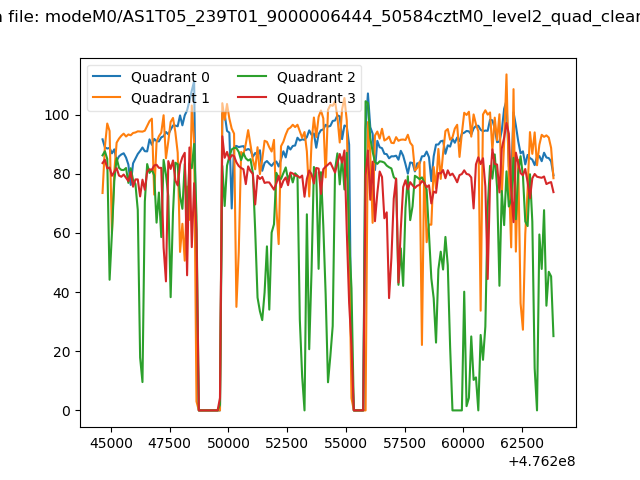 |
|
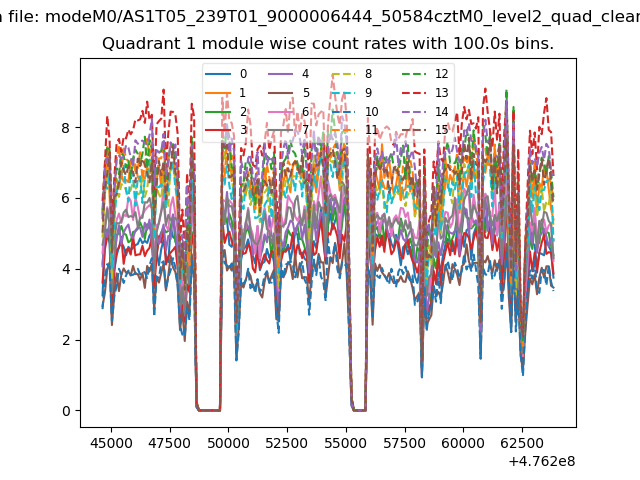
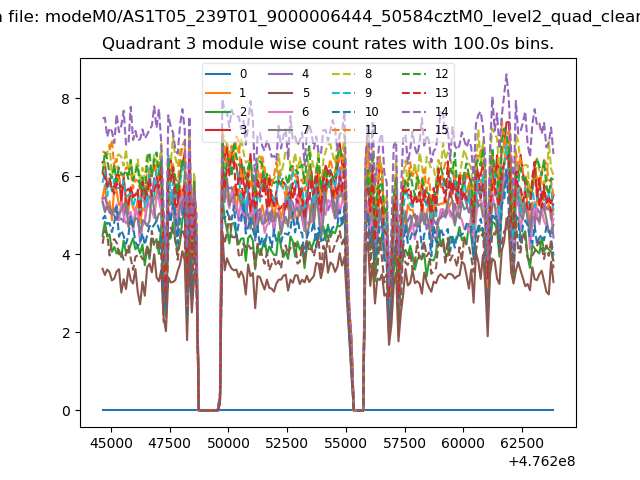
| Module-wise count rates for Quadrant A Data is divided into 100 sec bins |
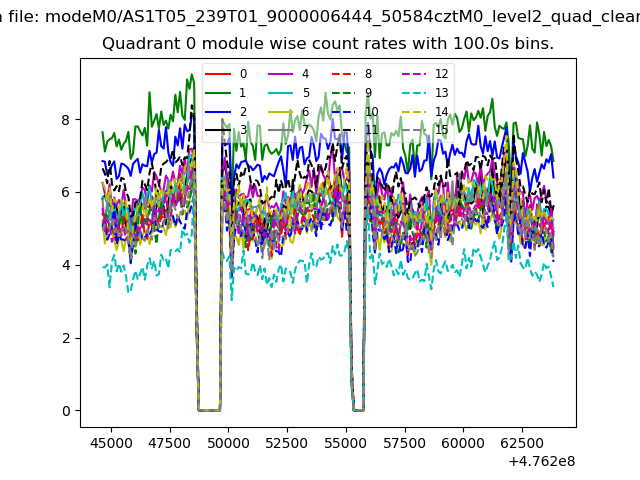 |
 |
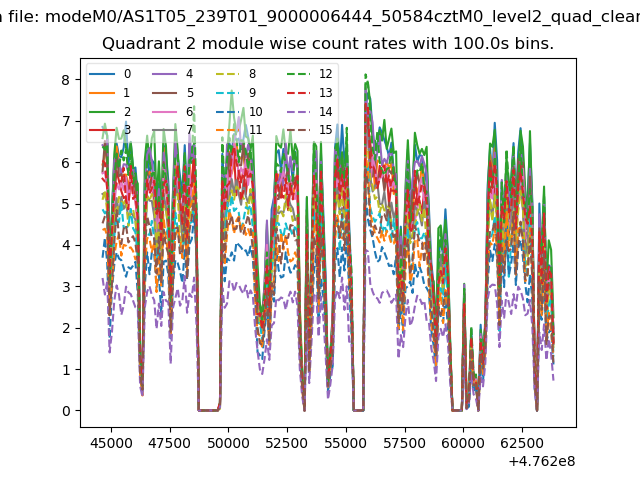
| Module-wise count rates for Quadrant B Data is divided into 100 sec bins |
 |
 |
| Module-wise count rates for Quadrant C Data is divided into 100 sec bins |
 |
 |
| Module-wise count rates for Quadrant D Data is divided into 100 sec bins |
 |
 |
| Parameter | Plot |
|---|---|
| CZT HV Monitor | 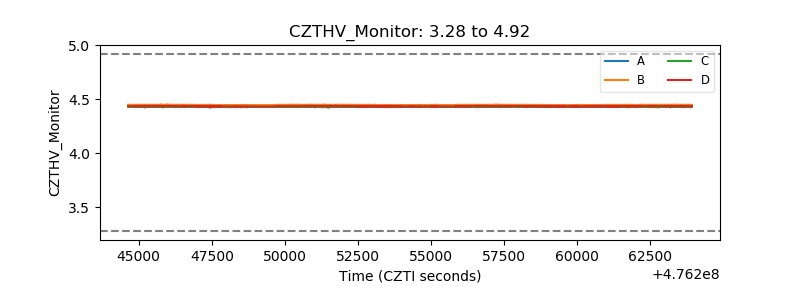 |
| D_VDD | 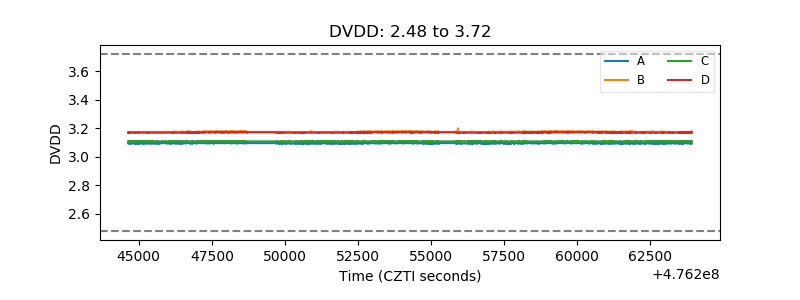 |
| Temperature 1 | 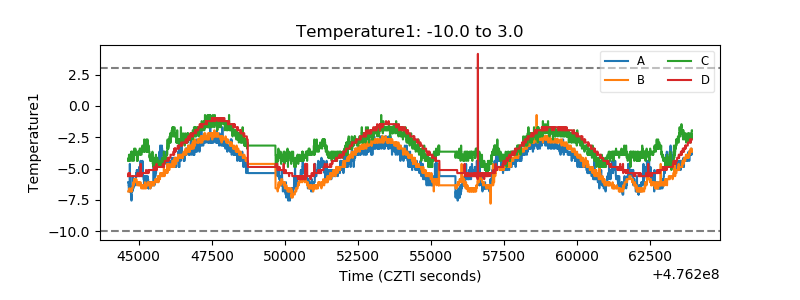 |
| Veto HV Monitor | 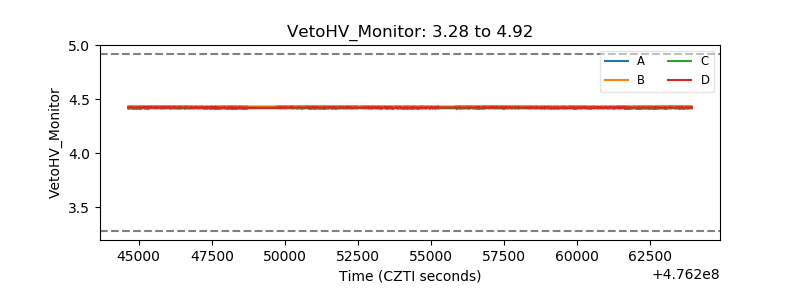 |
| Veto LLD | 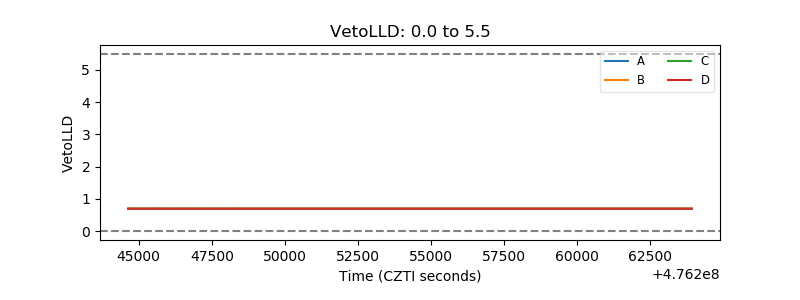 |
| Alpha Counter | 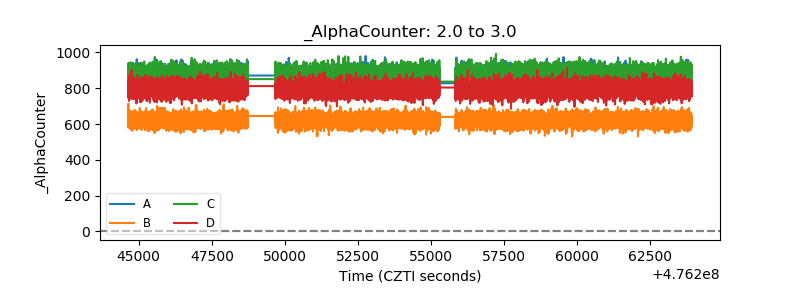 |
| _CPM_Rate | 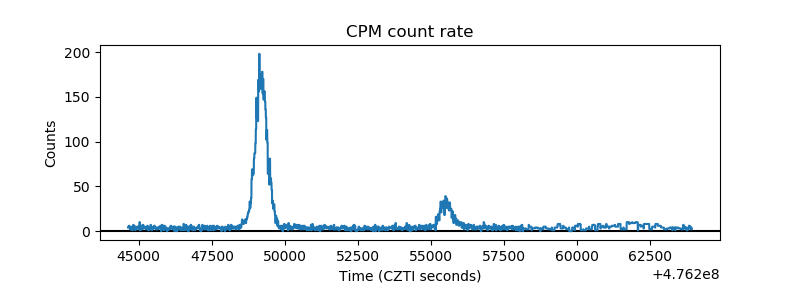 |
| CZT Counter | 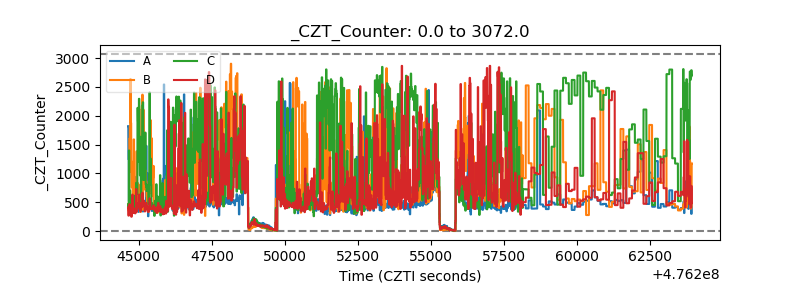 |
| +2.5 Volts monitor | 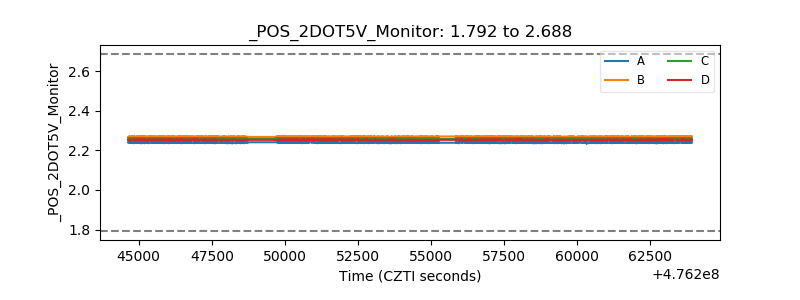 |
| +5 Volts monitor | 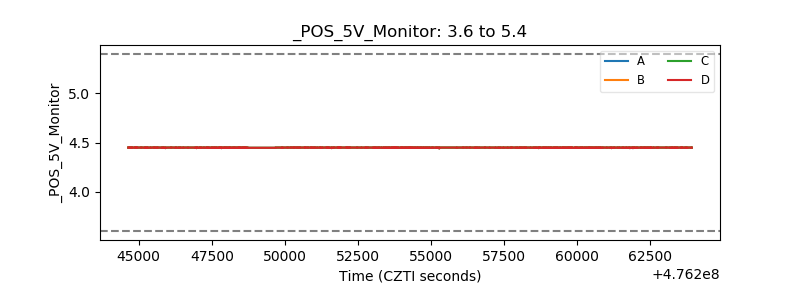 |
| _ROLL_ROT | 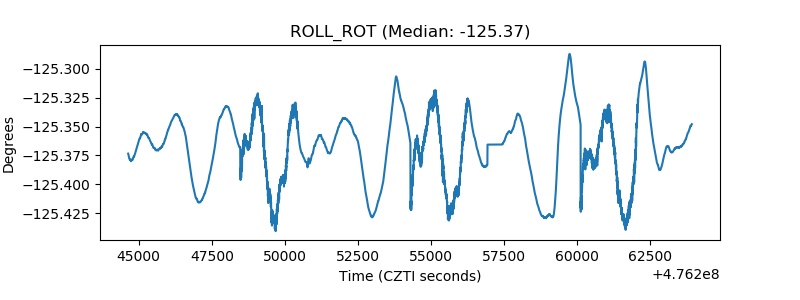 |
| _Roll_DEC | 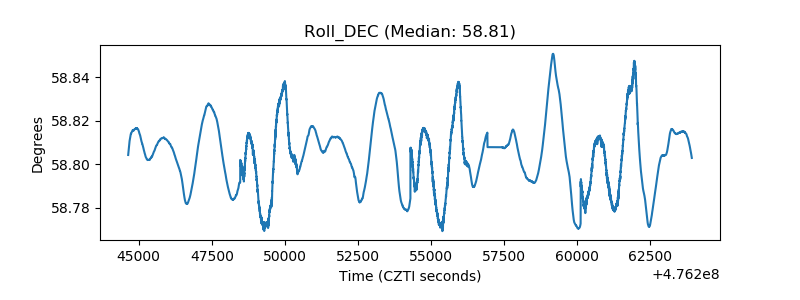 |
| _Roll_RA | 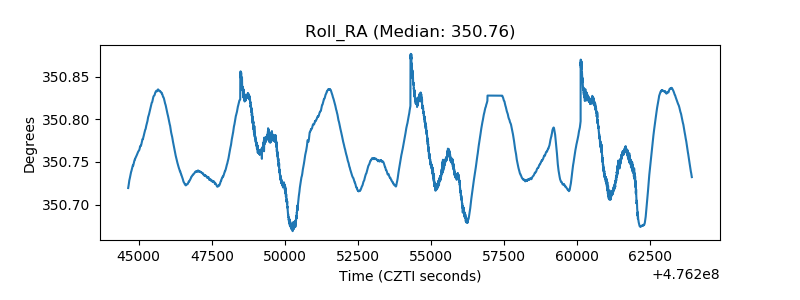 |
| Veto Counter | 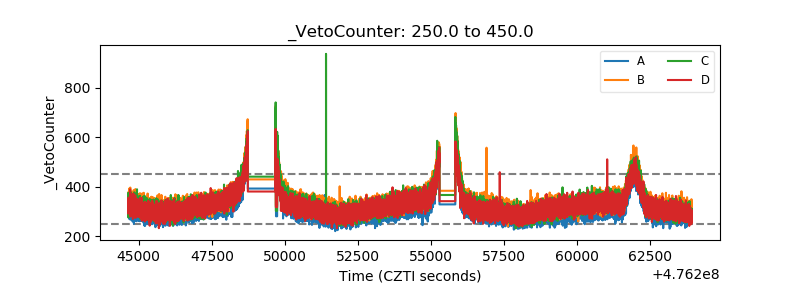 |