| Param | Original file | Final file |
|---|---|---|
| Filename | modeM0/AS1T05_239T01_9000006444_50628cztM0_level2.fits | modeM0/AS1T05_239T01_9000006444_50628cztM0_level2_quad_clean.evt |
| Size (bytes) | 708,819,840 | 92,471,040 |
| Size | 676.0 MB | 88.2 MB |
| Events in quadrant A | 4,440,917 | 630,068 |
| Events in quadrant B | 8,900,739 | 550,582 |
| Events in quadrant C | 6,304,769 | 569,010 |
| Events in quadrant D | 6,045,054 | 558,345 |
| Mode M0 | |||
|---|---|---|---|
| Quadrant | BADHDUFLAG | Total packets | Discarded packets |
| A | 0 | 18136 | 201 |
| B | 0 | 31609 | 236 |
| C | 0 | 24096 | 117 |
| D | 0 | 23104 | 95 |
| Mode SS | |||
|---|---|---|---|
| Quadrant | BADHDUFLAG | Total packets | Discarded packets |
| A | 0 | 142 | 0 |
| B | 0 | 142 | 0 |
| C | 0 | 142 | 2 |
| D | 0 | 142 | 2 |
| Quadrant | Total seconds | Saturated seconds | Saturation percentage |
|---|---|---|---|
| A | 7054 | 282 | 3.997732% |
| B | 7059 | 1839 | 26.051849% |
| C | 7058 | 944 | 13.374894% |
| D | 7067 | 542 | 7.669450% |
Noise dominated data is calculated using 1-second bins in cleaned event files. If a bin has >2000 counts, and if more than 50% of those come from <1% of pixels, then it is considered to be noise-dominated and hence unusable.
| Quadrant | # 1 sec bins | Bins with >0 counts | Bins with >2000 counts | High rate bins dominated by noise | Noise dominated (total time) | Noise dominated (detector-on time) | Marked lightcurve |
|---|---|---|---|---|---|---|---|
| A | 7110 | 7076 | 167 | 167 | 2.35% | 2.36% | 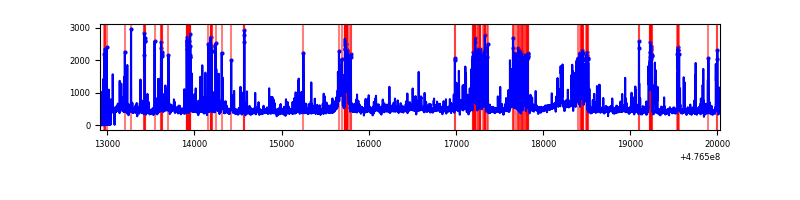 |
| B | 7077 | 7072 | 1430 | 1430 | 20.21% | 20.22% | 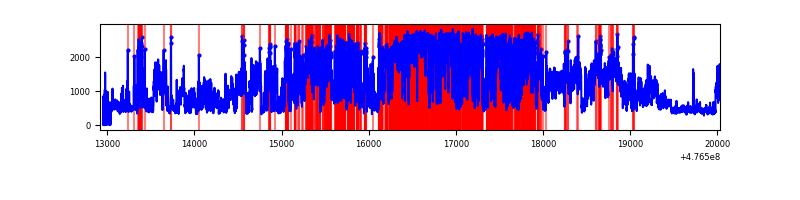 |
| C | 7088 | 7077 | 834 | 834 | 11.77% | 11.78% | 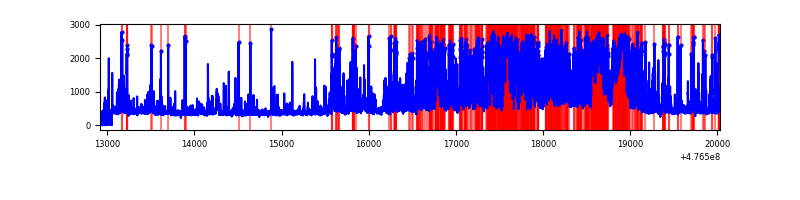 |
| D | 7111 | 7083 | 643 | 643 | 9.04% | 9.08% | 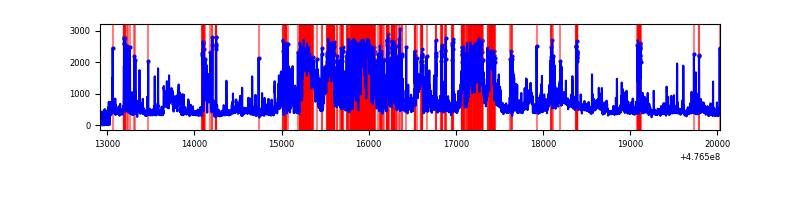 |
Top three noisy pixels from each quadrant. If the there are fewer than three noisy pixels in the level2.evt file, extra rows are filled as -1
| Pixel properties | Quadrant properties | ||||||
|---|---|---|---|---|---|---|---|
| Quadrant | DetID | PixID | Counts | Sigma | Mean | Median | Sigma |
| A | 12 | 250 | 618846 | 3464.01 | 722 | 702 | 178.4 |
| A | 3 | 114 | 175264 | 978.23 | 722 | 702 | 178.4 |
| A | 4 | 3 | 170510 | 951.59 | 722 | 702 | 178.4 |
| B | 4 | 170 | 5397163 | 38204.25 | 663 | 641 | 141.3 |
| B | 5 | 185 | 213131 | 1504.31 | 663 | 641 | 141.3 |
| B | 6 | 51 | 123611 | 870.56 | 663 | 641 | 141.3 |
| C | 15 | 174 | 1812539 | 9710.69 | 680 | 675 | 186.6 |
| C | 4 | 12 | 536433 | 2871.4 | 680 | 675 | 186.6 |
| C | 15 | 199 | 331076 | 1770.78 | 680 | 675 | 186.6 |
| D | 8 | 246 | 1383702 | 7206.48 | 690 | 667 | 191.9 |
| D | 15 | 108 | 550488 | 2864.91 | 690 | 667 | 191.9 |
| D | 5 | 32 | 186841 | 970.08 | 690 | 667 | 191.9 |
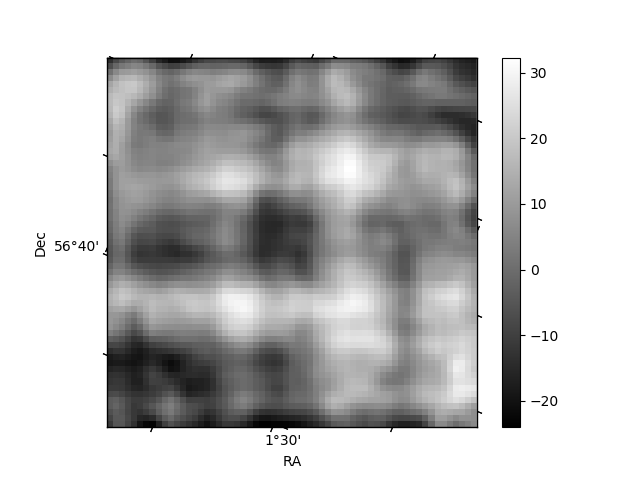
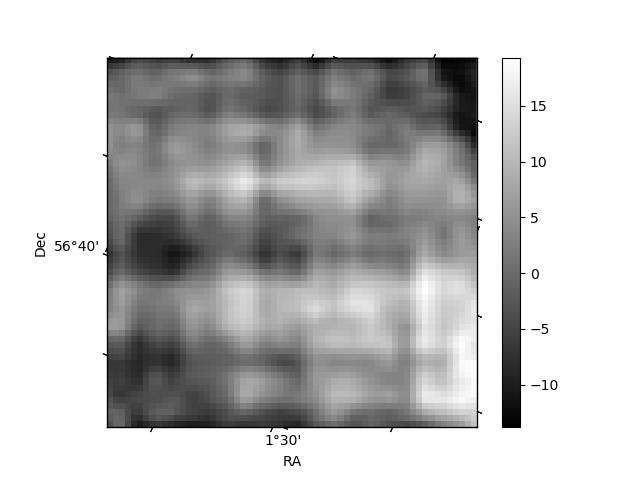
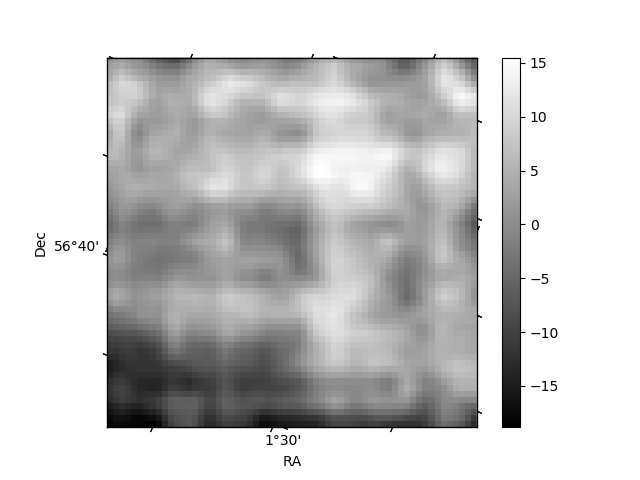
Histogram calculated using DETX and DETY for each event in the final _common_clean file
| Quadrant A | 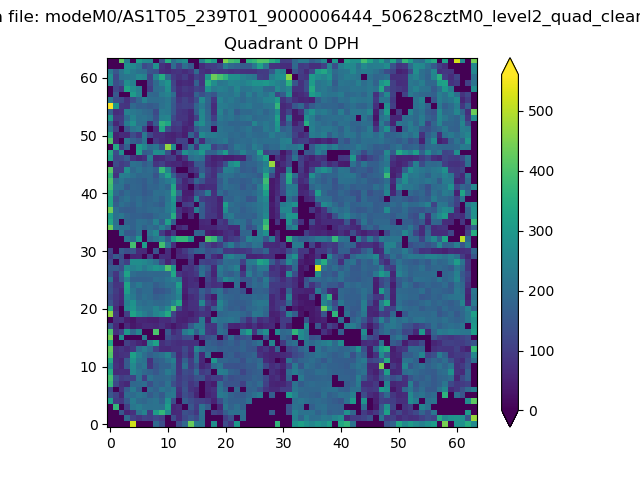 |
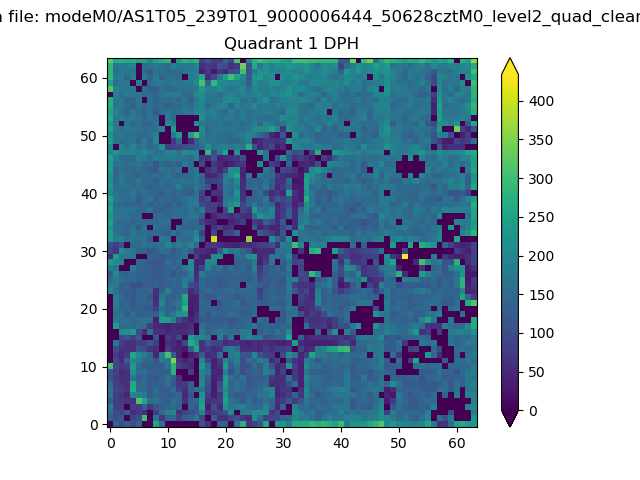 |
Quadrant B |
|---|---|---|---|
| Quadrant D | 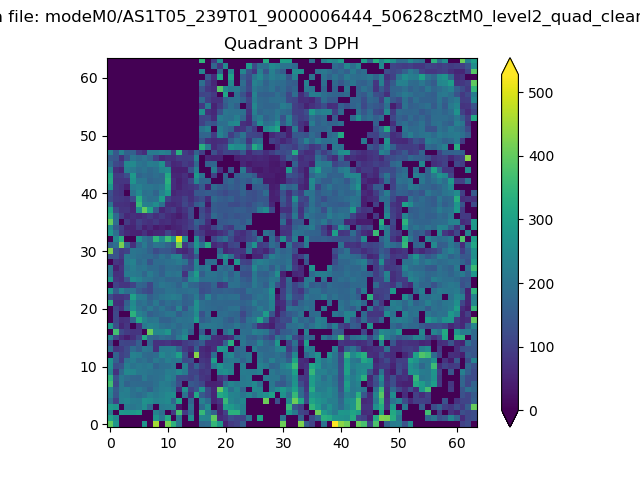 |
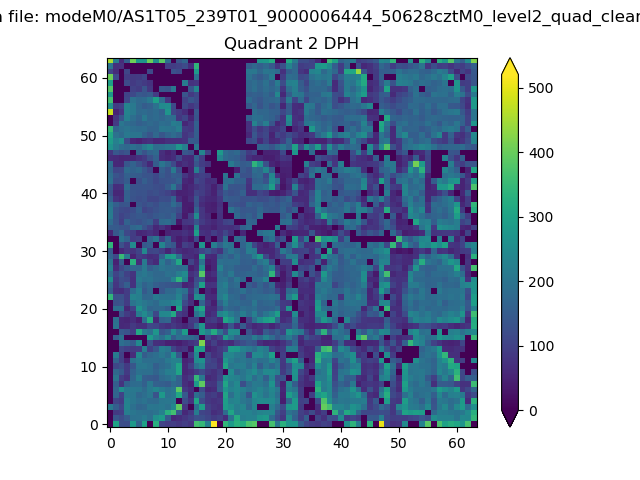 |
Quadrant C |
| Plot type | Count rate plots | Images |
|---|---|---|
| Comparison with Poisson distribution Blue bars denote a histogram of data divided into 1 sec bins. Red curve is a Poisson curve with rate = median count rate of data. |
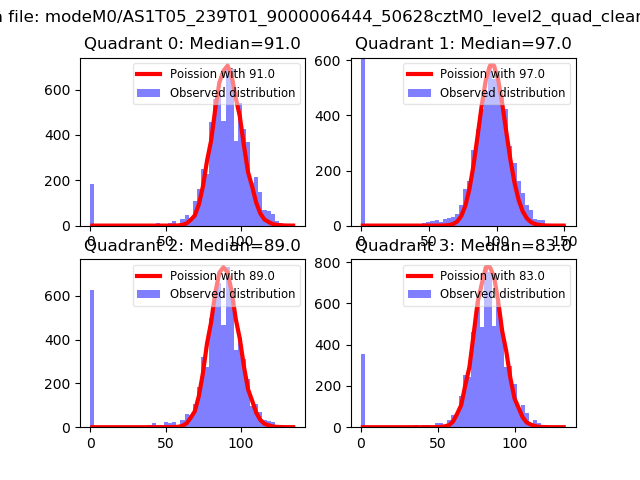 |
 |
| Quadrant-wise count rates Data is divided into 100 sec bins |
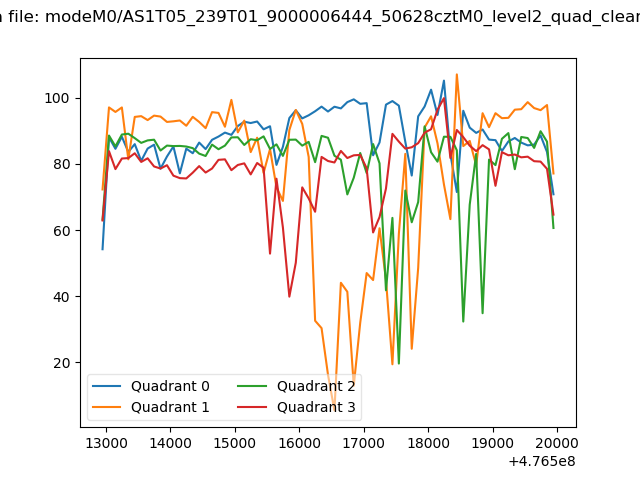 |
|
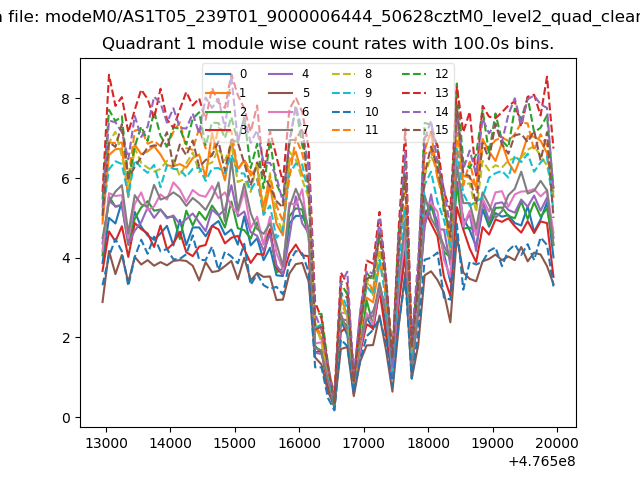
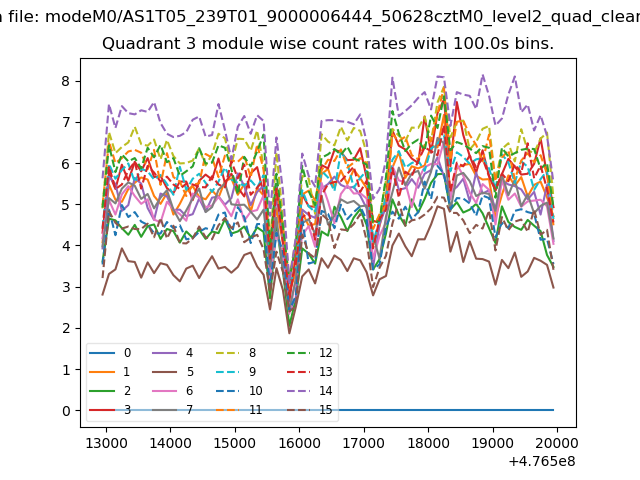
| Module-wise count rates for Quadrant A Data is divided into 100 sec bins |
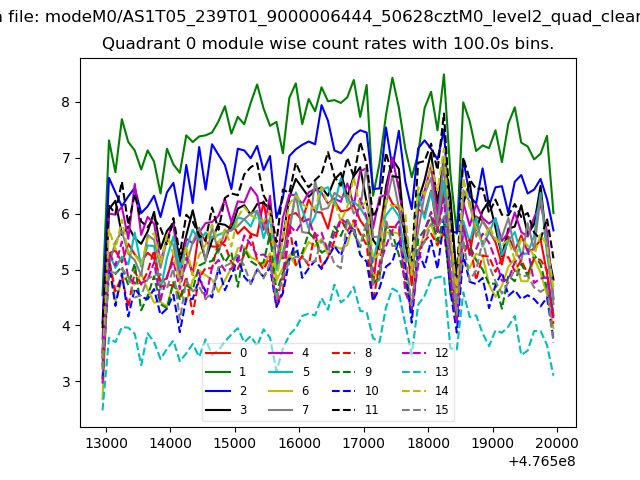 |
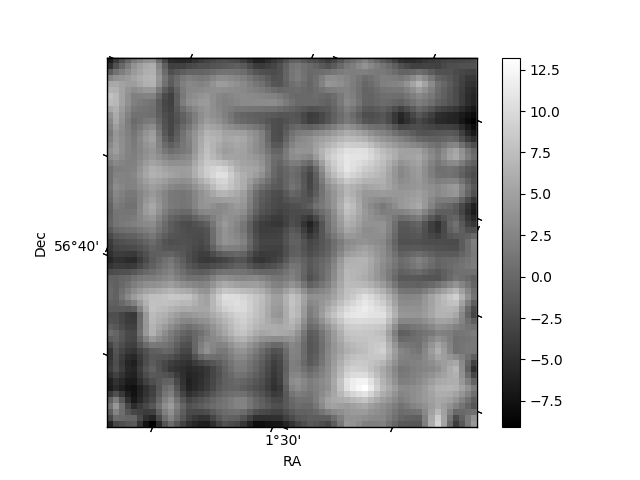 |
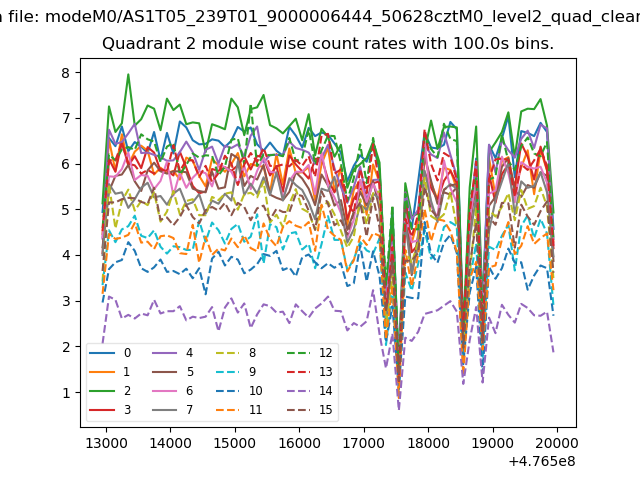
| Module-wise count rates for Quadrant B Data is divided into 100 sec bins |
 |
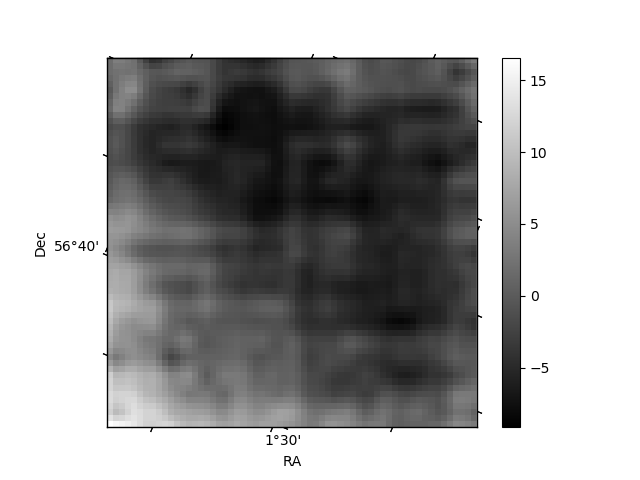 |
| Module-wise count rates for Quadrant C Data is divided into 100 sec bins |
 |
 |
| Module-wise count rates for Quadrant D Data is divided into 100 sec bins |
 |
 |
| Parameter | Plot |
|---|---|
| CZT HV Monitor | 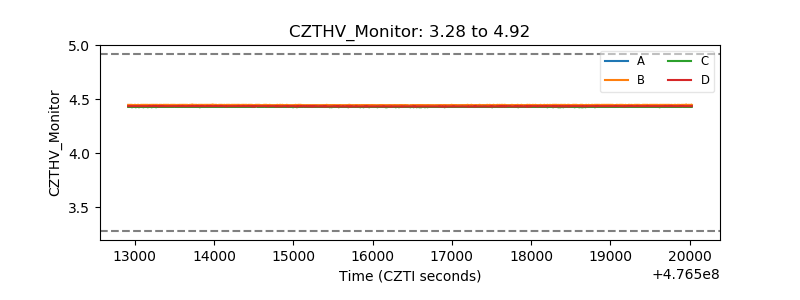 |
| D_VDD | 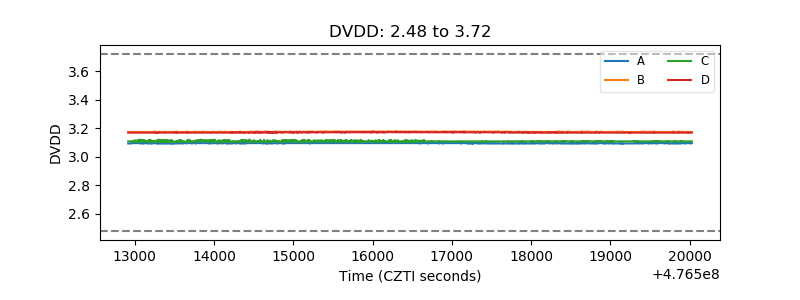 |
| Temperature 1 | 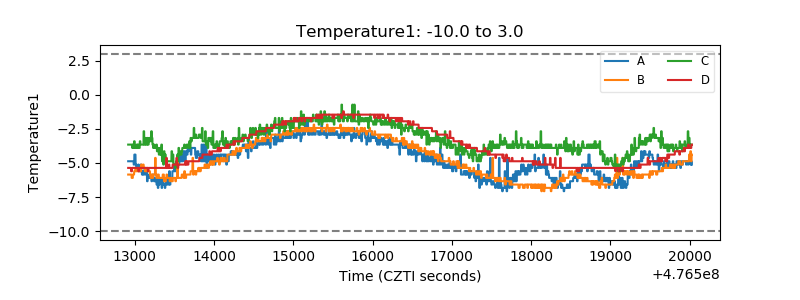 |
| Veto HV Monitor | 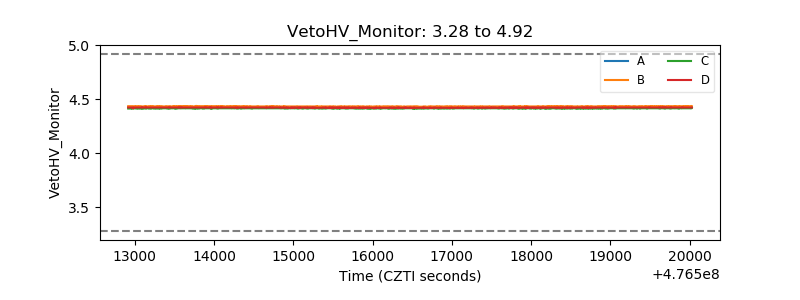 |
| Veto LLD | 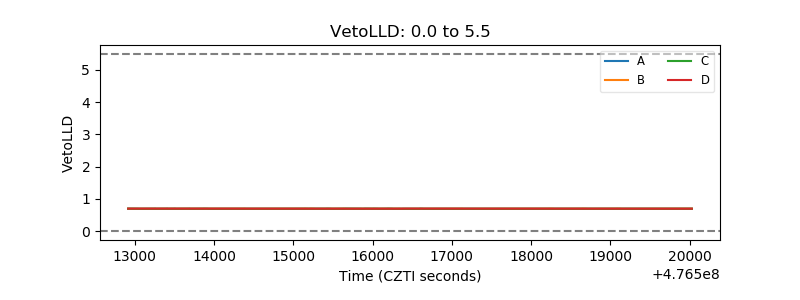 |
| Alpha Counter | 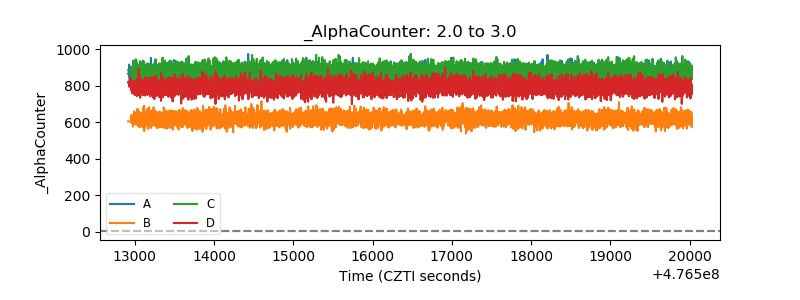 |
| _CPM_Rate | 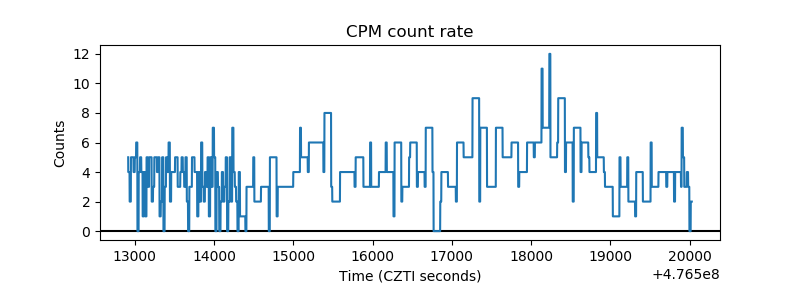 |
| CZT Counter | 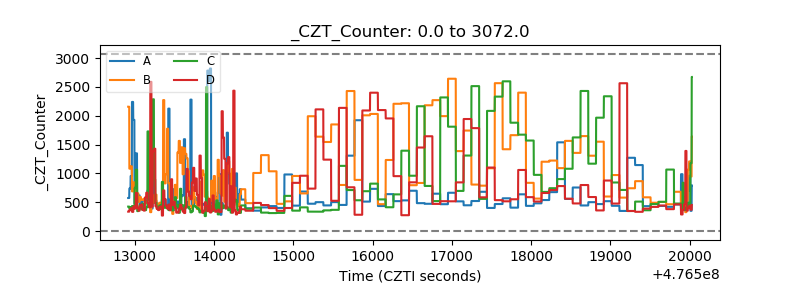 |
| +2.5 Volts monitor | 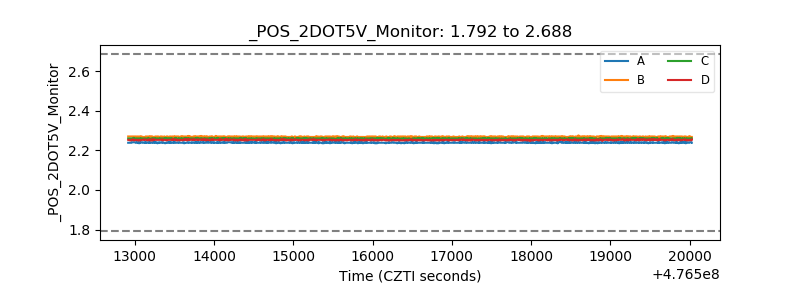 |
| +5 Volts monitor | 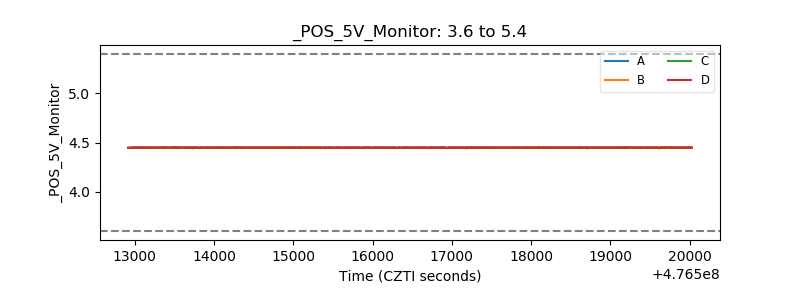 |
| _ROLL_ROT | 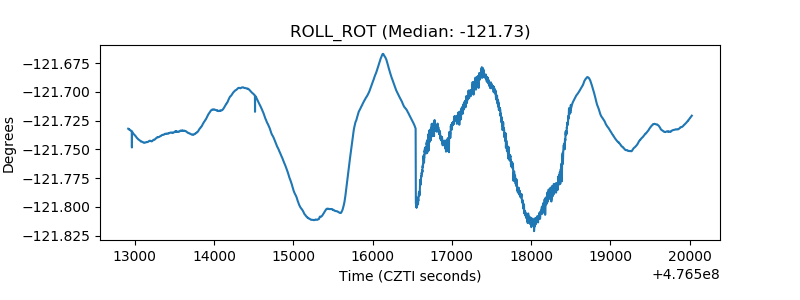 |
| _Roll_DEC | 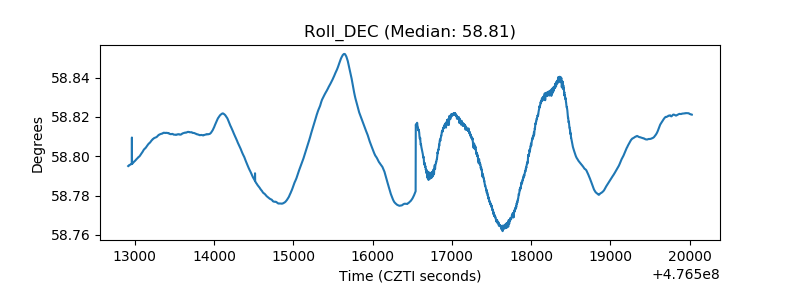 |
| _Roll_RA | 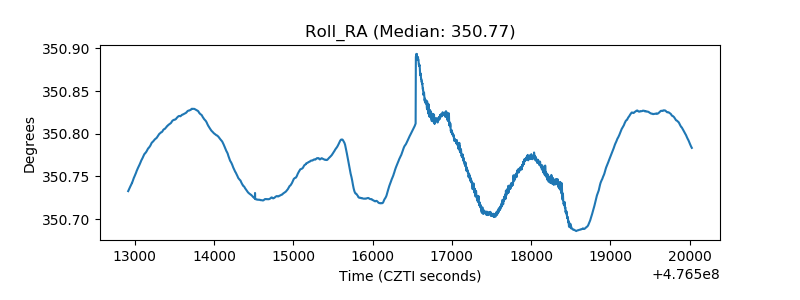 |
| Veto Counter | 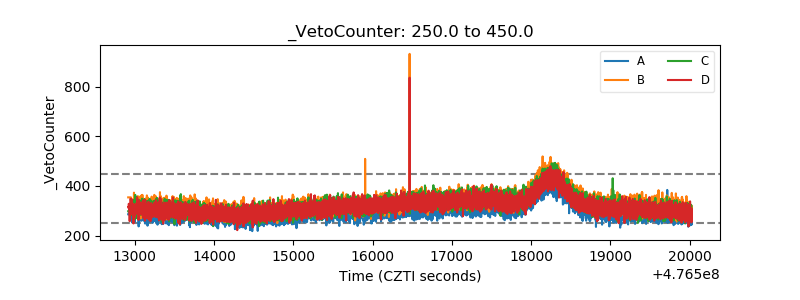 |