| Param | Original file | Final file |
|---|---|---|
| Filename | modeM0/AS1T05_241T01_9000006446_50644cztM0_level2.fits | modeM0/AS1T05_241T01_9000006446_50644cztM0_level2_quad_clean.evt |
| Size (bytes) | 920,165,760 | 91,624,320 |
| Size | 877.5 MB | 87.4 MB |
| Events in quadrant A | 4,966,440 | 662,795 |
| Events in quadrant B | 11,409,164 | 551,723 |
| Events in quadrant C | 11,414,404 | 455,771 |
| Events in quadrant D | 5,707,831 | 594,686 |
| Mode M0 | |||
|---|---|---|---|
| Quadrant | BADHDUFLAG | Total packets | Discarded packets |
| A | 0 | 19613 | 0 |
| B | 0 | 38979 | 0 |
| C | 0 | 38995 | 0 |
| D | 0 | 22168 | 0 |
| Mode SS | |||
|---|---|---|---|
| Quadrant | BADHDUFLAG | Total packets | Discarded packets |
| A | 0 | 146 | 0 |
| B | 0 | 146 | 0 |
| C | 0 | 146 | 0 |
| D | 0 | 146 | 0 |
| Quadrant | Total seconds | Saturated seconds | Saturation percentage |
|---|---|---|---|
| A | 7306 | 185 | 2.532165% |
| B | 7306 | 2473 | 33.848891% |
| C | 7306 | 2553 | 34.943882% |
| D | 7306 | 348 | 4.763208% |
Noise dominated data is calculated using 1-second bins in cleaned event files. If a bin has >2000 counts, and if more than 50% of those come from <1% of pixels, then it is considered to be noise-dominated and hence unusable.
| Quadrant | # 1 sec bins | Bins with >0 counts | Bins with >2000 counts | High rate bins dominated by noise | Noise dominated (total time) | Noise dominated (detector-on time) | Marked lightcurve |
|---|---|---|---|---|---|---|---|
| A | 7306 | 7306 | 114 | 114 | 1.56% | 1.56% | 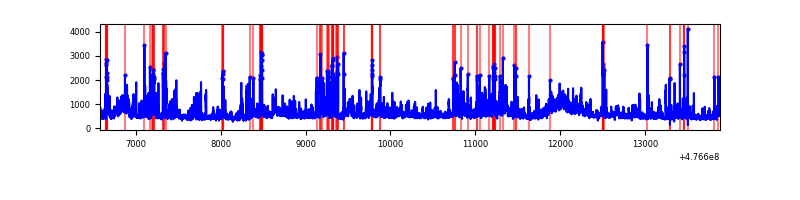 |
| B | 7306 | 7306 | 2100 | 2100 | 28.74% | 28.74% | 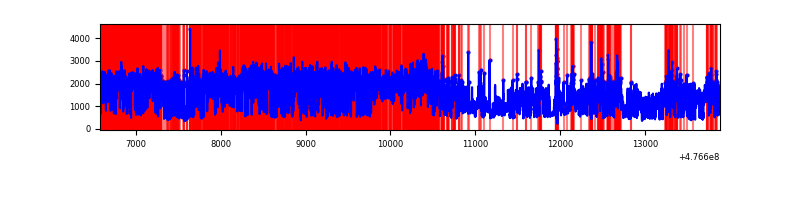 |
| C | 7306 | 7306 | 2214 | 2214 | 30.30% | 30.30% | 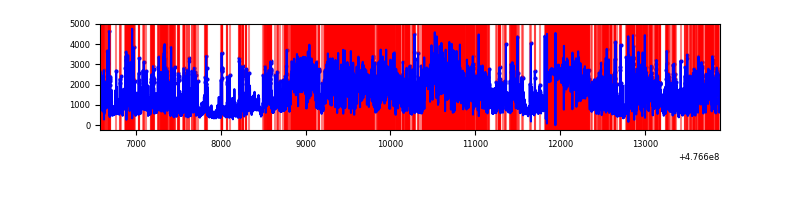 |
| D | 7306 | 7306 | 346 | 346 | 4.74% | 4.74% | 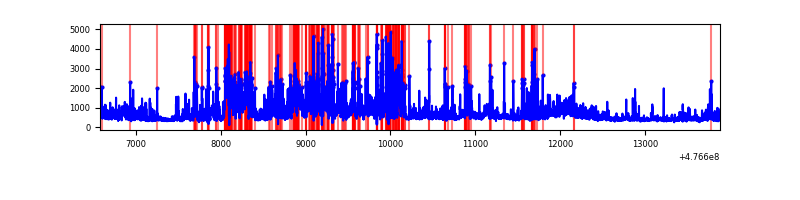 |
Top three noisy pixels from each quadrant. If the there are fewer than three noisy pixels in the level2.evt file, extra rows are filled as -1
| Pixel properties | Quadrant properties | ||||||
|---|---|---|---|---|---|---|---|
| Quadrant | DetID | PixID | Counts | Sigma | Mean | Median | Sigma |
| A | 4 | 4 | 368843 | 1945.44 | 761 | 742 | 189.2 |
| A | 12 | 250 | 252962 | 1333.0 | 761 | 742 | 189.2 |
| A | 4 | 156 | 214871 | 1131.69 | 761 | 742 | 189.2 |
| B | 4 | 170 | 7299927 | 48111.52 | 708 | 684 | 151.7 |
| B | 5 | 185 | 424714 | 2794.91 | 708 | 684 | 151.7 |
| B | 3 | 249 | 251776 | 1655.02 | 708 | 684 | 151.7 |
| C | 15 | 174 | 3892381 | 22482.62 | 618 | 612 | 173.1 |
| C | 15 | 127 | 1024545 | 5915.23 | 618 | 612 | 173.1 |
| C | 15 | 147 | 803250 | 4636.81 | 618 | 612 | 173.1 |
| D | 11 | 245 | 599867 | 2963.66 | 725 | 701 | 202.2 |
| D | 7 | 60 | 464547 | 2294.32 | 725 | 701 | 202.2 |
| D | 15 | 154 | 290590 | 1433.88 | 725 | 701 | 202.2 |
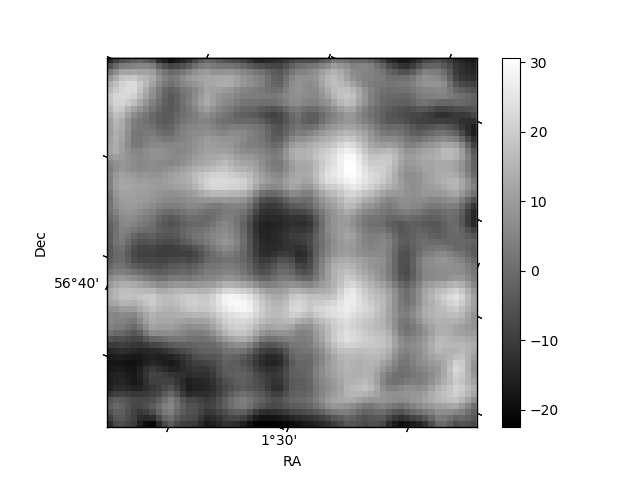
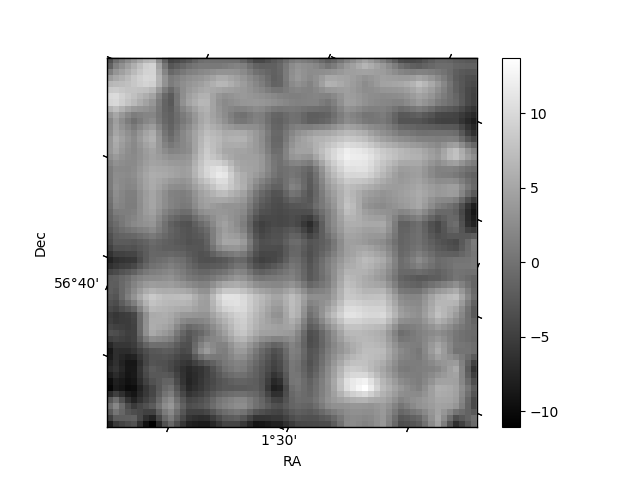
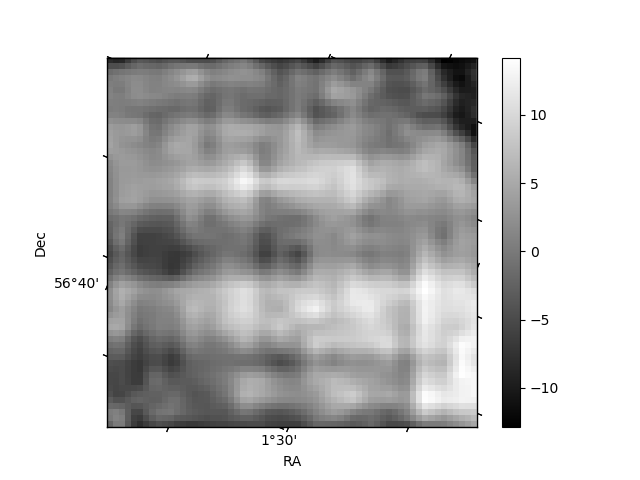
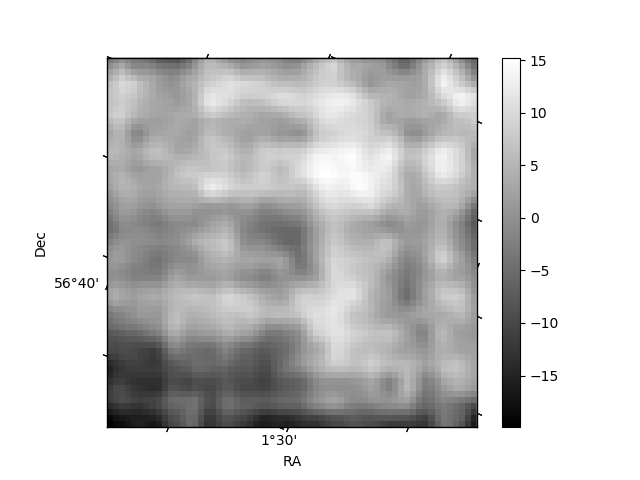
Histogram calculated using DETX and DETY for each event in the final _common_clean file
| Quadrant A | 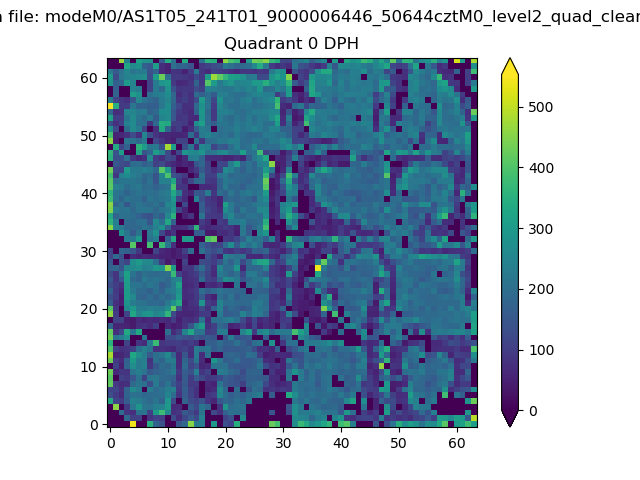 |
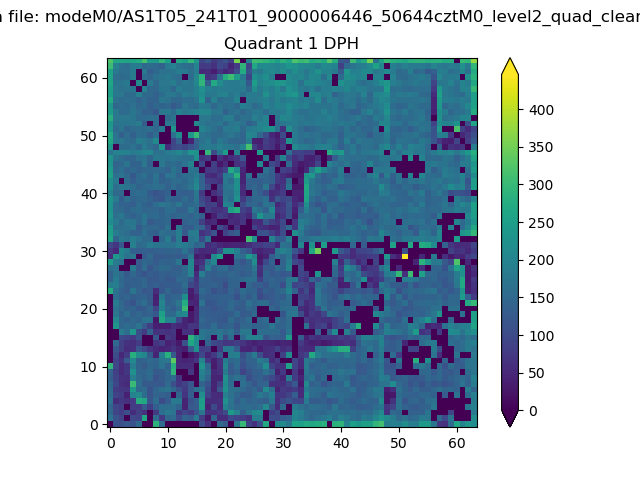 |
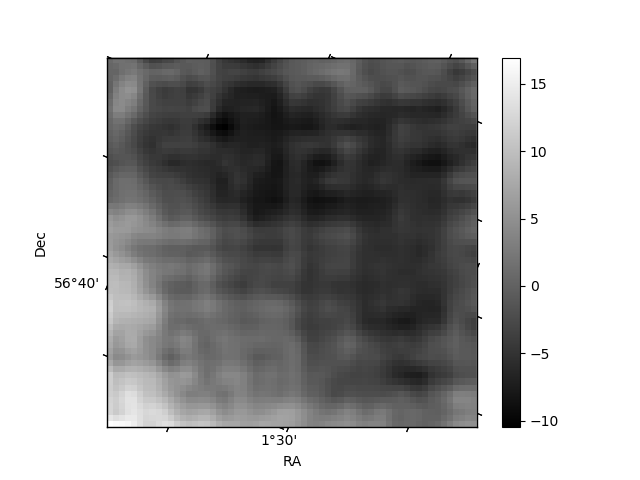
Quadrant B |
|---|---|---|---|
| Quadrant D | 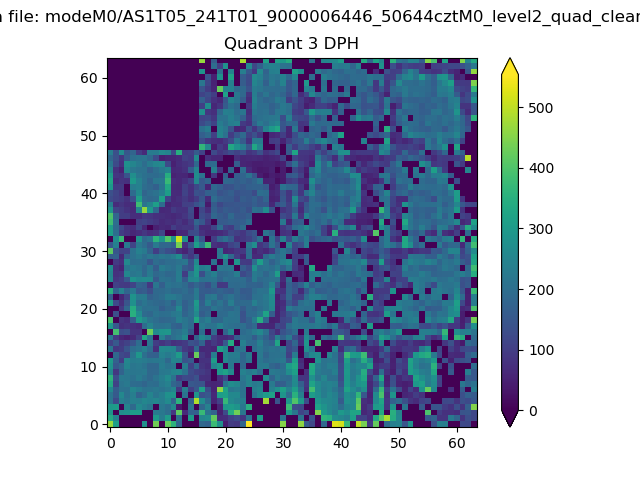 |
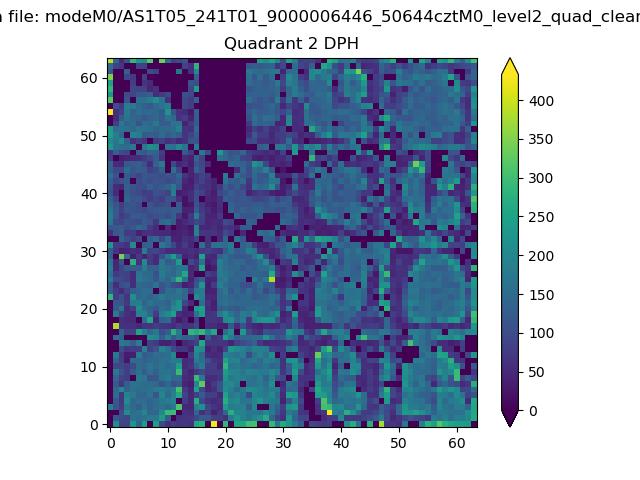 |
Quadrant C |
| Plot type | Count rate plots | Images |
|---|---|---|
| Comparison with Poisson distribution Blue bars denote a histogram of data divided into 1 sec bins. Red curve is a Poisson curve with rate = median count rate of data. |
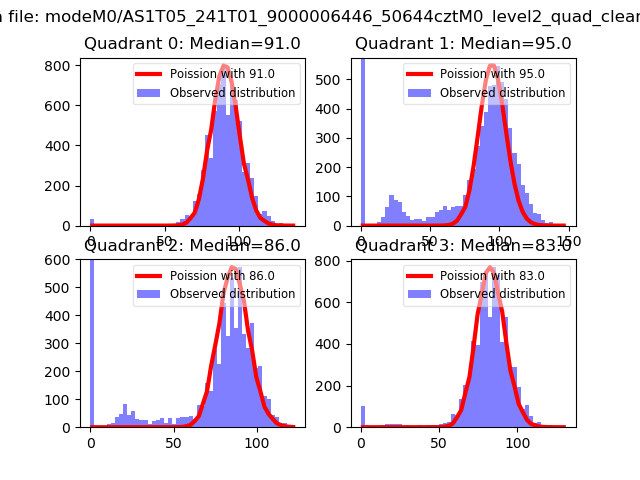 |
 |
| Quadrant-wise count rates Data is divided into 100 sec bins |
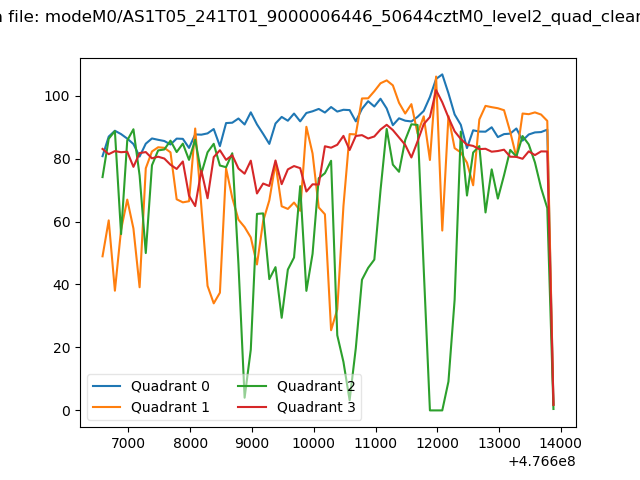 |
|
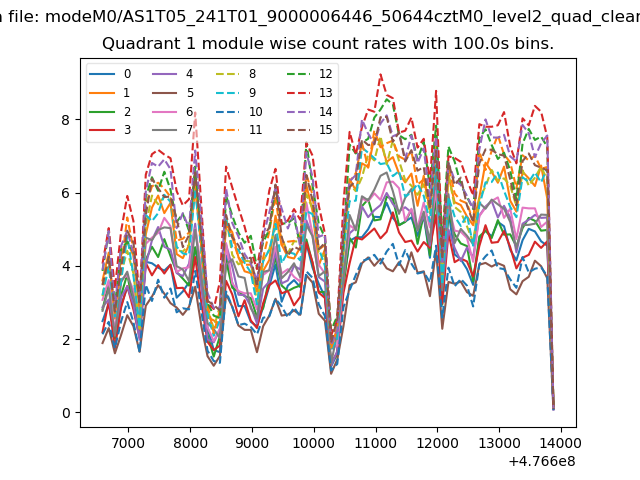
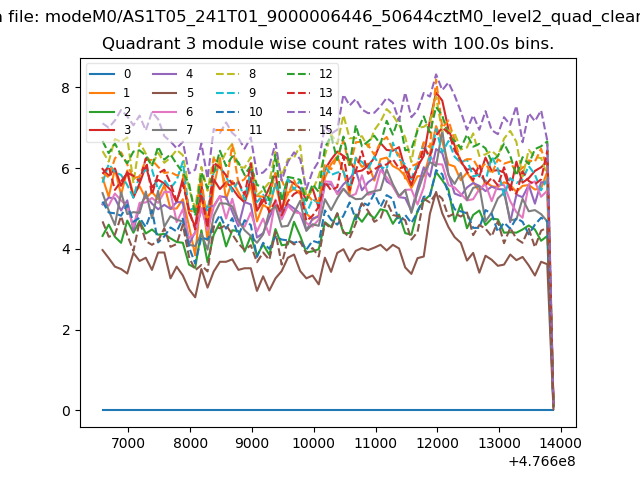
| Module-wise count rates for Quadrant A Data is divided into 100 sec bins |
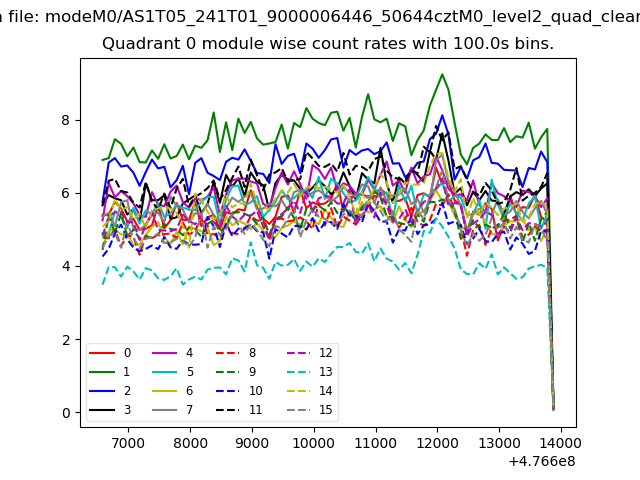 |
 |
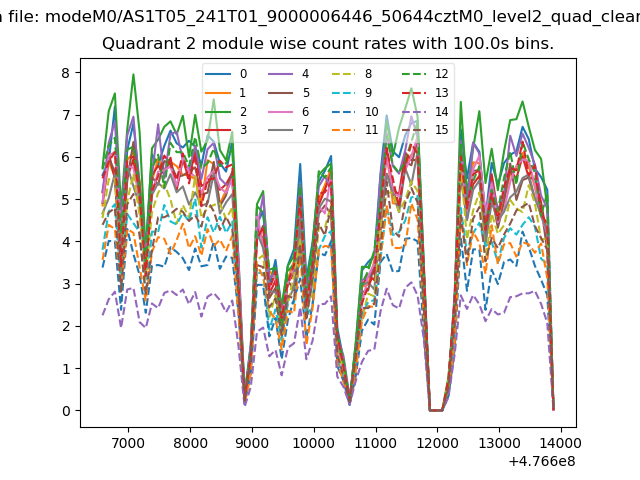
| Module-wise count rates for Quadrant B Data is divided into 100 sec bins |
 |
 |
| Module-wise count rates for Quadrant C Data is divided into 100 sec bins |
 |
 |
| Module-wise count rates for Quadrant D Data is divided into 100 sec bins |
 |
 |
| Parameter | Plot |
|---|---|
| CZT HV Monitor |  |
| D_VDD | 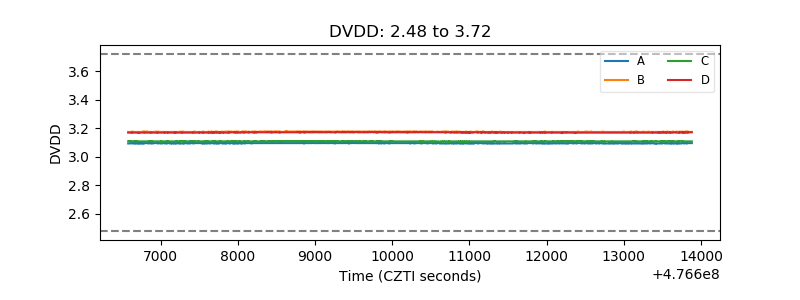 |
| Temperature 1 | 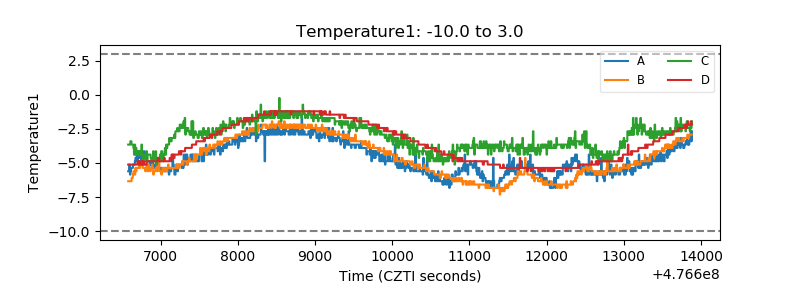 |
| Veto HV Monitor | 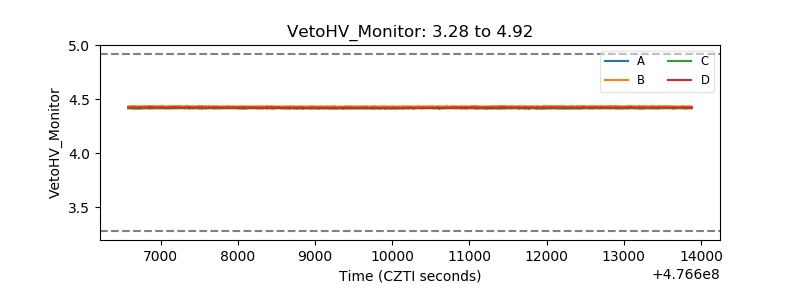 |
| Veto LLD | 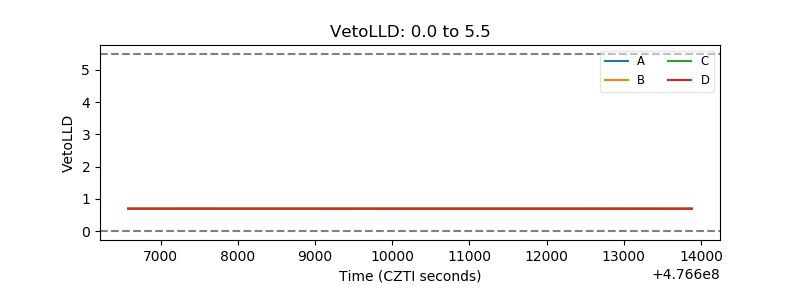 |
| Alpha Counter | 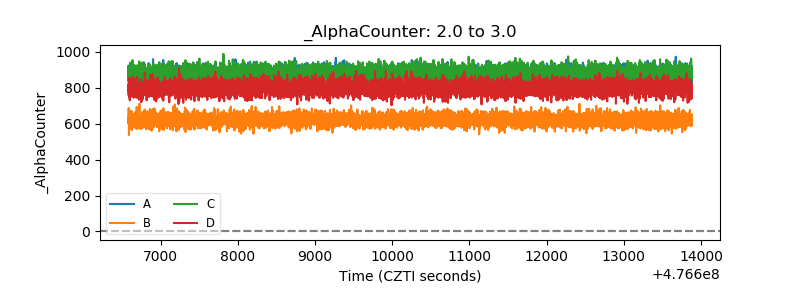 |
| _CPM_Rate | 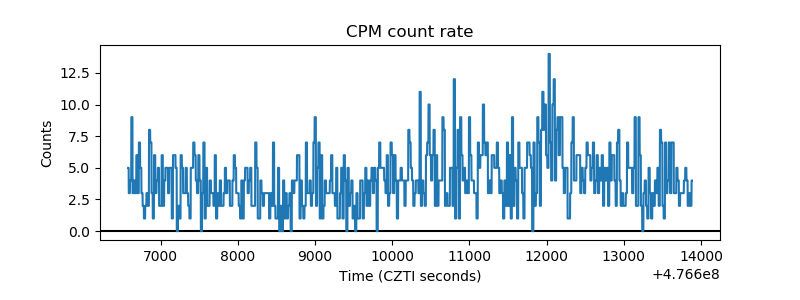 |
| CZT Counter | 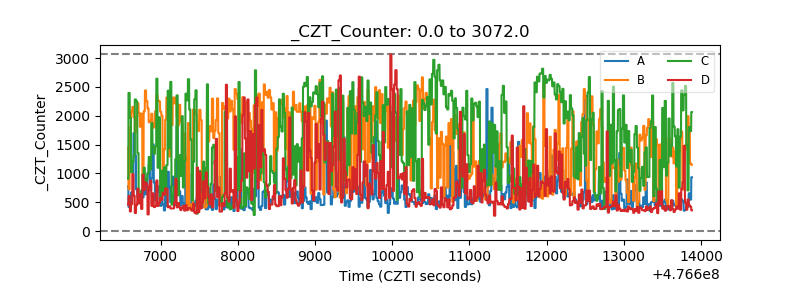 |
| +2.5 Volts monitor | 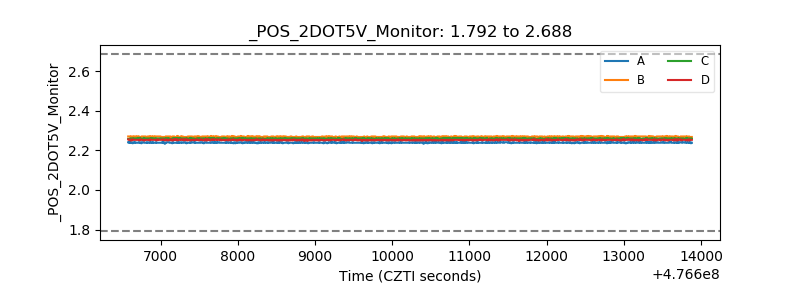 |
| +5 Volts monitor |  |
| _ROLL_ROT | 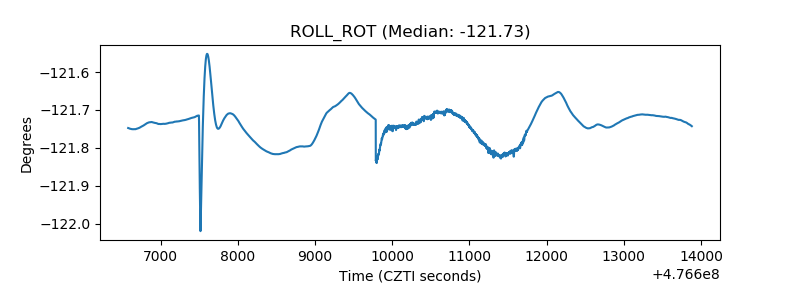 |
| _Roll_DEC | 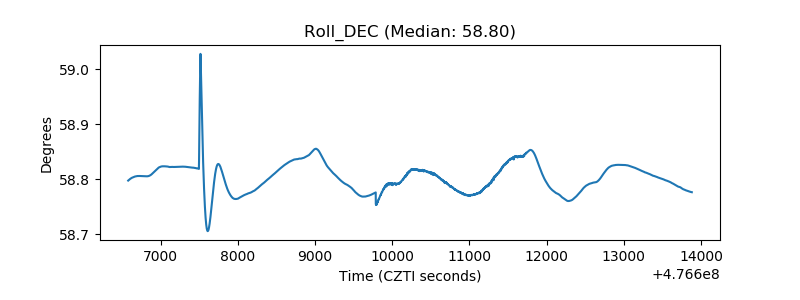 |
| _Roll_RA | 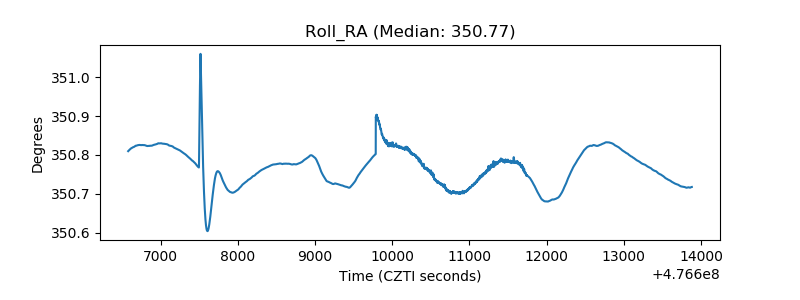 |
| Veto Counter | 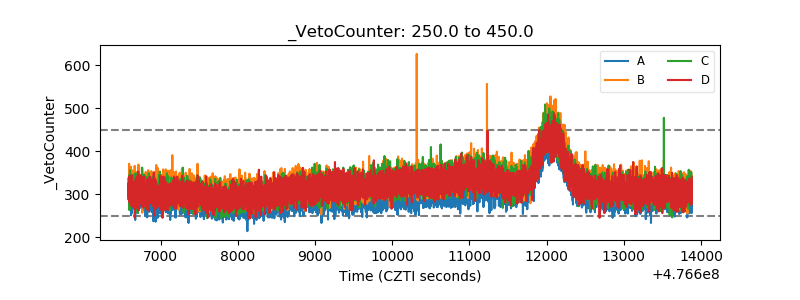 |