| Param | Original file | Final file |
|---|---|---|
| Filename | modeM0/AS1T05_241T01_9000006446_50686cztM0_level2.fits | modeM0/AS1T05_241T01_9000006446_50686cztM0_level2_quad_clean.evt |
| Size (bytes) | 660,905,280 | 105,249,600 |
| Size | 630.3 MB | 100.4 MB |
| Events in quadrant A | 6,010,403 | 664,484 |
| Events in quadrant B | 4,674,942 | 758,148 |
| Events in quadrant C | 7,993,546 | 610,052 |
| Events in quadrant D | 5,204,575 | 631,431 |
| Mode M0 | |||
|---|---|---|---|
| Quadrant | BADHDUFLAG | Total packets | Discarded packets |
| A | 0 | 23080 | 0 |
| B | 0 | 18907 | 1 |
| C | 0 | 29082 | 0 |
| D | 0 | 20781 | 0 |
| Mode SS | |||
|---|---|---|---|
| Quadrant | BADHDUFLAG | Total packets | Discarded packets |
| A | 0 | 150 | 0 |
| B | 0 | 150 | 0 |
| C | 0 | 150 | 0 |
| D | 0 | 150 | 0 |
| Quadrant | Total seconds | Saturated seconds | Saturation percentage |
|---|---|---|---|
| A | 7510 | 466 | 6.205060% |
| B | 7509 | 118 | 1.571448% |
| C | 7510 | 1053 | 14.021305% |
| D | 7510 | 194 | 2.583222% |
Noise dominated data is calculated using 1-second bins in cleaned event files. If a bin has >2000 counts, and if more than 50% of those come from <1% of pixels, then it is considered to be noise-dominated and hence unusable.
| Quadrant | # 1 sec bins | Bins with >0 counts | Bins with >2000 counts | High rate bins dominated by noise | Noise dominated (total time) | Noise dominated (detector-on time) | Marked lightcurve |
|---|---|---|---|---|---|---|---|
| A | 7510 | 7510 | 306 | 306 | 4.07% | 4.07% | 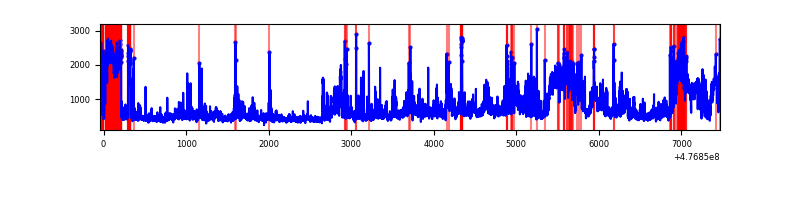 |
| B | 7509 | 7509 | 64 | 64 | 0.85% | 0.85% | 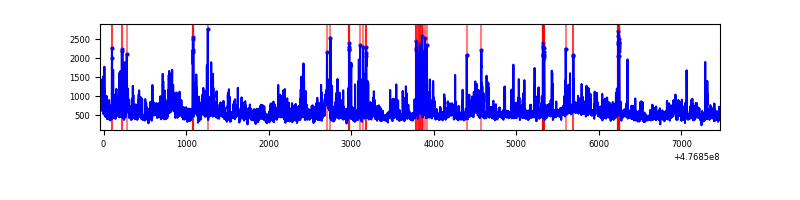 |
| C | 7510 | 7510 | 910 | 910 | 12.12% | 12.12% | 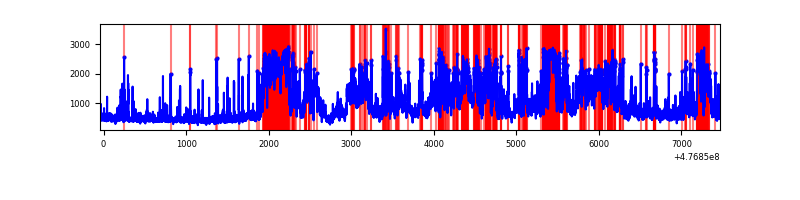 |
| D | 7510 | 7510 | 216 | 216 | 2.88% | 2.88% | 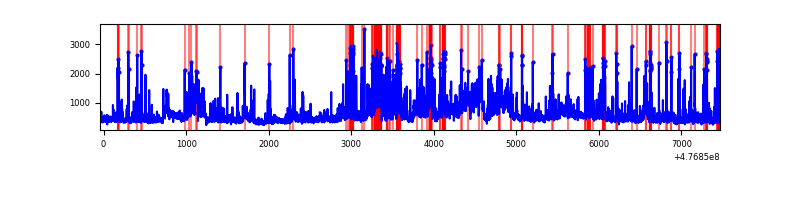 |
Top three noisy pixels from each quadrant. If the there are fewer than three noisy pixels in the level2.evt file, extra rows are filled as -1
| Pixel properties | Quadrant properties | ||||||
|---|---|---|---|---|---|---|---|
| Quadrant | DetID | PixID | Counts | Sigma | Mean | Median | Sigma |
| A | 12 | 80 | 1449823 | 7578.14 | 772 | 754 | 191.2 |
| A | 9 | 191 | 521085 | 2721.16 | 772 | 754 | 191.2 |
| A | 4 | 3 | 184544 | 961.16 | 772 | 754 | 191.2 |
| B | 0 | 229 | 469112 | 2806.86 | 783 | 756 | 166.9 |
| B | 4 | 170 | 431082 | 2578.95 | 783 | 756 | 166.9 |
| B | 10 | 247 | 136560 | 813.88 | 783 | 756 | 166.9 |
| C | 15 | 234 | 1364566 | 6715.46 | 733 | 727 | 203.1 |
| C | 15 | 174 | 1059411 | 5212.89 | 733 | 727 | 203.1 |
| C | 4 | 5 | 909831 | 4476.37 | 733 | 727 | 203.1 |
| D | 7 | 110 | 441153 | 2105.11 | 754 | 728 | 209.2 |
| D | 3 | 12 | 293373 | 1398.76 | 754 | 728 | 209.2 |
| D | 8 | 246 | 280838 | 1338.85 | 754 | 728 | 209.2 |
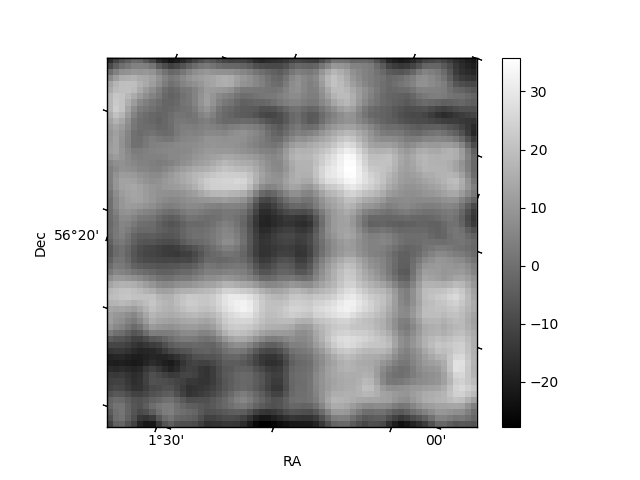
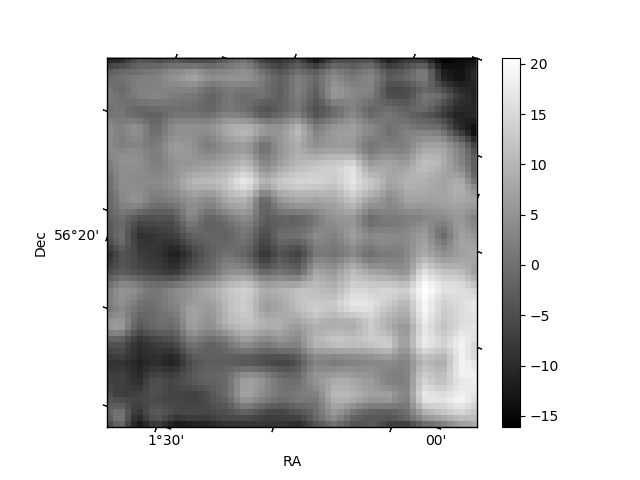
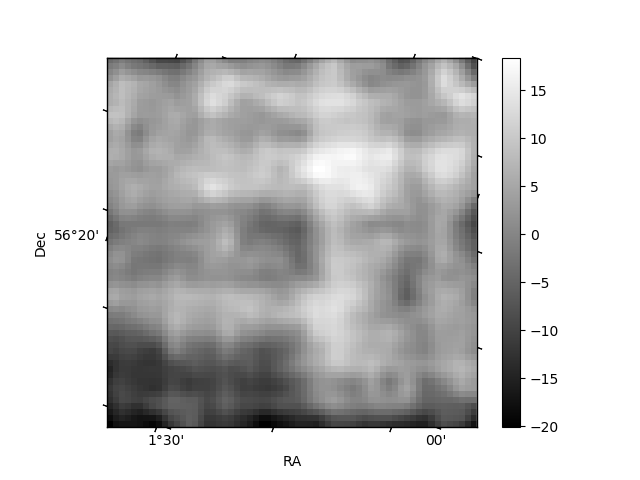
Histogram calculated using DETX and DETY for each event in the final _common_clean file
| Quadrant A | 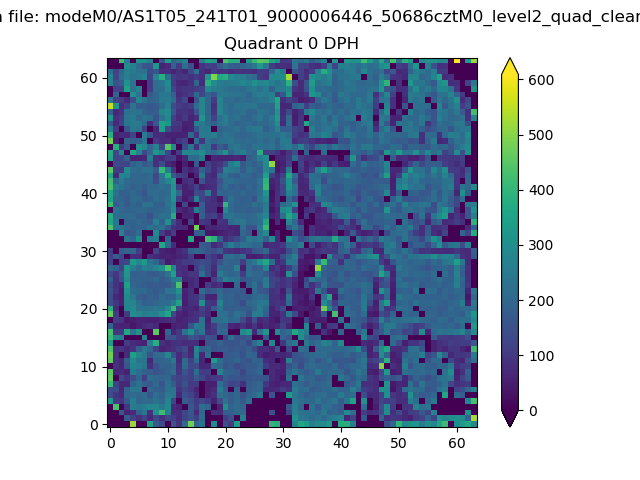 |
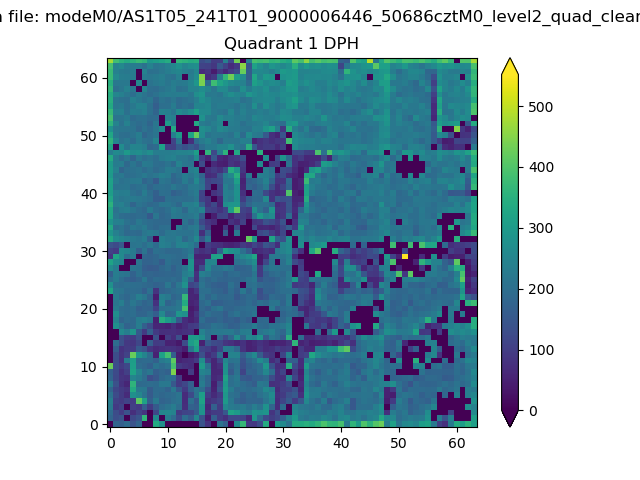 |
Quadrant B |
|---|---|---|---|
| Quadrant D | 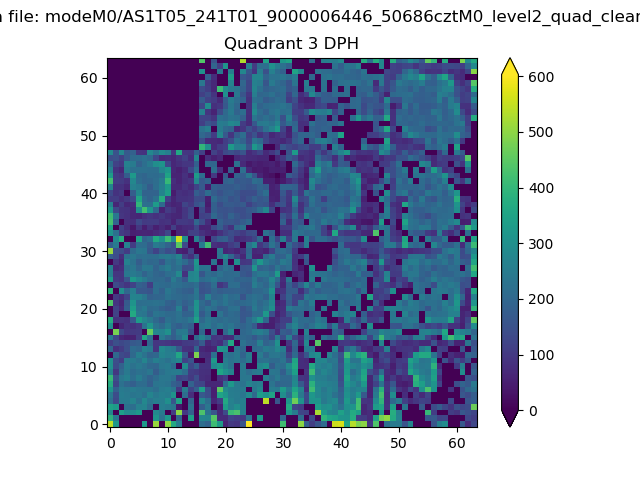 |
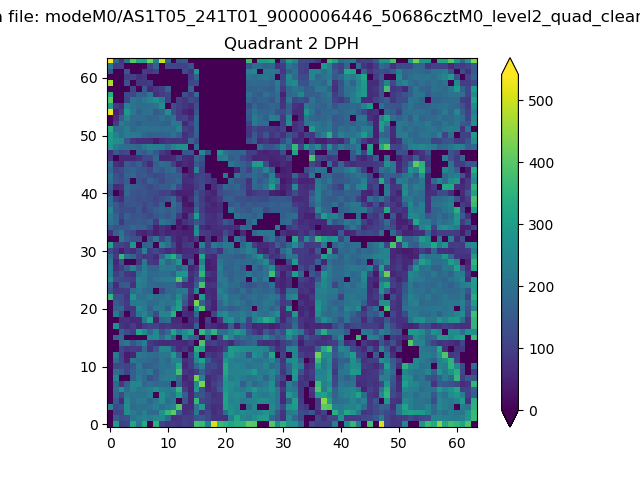 |
Quadrant C |
| Plot type | Count rate plots | Images |
|---|---|---|
| Comparison with Poisson distribution Blue bars denote a histogram of data divided into 1 sec bins. Red curve is a Poisson curve with rate = median count rate of data. |
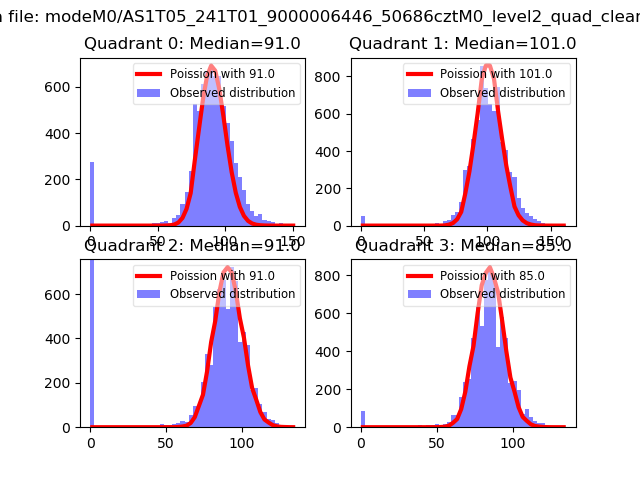 |
 |
| Quadrant-wise count rates Data is divided into 100 sec bins |
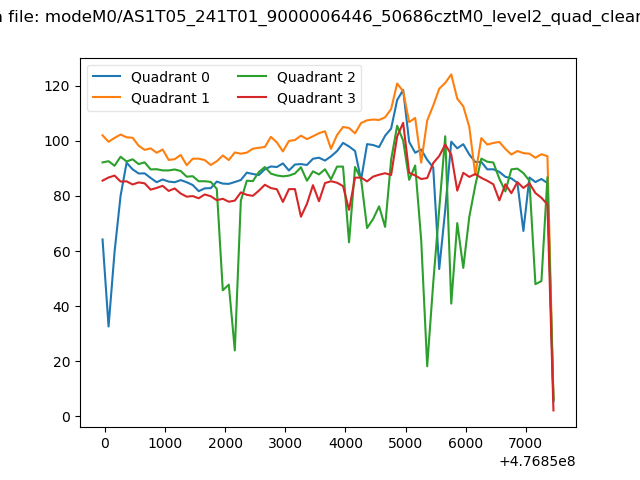 |
|
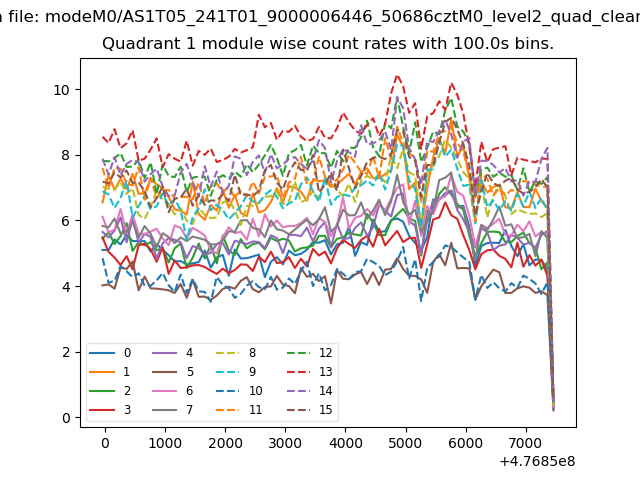
| Module-wise count rates for Quadrant A Data is divided into 100 sec bins |
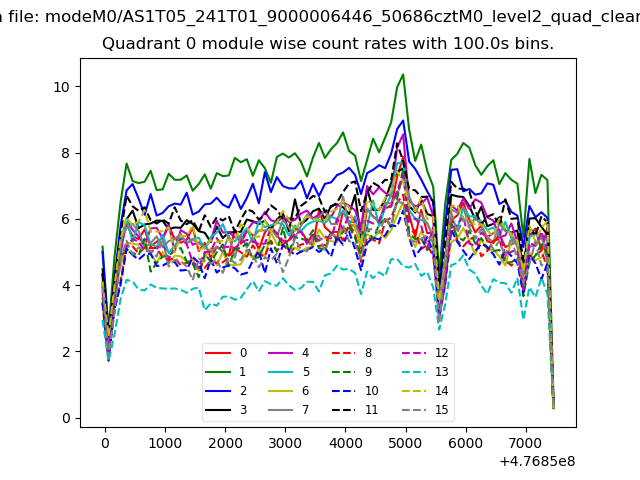 |
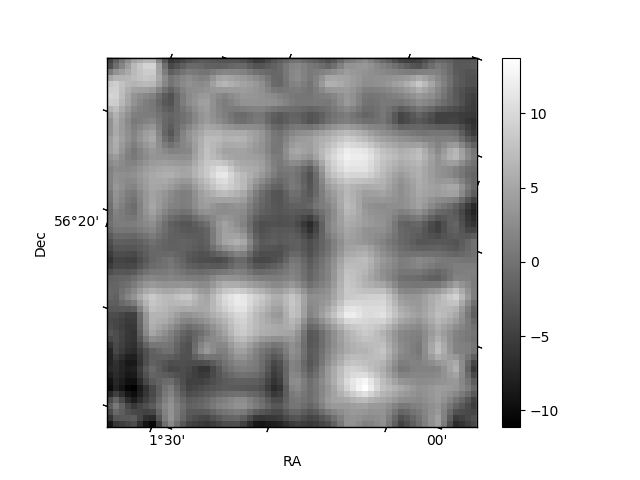 |
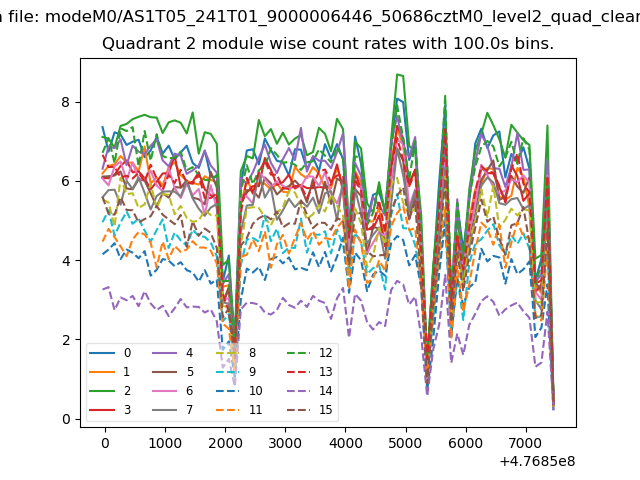
| Module-wise count rates for Quadrant B Data is divided into 100 sec bins |
 |
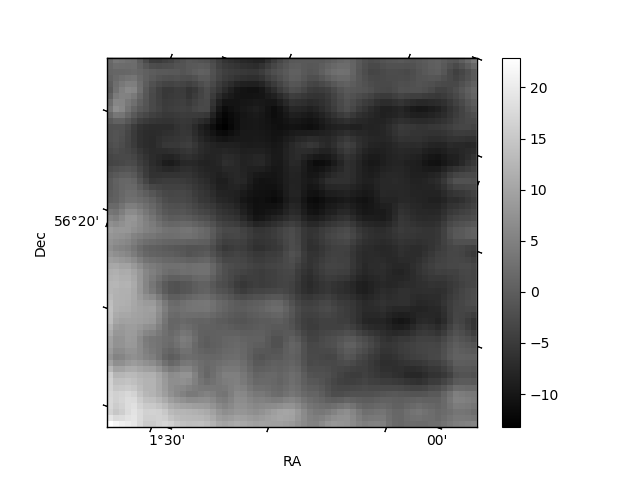 |
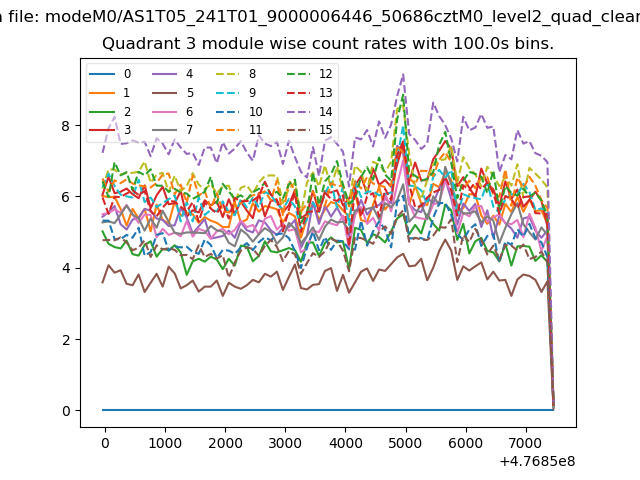
| Module-wise count rates for Quadrant C Data is divided into 100 sec bins |
 |
 |
| Module-wise count rates for Quadrant D Data is divided into 100 sec bins |
 |
 |
| Parameter | Plot |
|---|---|
| CZT HV Monitor | 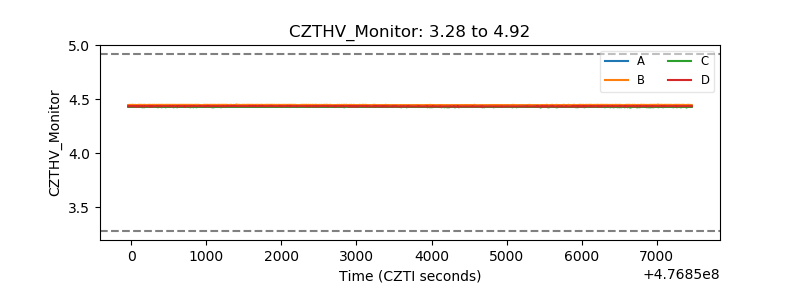 |
| D_VDD | 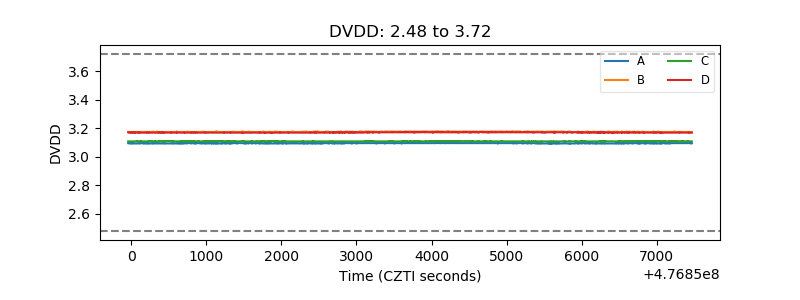 |
| Temperature 1 | 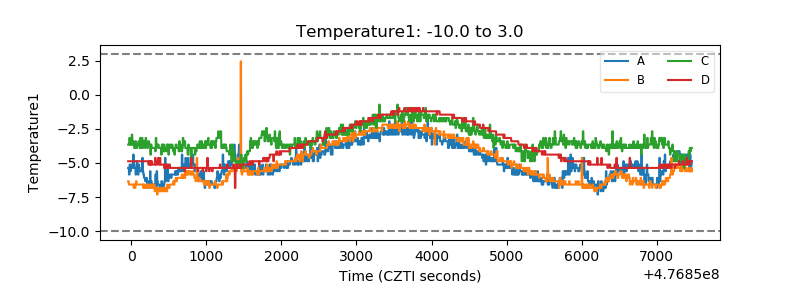 |
| Veto HV Monitor | 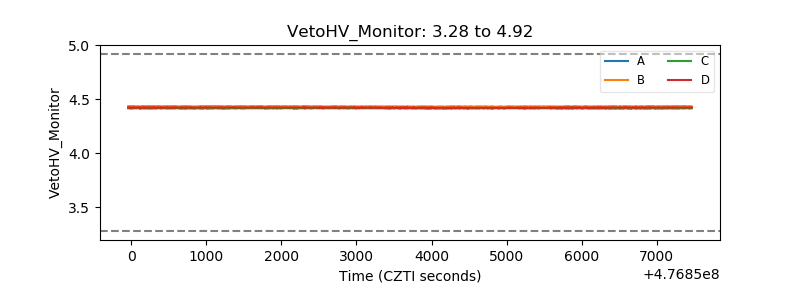 |
| Veto LLD | 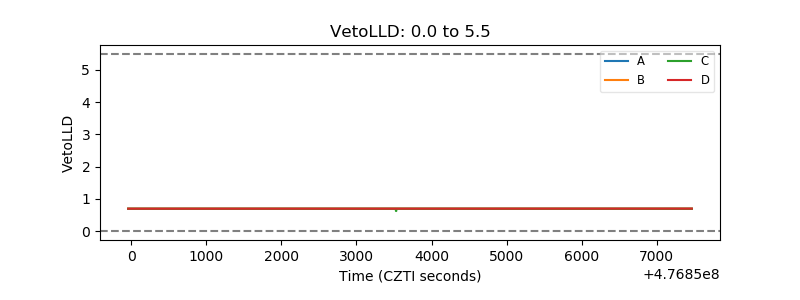 |
| Alpha Counter | 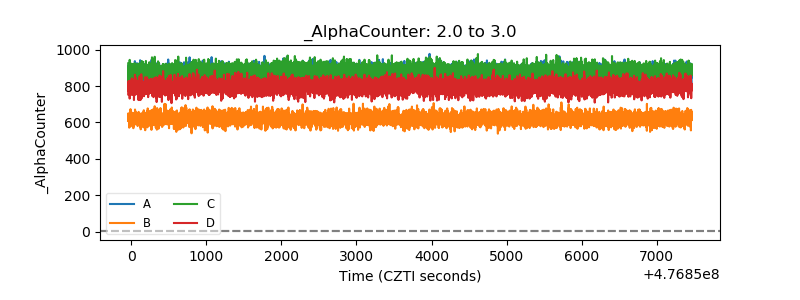 |
| _CPM_Rate | 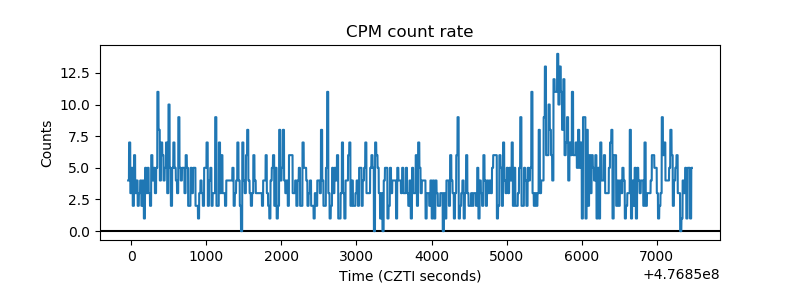 |
| CZT Counter | 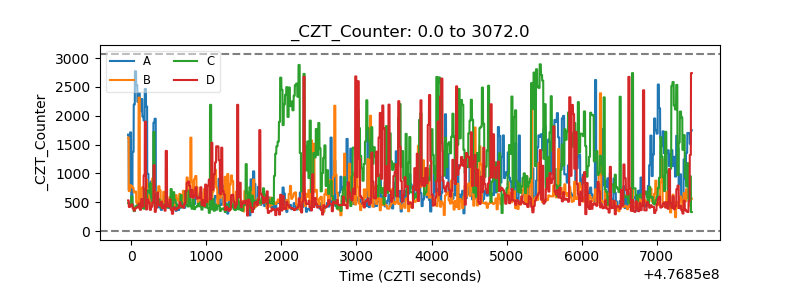 |
| +2.5 Volts monitor | 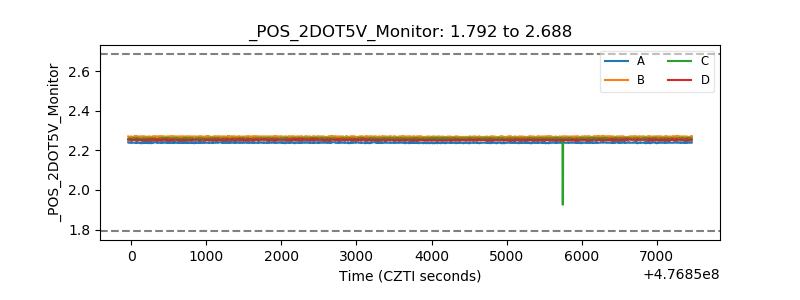 |
| +5 Volts monitor | 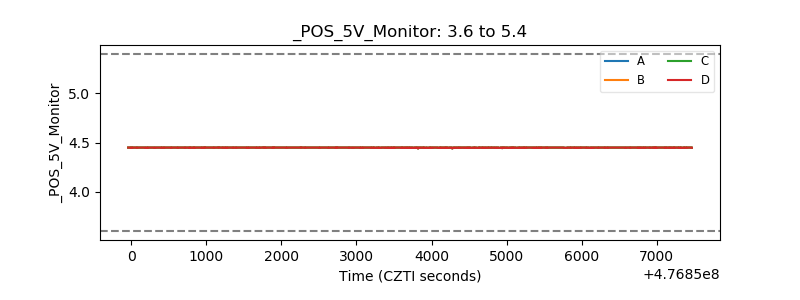 |
| _ROLL_ROT | 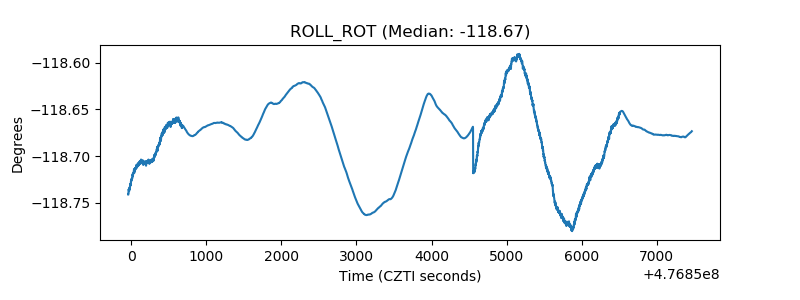 |
| _Roll_DEC | 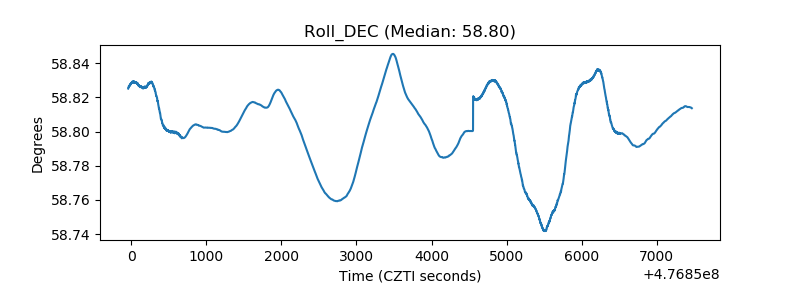 |
| _Roll_RA | 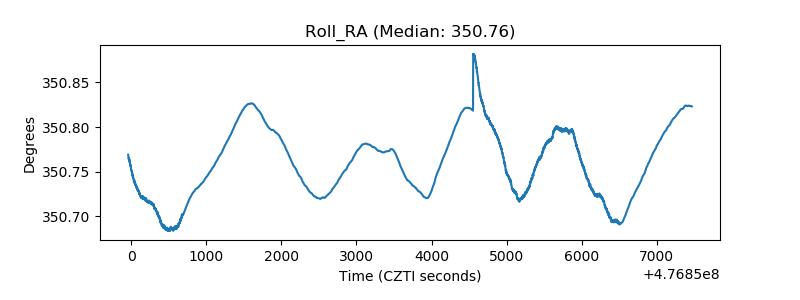 |
| Veto Counter |  |