| Param | Original file | Final file |
|---|---|---|
| Filename | modeM0/AS1C07_001T01_9000006450_50818cztM0_level2.fits | modeM0/AS1C07_001T01_9000006450_50818cztM0_level2_quad_clean.evt |
| Size (bytes) | 711,486,720 | 109,932,480 |
| Size | 678.5 MB | 104.8 MB |
| Events in quadrant A | 7,295,842 | 678,222 |
| Events in quadrant B | 4,162,990 | 815,424 |
| Events in quadrant C | 6,313,797 | 672,634 |
| Events in quadrant D | 7,939,176 | 600,702 |
| Mode SS | |||
|---|---|---|---|
| Quadrant | BADHDUFLAG | Total packets | Discarded packets |
| A | 0 | 162 | 0 |
| B | 0 | 162 | 0 |
| C | 0 | 162 | 0 |
| D | 0 | 162 | 0 |
| Mode M0 | |||
|---|---|---|---|
| Quadrant | BADHDUFLAG | Total packets | Discarded packets |
| A | 0 | 27287 | 0 |
| B | 0 | 18268 | 1 |
| C | 0 | 24553 | 0 |
| D | 0 | 29191 | 0 |
| Quadrant | Total seconds | Saturated seconds | Saturation percentage |
|---|---|---|---|
| A | 8073 | 869 | 10.764276% |
| B | 8073 | 82 | 1.015731% |
| C | 8073 | 724 | 8.968165% |
| D | 8073 | 957 | 11.854329% |
Noise dominated data is calculated using 1-second bins in cleaned event files. If a bin has >2000 counts, and if more than 50% of those come from <1% of pixels, then it is considered to be noise-dominated and hence unusable.
| Quadrant | # 1 sec bins | Bins with >0 counts | Bins with >2000 counts | High rate bins dominated by noise | Noise dominated (total time) | Noise dominated (detector-on time) | Marked lightcurve |
|---|---|---|---|---|---|---|---|
| A | 8073 | 8073 | 806 | 806 | 9.98% | 9.98% | 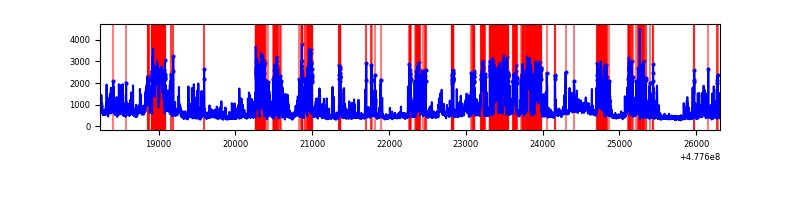 |
| B | 8073 | 8073 | 43 | 43 | 0.53% | 0.53% | 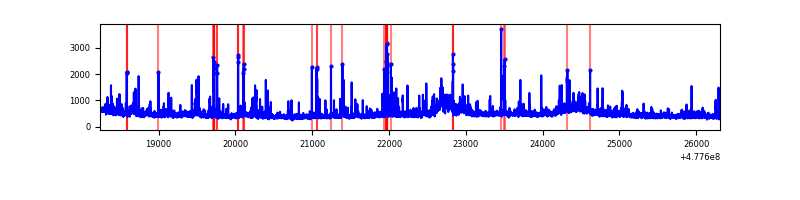 |
| C | 8073 | 8073 | 433 | 433 | 5.36% | 5.36% | 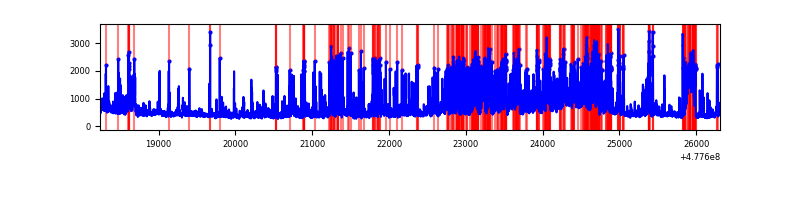 |
| D | 8073 | 8073 | 833 | 833 | 10.32% | 10.32% | 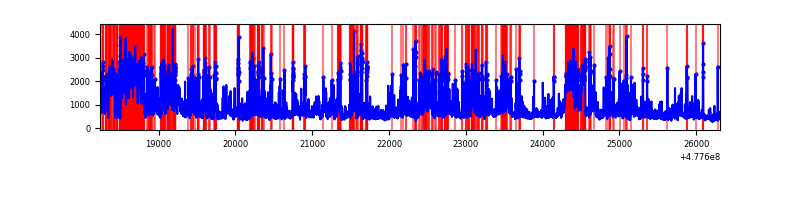 |
Top three noisy pixels from each quadrant. If the there are fewer than three noisy pixels in the level2.evt file, extra rows are filled as -1
| Pixel properties | Quadrant properties | ||||||
|---|---|---|---|---|---|---|---|
| Quadrant | DetID | PixID | Counts | Sigma | Mean | Median | Sigma |
| A | 6 | 161 | 2087348 | 10407.35 | 811 | 791 | 200.5 |
| A | 4 | 191 | 823807 | 4105.05 | 811 | 791 | 200.5 |
| A | 4 | 3 | 154549 | 766.91 | 811 | 791 | 200.5 |
| B | 5 | 185 | 226212 | 1256.77 | 849 | 819 | 179.3 |
| B | 4 | 170 | 116785 | 646.61 | 849 | 819 | 179.3 |
| B | 8 | 128 | 77159 | 425.66 | 849 | 819 | 179.3 |
| C | 4 | 210 | 981834 | 4421.94 | 807 | 800 | 221.9 |
| C | 15 | 237 | 417195 | 1876.87 | 807 | 800 | 221.9 |
| C | 1 | 3 | 321866 | 1447.18 | 807 | 800 | 221.9 |
| D | 15 | 123 | 950288 | 4385.88 | 776 | 749 | 216.5 |
| D | 10 | 172 | 452682 | 2087.46 | 776 | 749 | 216.5 |
| D | 2 | 249 | 429439 | 1980.1 | 776 | 749 | 216.5 |
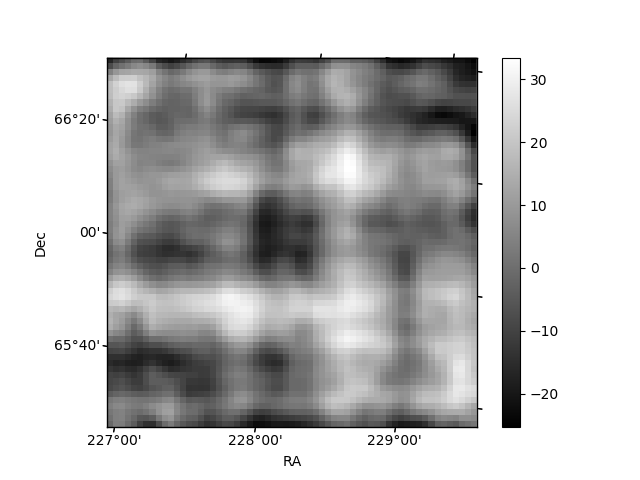
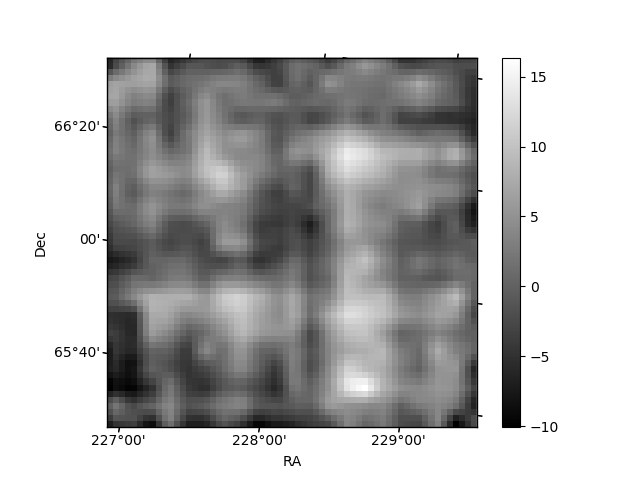
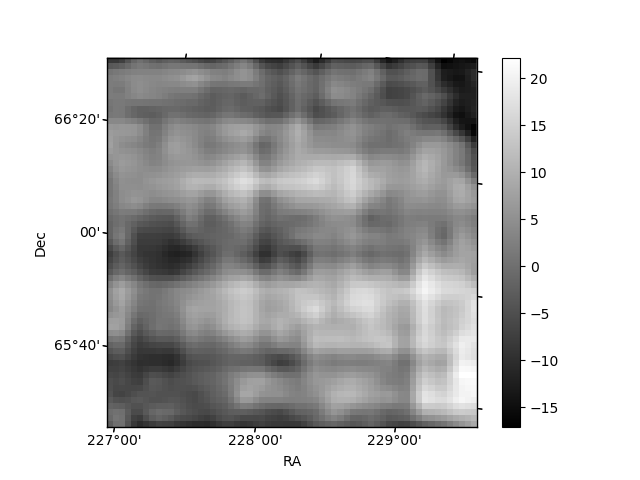
Histogram calculated using DETX and DETY for each event in the final _common_clean file
| Quadrant A | 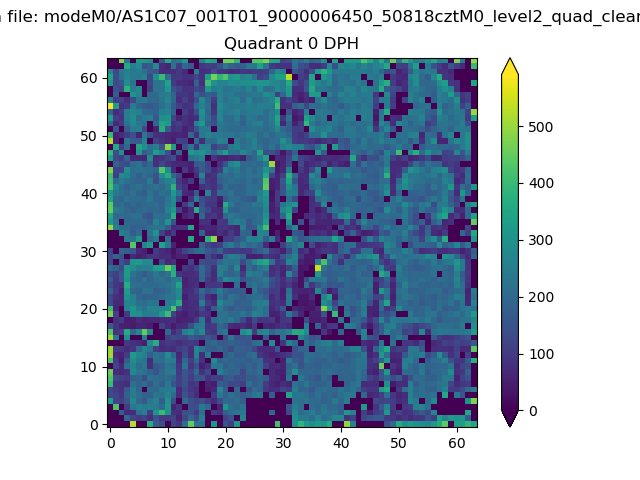 |
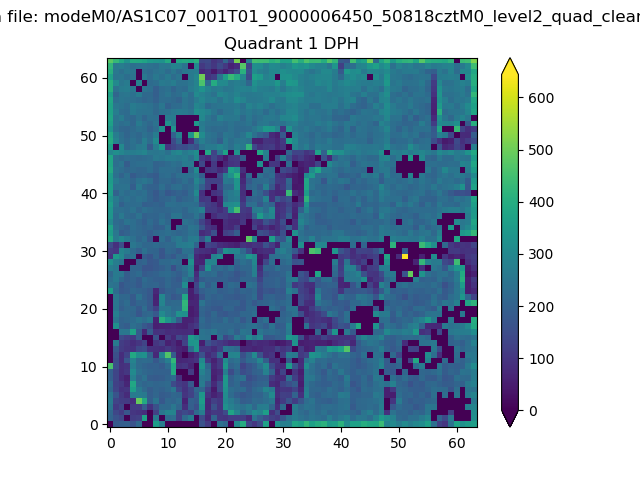 |
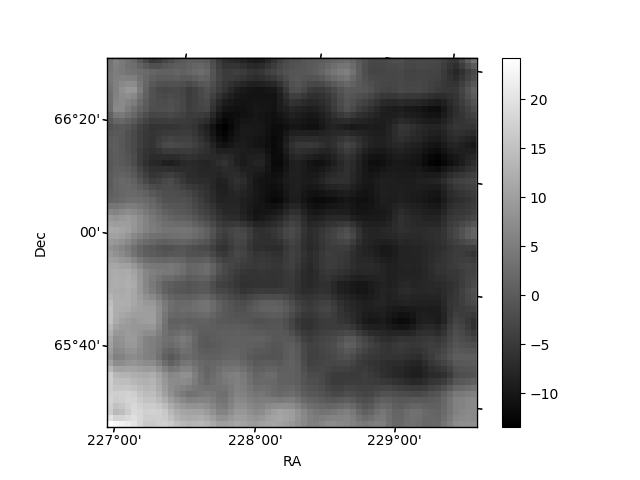
Quadrant B |
|---|---|---|---|
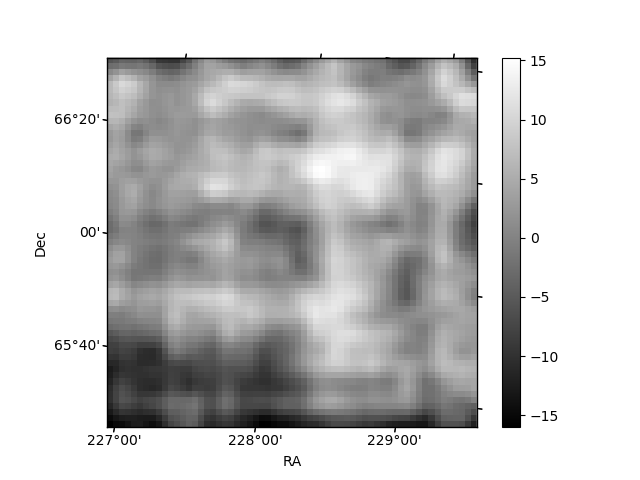
| Quadrant D | 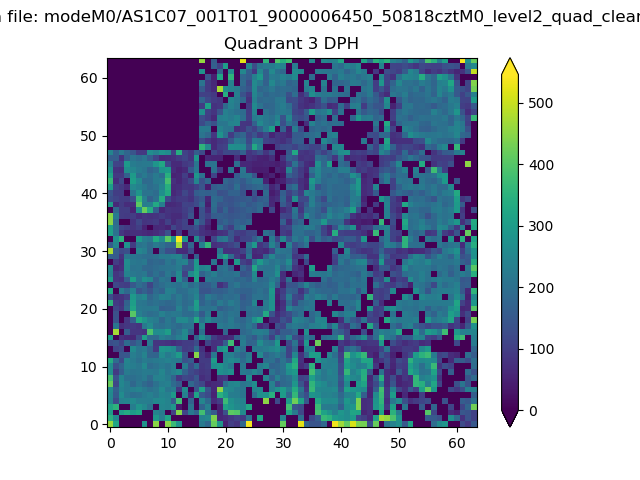 |
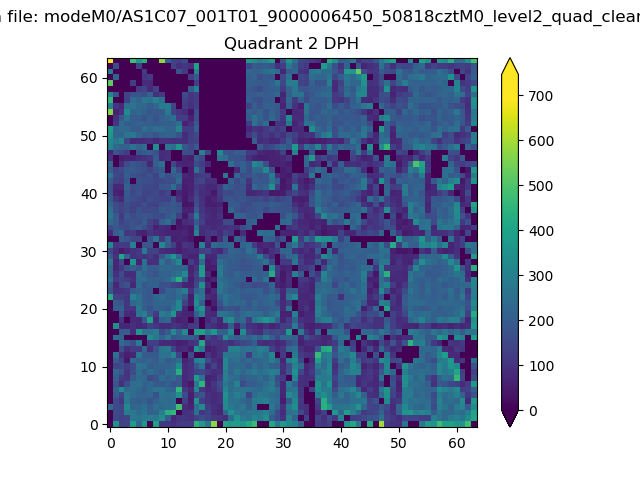 |
Quadrant C |
| Plot type | Count rate plots | Images |
|---|---|---|
| Comparison with Poisson distribution Blue bars denote a histogram of data divided into 1 sec bins. Red curve is a Poisson curve with rate = median count rate of data. |
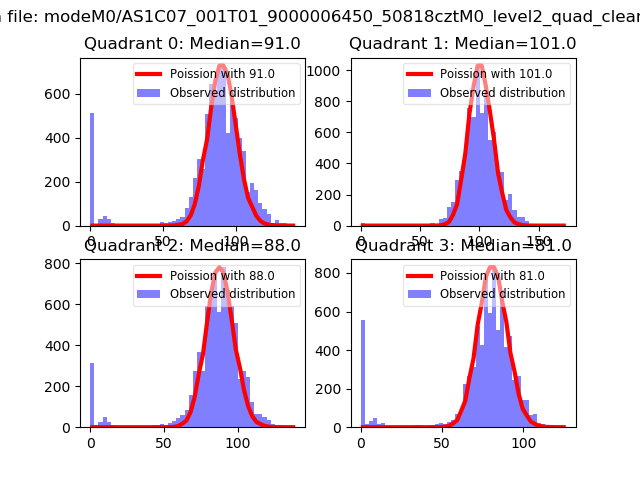 |
 |
| Quadrant-wise count rates Data is divided into 100 sec bins |
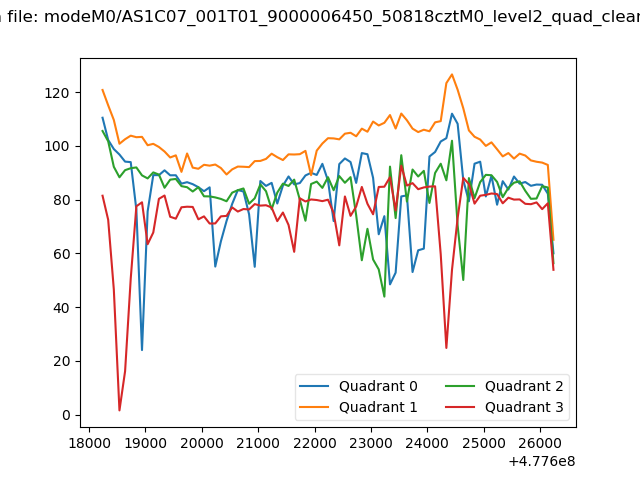 |
|
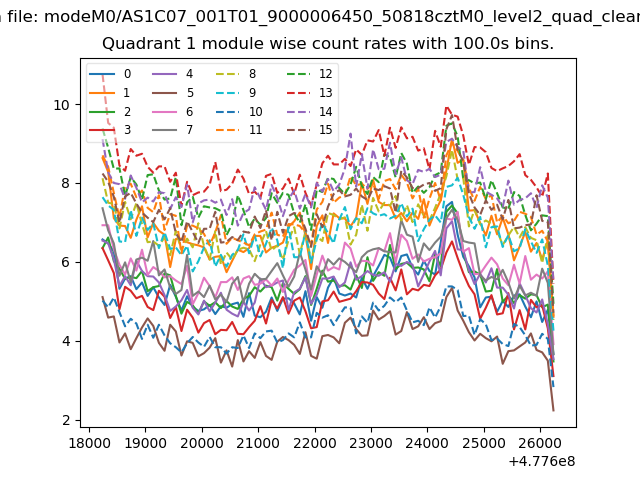
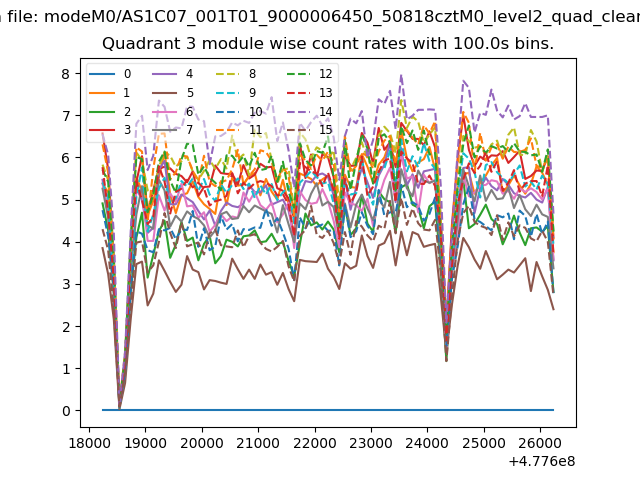
| Module-wise count rates for Quadrant A Data is divided into 100 sec bins |
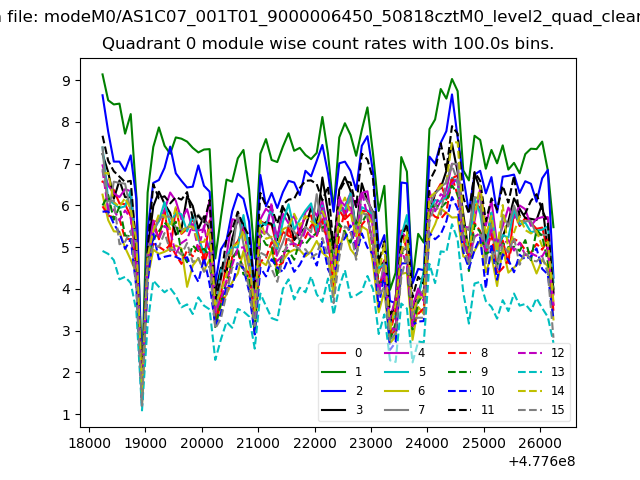 |
 |
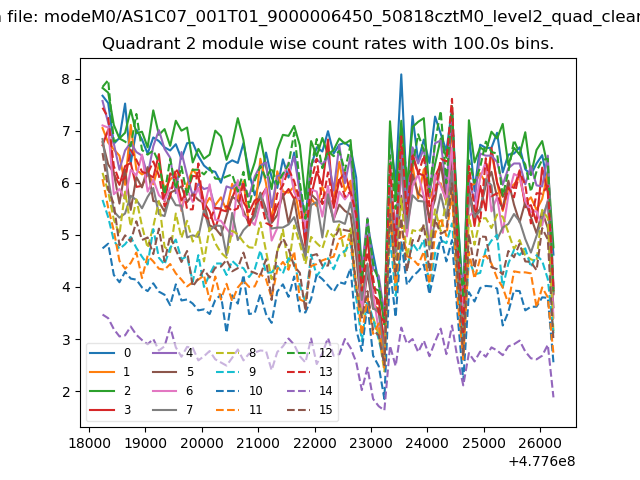
| Module-wise count rates for Quadrant B Data is divided into 100 sec bins |
 |
 |
| Module-wise count rates for Quadrant C Data is divided into 100 sec bins |
 |
 |
| Module-wise count rates for Quadrant D Data is divided into 100 sec bins |
 |
 |
| Parameter | Plot |
|---|---|
| CZT HV Monitor | 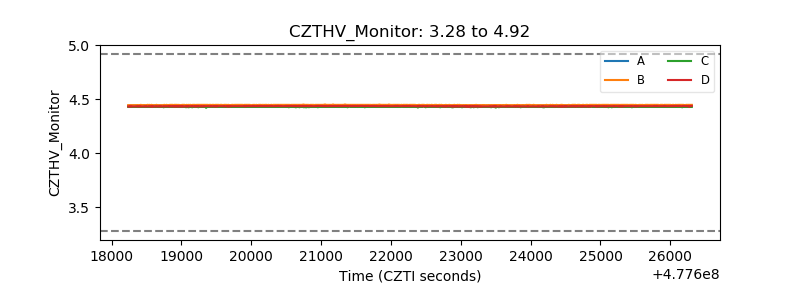 |
| D_VDD | 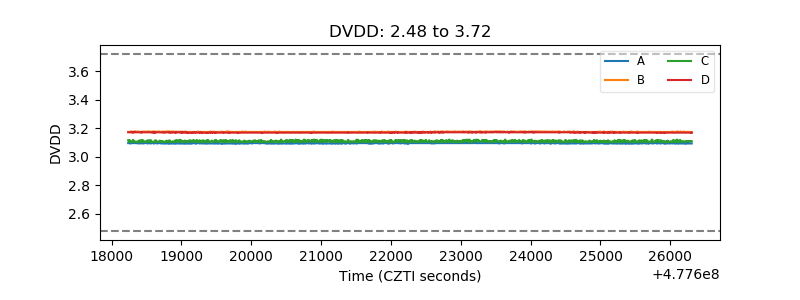 |
| Temperature 1 | 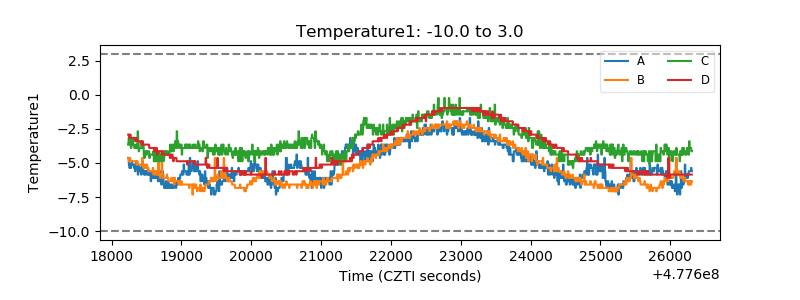 |
| Veto HV Monitor | 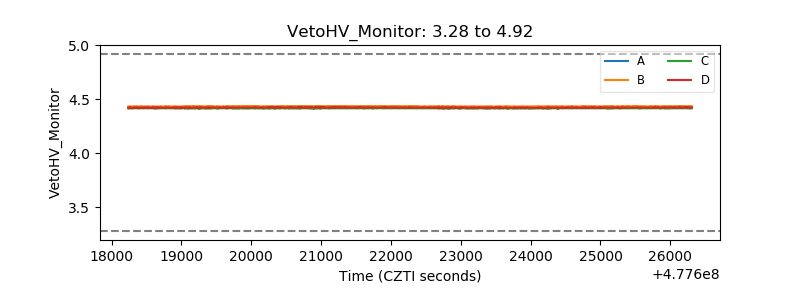 |
| Veto LLD | 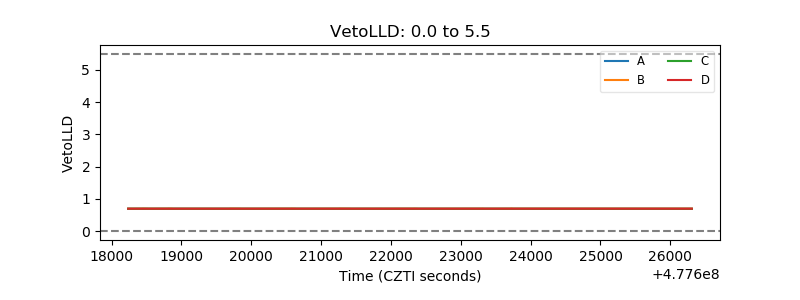 |
| Alpha Counter | 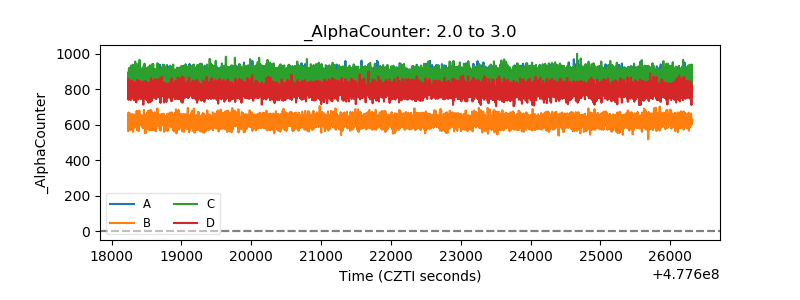 |
| _CPM_Rate | 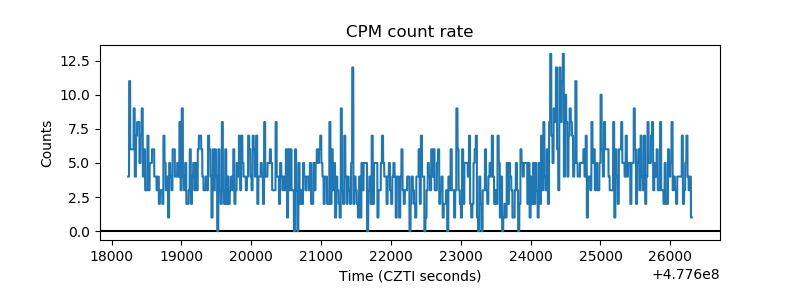 |
| CZT Counter | 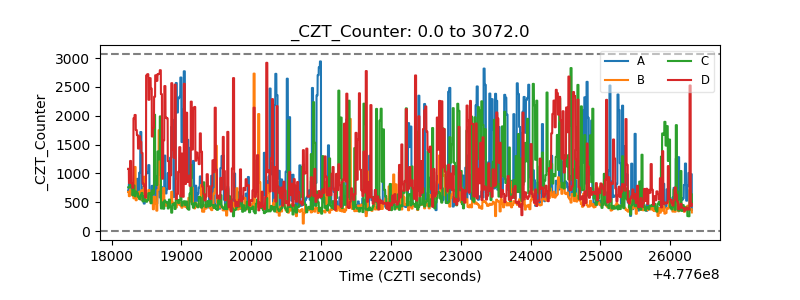 |
| +2.5 Volts monitor | 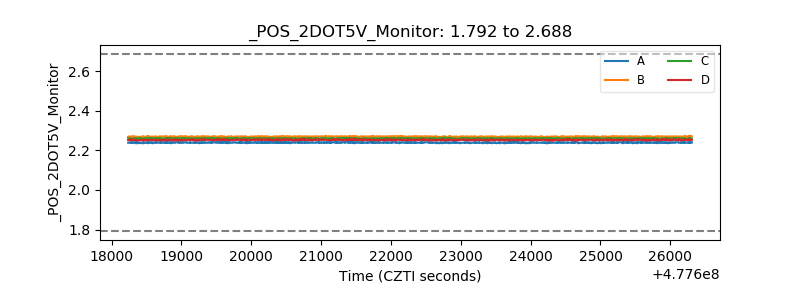 |
| +5 Volts monitor | 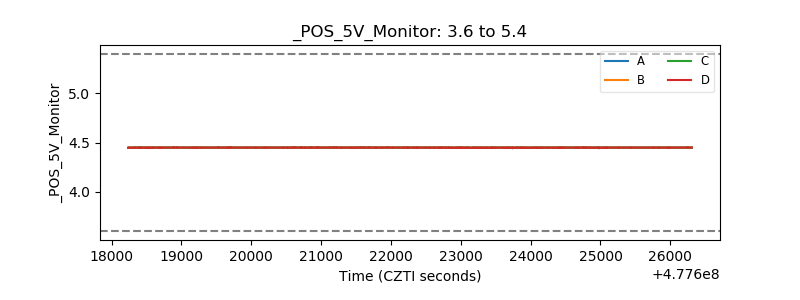 |
| _ROLL_ROT | 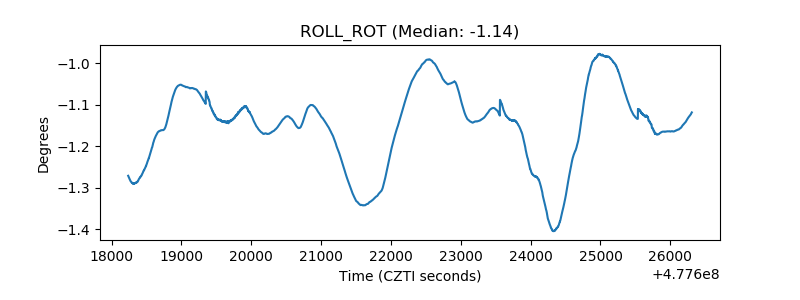 |
| _Roll_DEC | 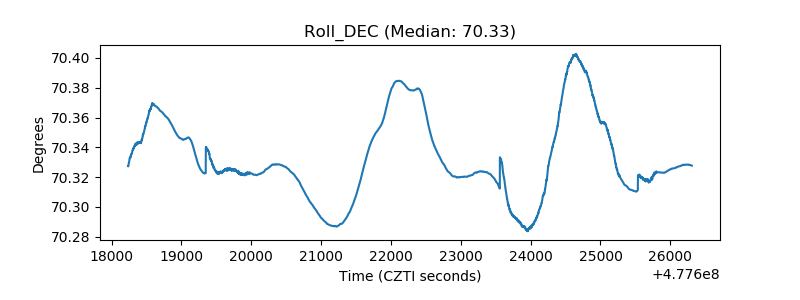 |
| _Roll_RA | 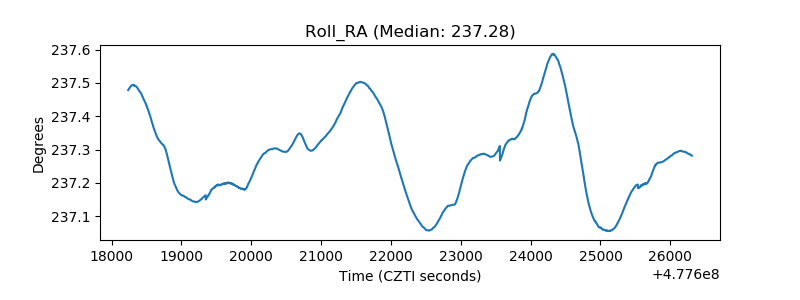 |
| Veto Counter | 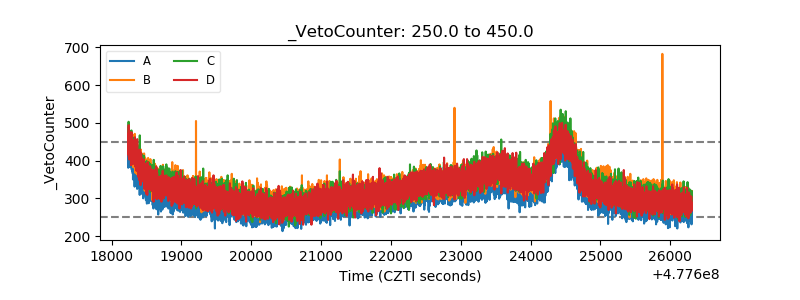 |