| Param | Original file | Final file |
|---|---|---|
| Filename | modeM0/AS1C07_001T01_9000006450_50912cztM0_level2.fits | modeM0/AS1C07_001T01_9000006450_50912cztM0_level2_quad_clean.evt |
| Size (bytes) | 688,541,760 | 80,144,640 |
| Size | 656.6 MB | 76.4 MB |
| Events in quadrant A | 13,071,782 | 231,913 |
| Events in quadrant B | 4,452,929 | 641,586 |
| Events in quadrant C | 3,748,986 | 576,503 |
| Events in quadrant D | 3,723,818 | 535,975 |
| Mode SS | |||
|---|---|---|---|
| Quadrant | BADHDUFLAG | Total packets | Discarded packets |
| A | 0 | 128 | 0 |
| B | 0 | 128 | 0 |
| C | 0 | 129 | 1 |
| D | 0 | 128 | 0 |
| Mode M0 | |||
|---|---|---|---|
| Quadrant | BADHDUFLAG | Total packets | Discarded packets |
| A | 0 | 43339 | 192 |
| B | 0 | 17883 | 164 |
| C | 0 | 15436 | 39 |
| D | 0 | 15762 | 47 |
| Mode M9 | |||
|---|---|---|---|
| Quadrant | BADHDUFLAG | Total packets | Discarded packets |
| A | 0 | 11 | 0 |
| B | 0 | 11 | 0 |
| C | 0 | 11 | 0 |
| D | 0 | 11 | 0 |
| Quadrant | Total seconds | Saturated seconds | Saturation percentage |
|---|---|---|---|
| A | 6309 | 4214 | 66.793470% |
| B | 6311 | 371 | 5.878625% |
| C | 6316 | 134 | 2.121596% |
| D | 6314 | 218 | 3.452645% |
Noise dominated data is calculated using 1-second bins in cleaned event files. If a bin has >2000 counts, and if more than 50% of those come from <1% of pixels, then it is considered to be noise-dominated and hence unusable.
| Quadrant | # 1 sec bins | Bins with >0 counts | Bins with >2000 counts | High rate bins dominated by noise | Noise dominated (total time) | Noise dominated (detector-on time) | Marked lightcurve |
|---|---|---|---|---|---|---|---|
| A | 7386 | 6311 | 3879 | 3879 | 52.52% | 61.46% | 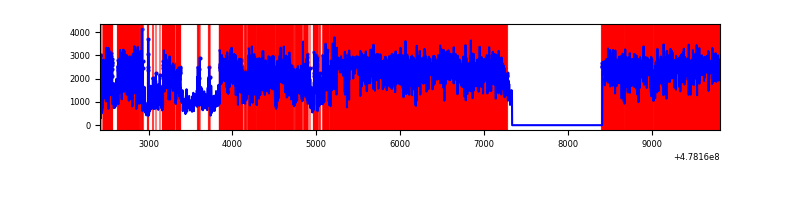 |
| B | 7389 | 6312 | 241 | 241 | 3.26% | 3.82% | 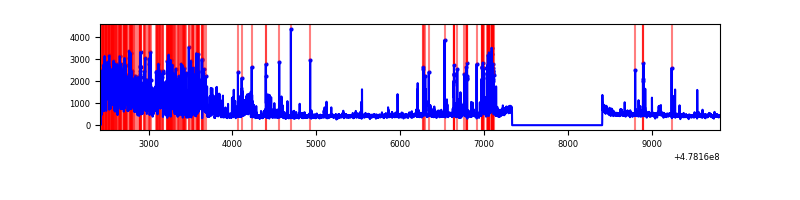 |
| C | 7392 | 6318 | 104 | 104 | 1.41% | 1.65% | 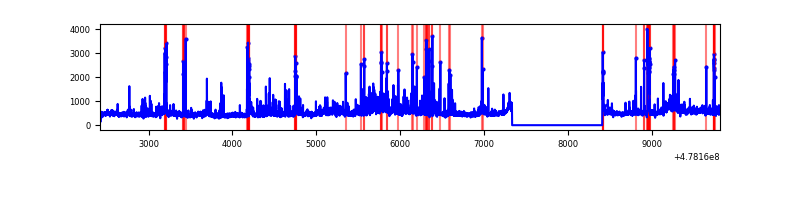 |
| D | 7389 | 6314 | 140 | 140 | 1.89% | 2.22% | 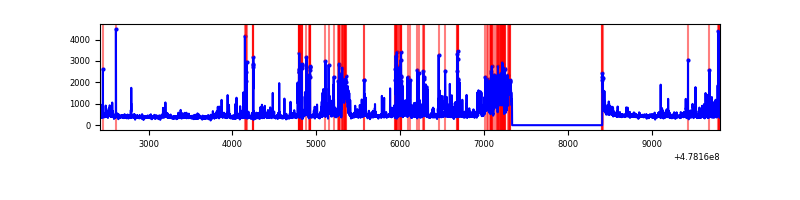 |
Top three noisy pixels from each quadrant. If the there are fewer than three noisy pixels in the level2.evt file, extra rows are filled as -1
| Pixel properties | Quadrant properties | ||||||
|---|---|---|---|---|---|---|---|
| Quadrant | DetID | PixID | Counts | Sigma | Mean | Median | Sigma |
| A | 4 | 4 | 9900427 | 73640.03 | 524 | 509 | 134.4 |
| A | 7 | 207 | 257525 | 1911.8 | 524 | 509 | 134.4 |
| A | 4 | 3 | 189872 | 1408.57 | 524 | 509 | 134.4 |
| B | 4 | 170 | 1346100 | 9630.32 | 655 | 632 | 139.7 |
| B | 7 | 252 | 179205 | 1278.15 | 655 | 632 | 139.7 |
| B | 10 | 247 | 69169 | 490.56 | 655 | 632 | 139.7 |
| C | 12 | 247 | 246181 | 1368.93 | 643 | 638 | 179.4 |
| C | 5 | 10 | 195399 | 1085.81 | 643 | 638 | 179.4 |
| C | 14 | 254 | 115611 | 640.99 | 643 | 638 | 179.4 |
| D | 7 | 45 | 334266 | 1886.16 | 636 | 611 | 176.9 |
| D | 2 | 249 | 285042 | 1607.9 | 636 | 611 | 176.9 |
| D | 10 | 24 | 130190 | 732.51 | 636 | 611 | 176.9 |
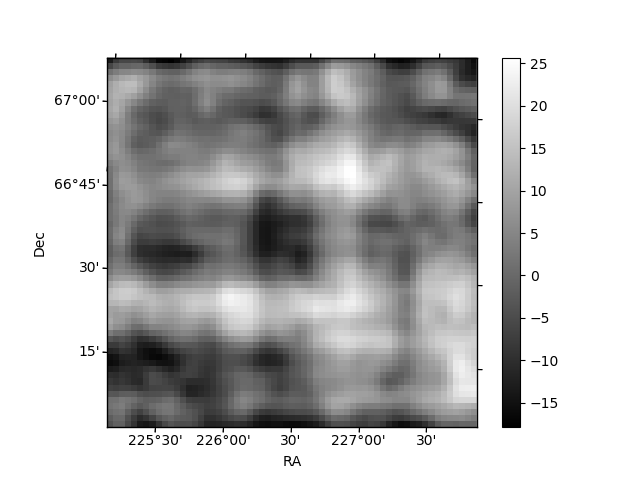
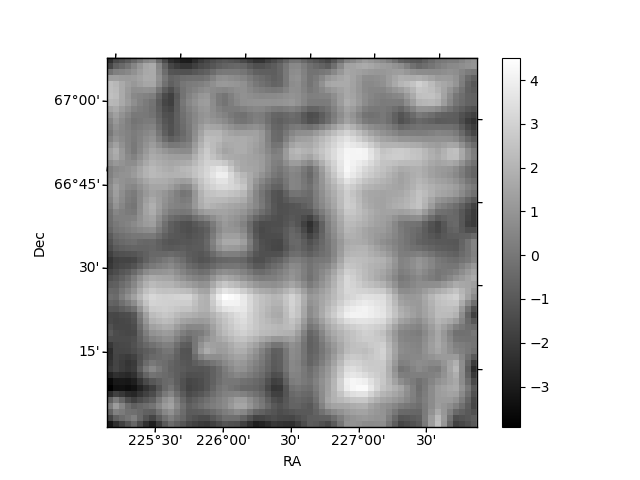
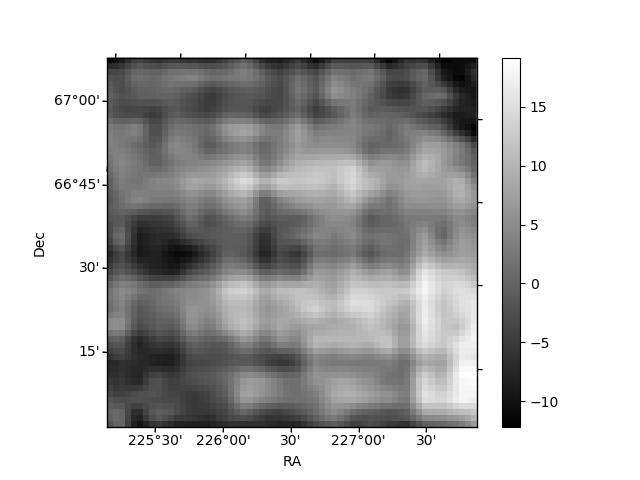
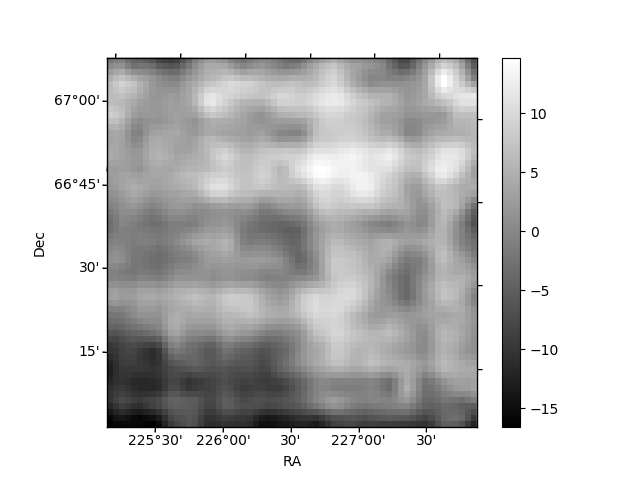
Histogram calculated using DETX and DETY for each event in the final _common_clean file
| Quadrant A | 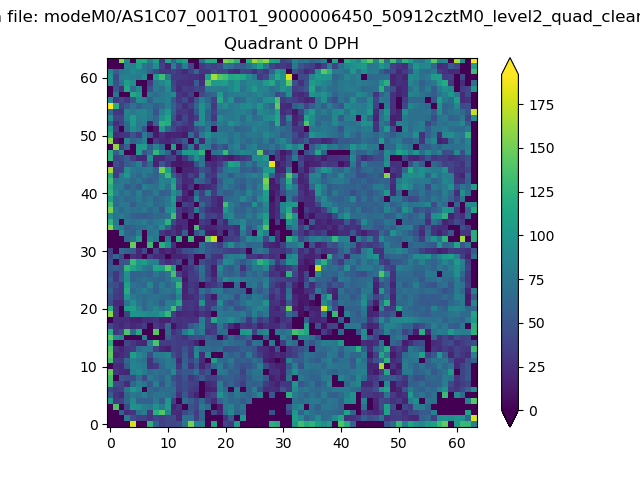 |
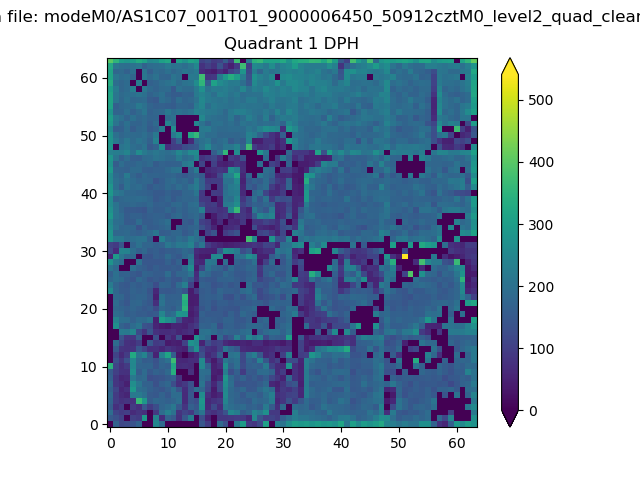 |
Quadrant B |
|---|---|---|---|
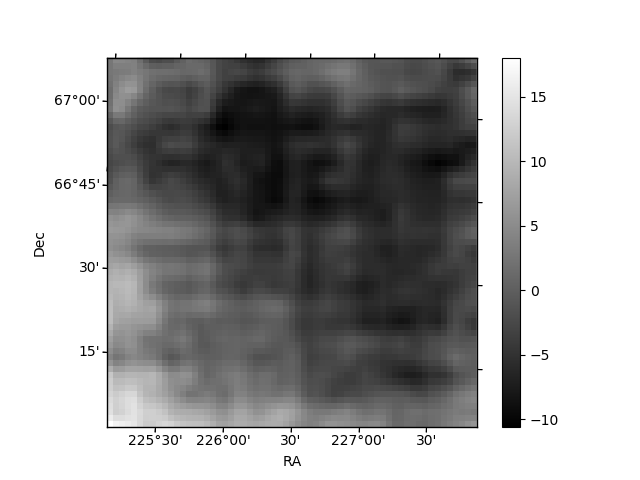
| Quadrant D | 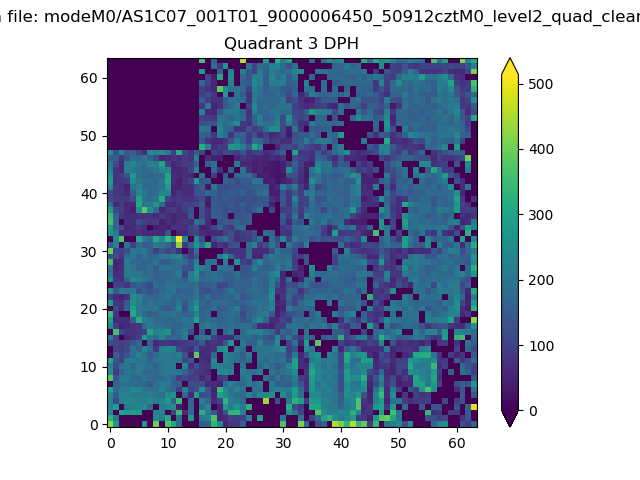 |
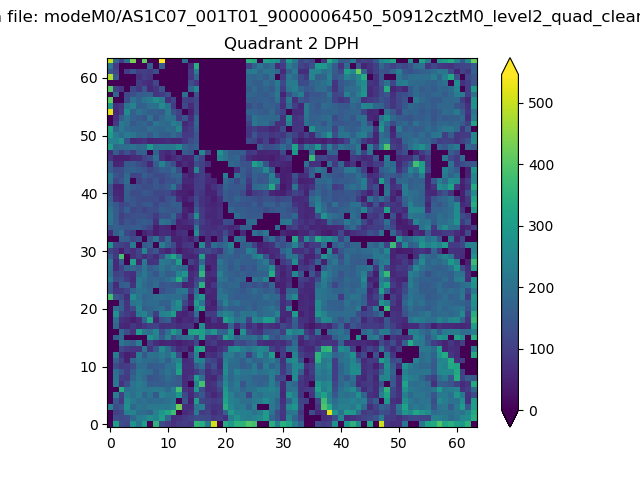 |
Quadrant C |
| Plot type | Count rate plots | Images |
|---|---|---|
| Comparison with Poisson distribution Blue bars denote a histogram of data divided into 1 sec bins. Red curve is a Poisson curve with rate = median count rate of data. |
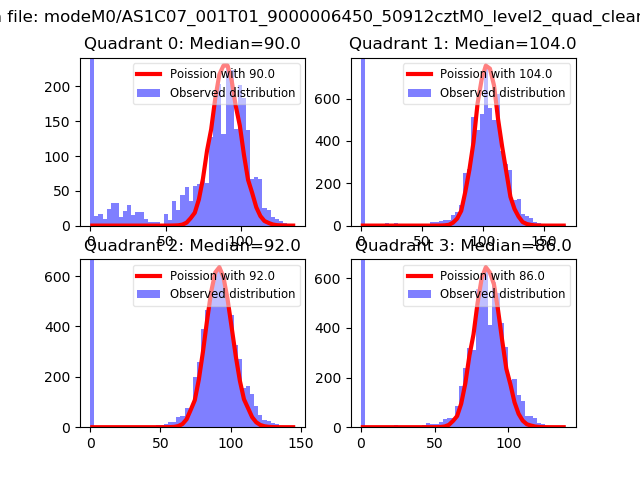 |
 |
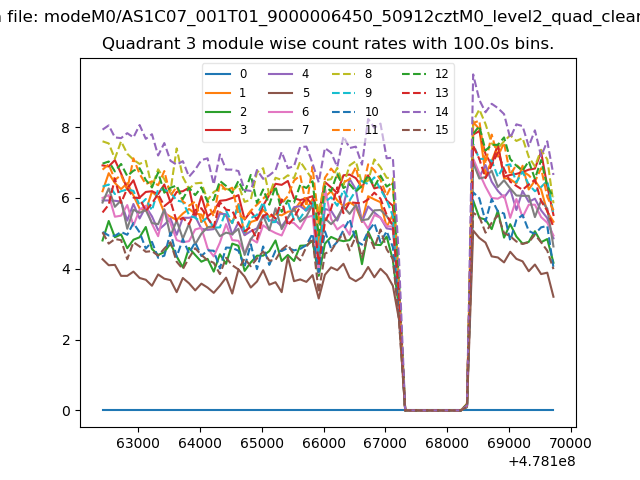
| Quadrant-wise count rates Data is divided into 100 sec bins |
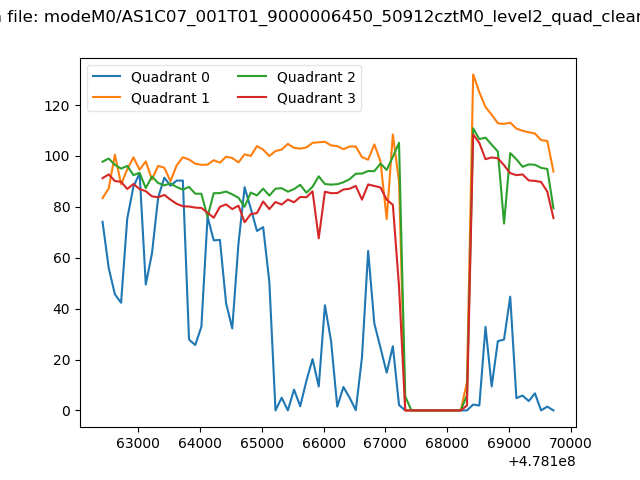 |
|
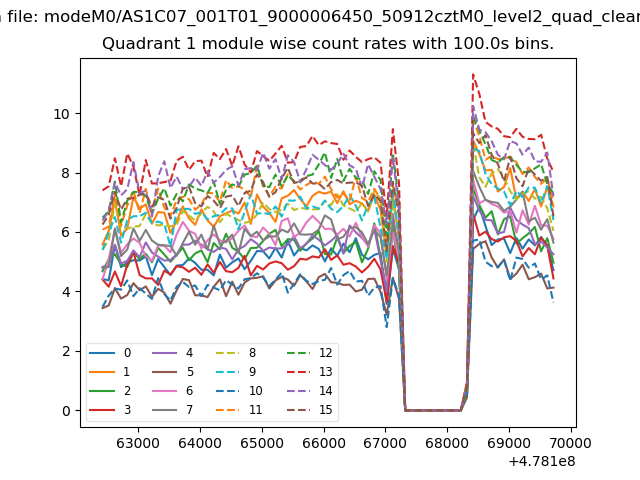
| Module-wise count rates for Quadrant A Data is divided into 100 sec bins |
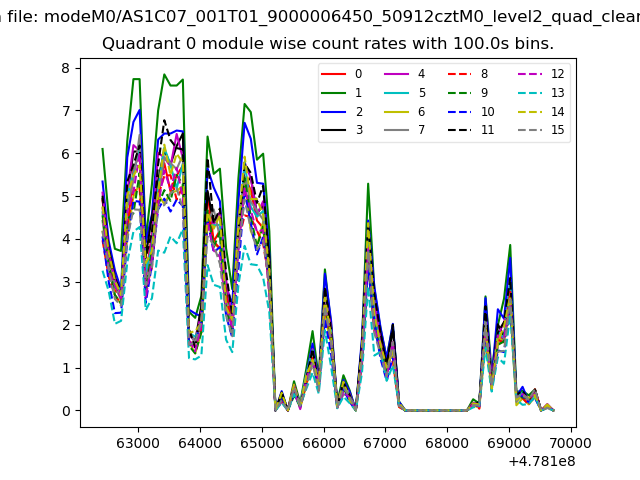 |
 |
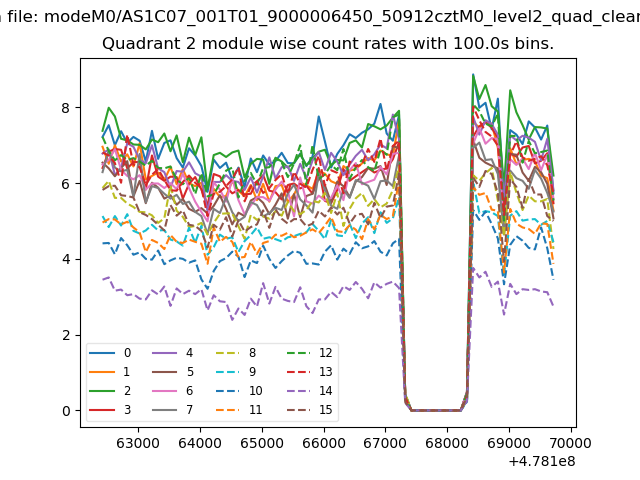
| Module-wise count rates for Quadrant B Data is divided into 100 sec bins |
 |
 |
| Module-wise count rates for Quadrant C Data is divided into 100 sec bins |
 |
 |
| Module-wise count rates for Quadrant D Data is divided into 100 sec bins |
 |
 |
| Parameter | Plot |
|---|---|
| CZT HV Monitor | 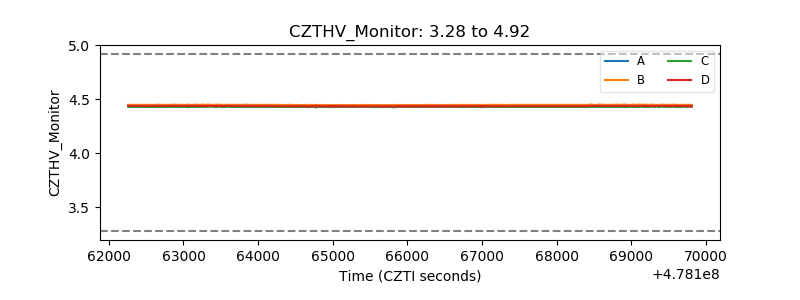 |
| D_VDD | 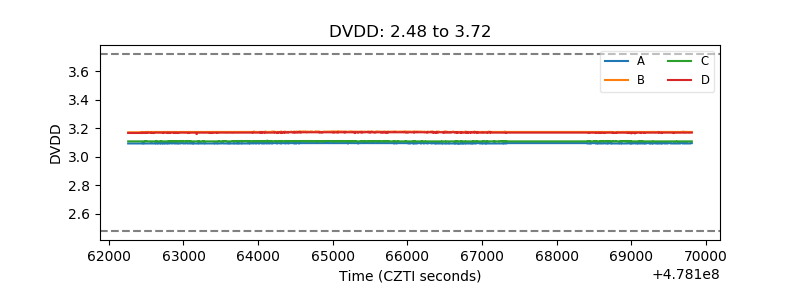 |
| Temperature 1 | 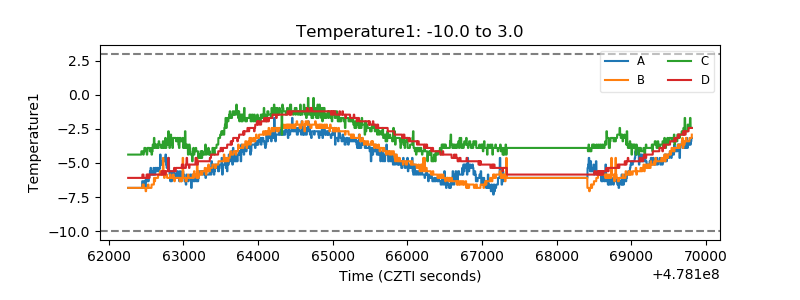 |
| Veto HV Monitor | 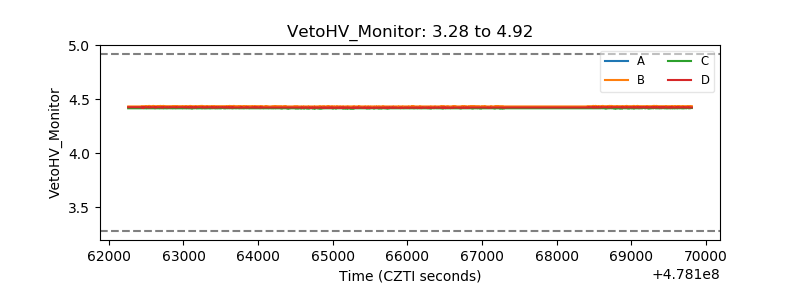 |
| Veto LLD | 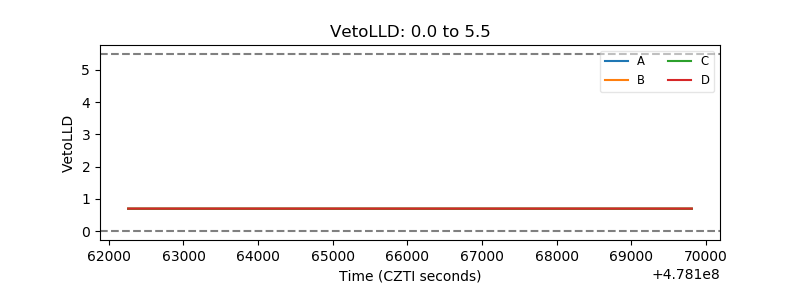 |
| Alpha Counter | 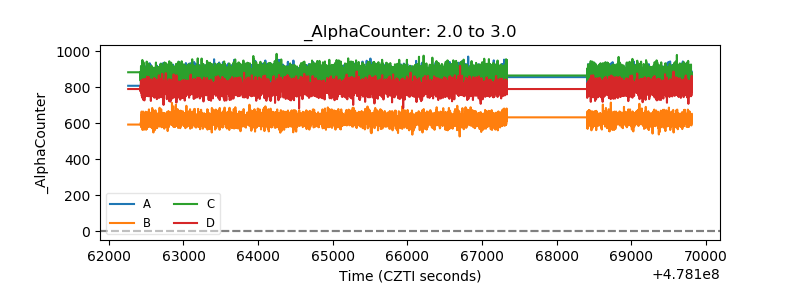 |
| _CPM_Rate | 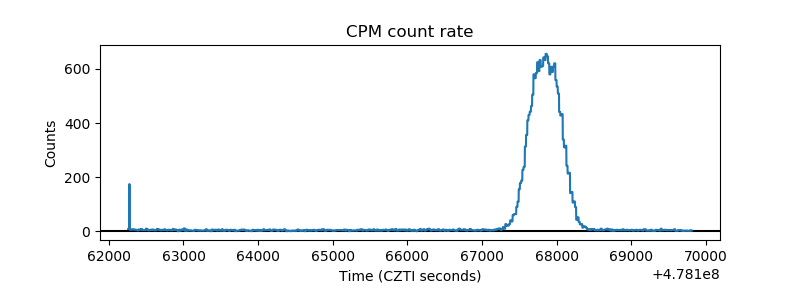 |
| CZT Counter | 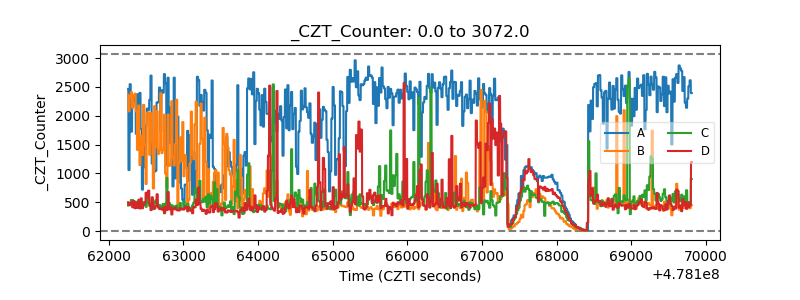 |
| +2.5 Volts monitor | 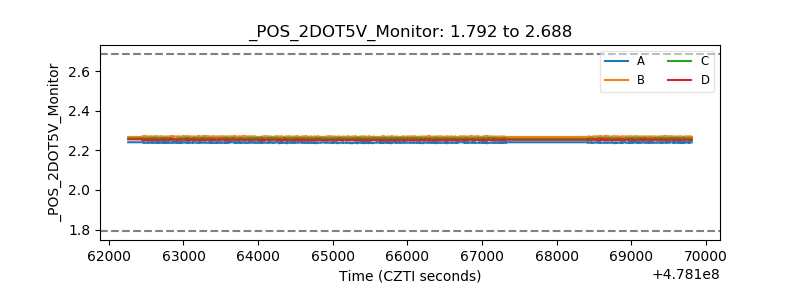 |
| +5 Volts monitor |  |
| _ROLL_ROT | 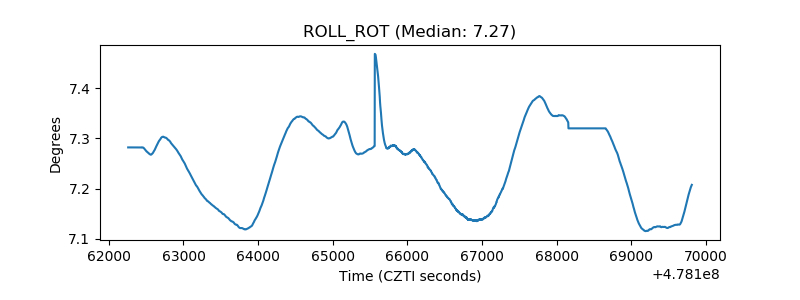 |
| _Roll_DEC | 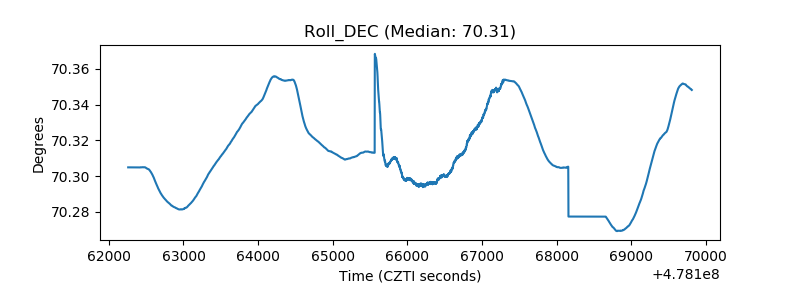 |
| _Roll_RA | 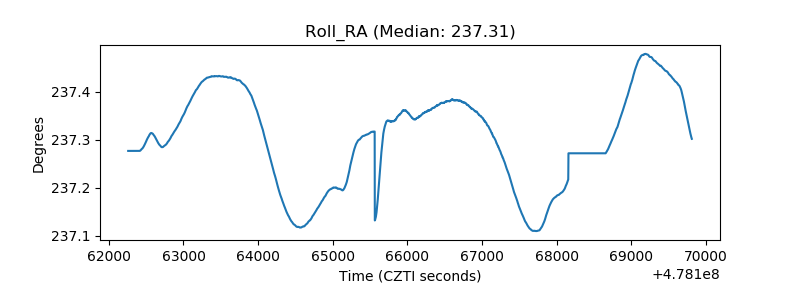 |
| Veto Counter | 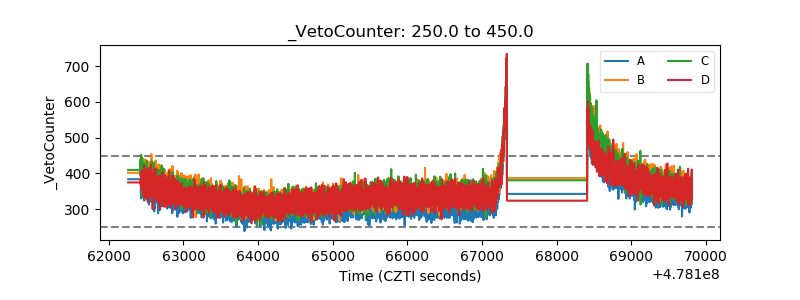 |