| Param | Original file | Final file |
|---|---|---|
| Filename | modeM0/AS1C07_001T01_9000006454_51179cztM0_level2.fits | modeM0/AS1C07_001T01_9000006454_51179cztM0_level2_quad_clean.evt |
| Size (bytes) | 800,634,240 | 95,711,040 |
| Size | 763.5 MB | 91.3 MB |
| Events in quadrant A | 7,638,675 | 592,925 |
| Events in quadrant B | 6,112,341 | 683,876 |
| Events in quadrant C | 9,230,664 | 570,081 |
| Events in quadrant D | 6,089,717 | 541,430 |
| Mode M0 | |||
|---|---|---|---|
| Quadrant | BADHDUFLAG | Total packets | Discarded packets |
| A | 0 | 27730 | 0 |
| B | 0 | 23302 | 0 |
| C | 0 | 32528 | 0 |
| D | 0 | 23551 | 0 |
| Mode SS | |||
|---|---|---|---|
| Quadrant | BADHDUFLAG | Total packets | Discarded packets |
| A | 0 | 146 | 0 |
| B | 0 | 146 | 0 |
| C | 0 | 146 | 0 |
| D | 0 | 146 | 0 |
| Quadrant | Total seconds | Saturated seconds | Saturation percentage |
|---|---|---|---|
| A | 7316 | 1026 | 14.024057% |
| B | 7317 | 715 | 9.771764% |
| C | 7317 | 1399 | 19.119858% |
| D | 7317 | 968 | 13.229466% |
Noise dominated data is calculated using 1-second bins in cleaned event files. If a bin has >2000 counts, and if more than 50% of those come from <1% of pixels, then it is considered to be noise-dominated and hence unusable.
| Quadrant | # 1 sec bins | Bins with >0 counts | Bins with >2000 counts | High rate bins dominated by noise | Noise dominated (total time) | Noise dominated (detector-on time) | Marked lightcurve |
|---|---|---|---|---|---|---|---|
| A | 7316 | 7316 | 629 | 629 | 8.60% | 8.60% |  |
| B | 7317 | 7317 | 393 | 393 | 5.37% | 5.37% | 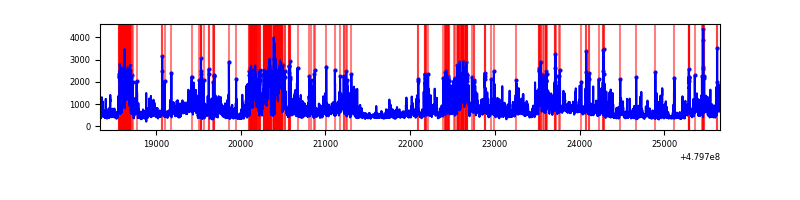 |
| C | 7317 | 7316 | 1425 | 1425 | 19.48% | 19.48% | 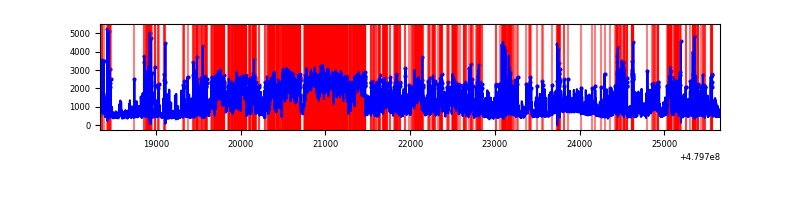 |
| D | 7317 | 7317 | 848 | 848 | 11.59% | 11.59% | 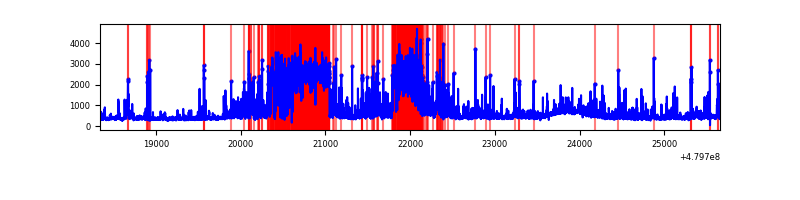 |
Top three noisy pixels from each quadrant. If the there are fewer than three noisy pixels in the level2.evt file, extra rows are filled as -1
| Pixel properties | Quadrant properties | ||||||
|---|---|---|---|---|---|---|---|
| Quadrant | DetID | PixID | Counts | Sigma | Mean | Median | Sigma |
| A | 7 | 206 | 1532178 | 8408.61 | 731 | 714 | 182.1 |
| A | 12 | 80 | 863462 | 4736.98 | 731 | 714 | 182.1 |
| A | 12 | 3 | 763368 | 4187.41 | 731 | 714 | 182.1 |
| B | 10 | 60 | 593803 | 3725.59 | 744 | 716 | 159.2 |
| B | 5 | 172 | 461965 | 2897.42 | 744 | 716 | 159.2 |
| B | 5 | 185 | 363361 | 2278.02 | 744 | 716 | 159.2 |
| C | 12 | 247 | 3384478 | 17470.43 | 705 | 697 | 193.7 |
| C | 4 | 12 | 1137509 | 5869.35 | 705 | 697 | 193.7 |
| C | 13 | 3 | 440317 | 2269.75 | 705 | 697 | 193.7 |
| D | 2 | 62 | 1356029 | 7026.37 | 697 | 673 | 192.9 |
| D | 2 | 172 | 692513 | 3586.61 | 697 | 673 | 192.9 |
| D | 8 | 176 | 333830 | 1727.14 | 697 | 673 | 192.9 |
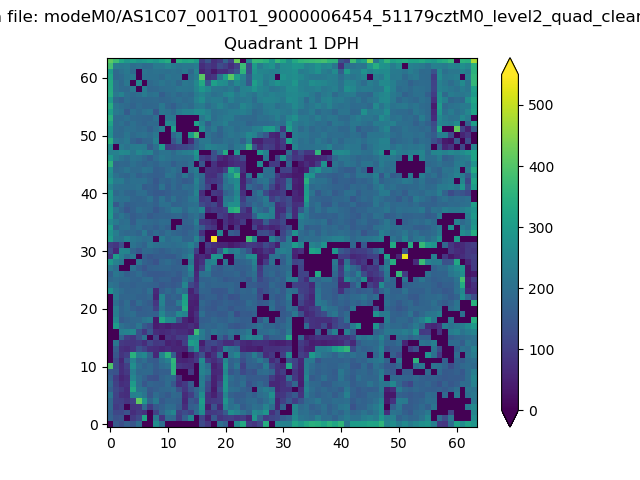
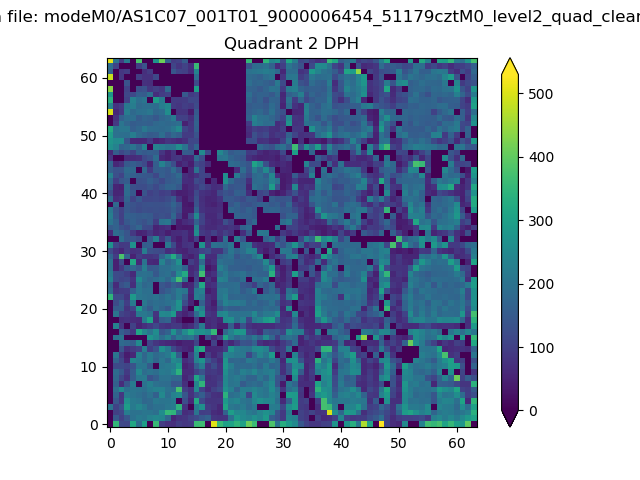
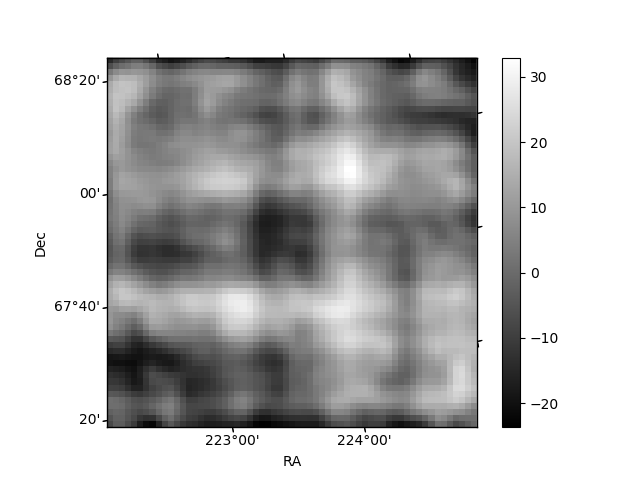
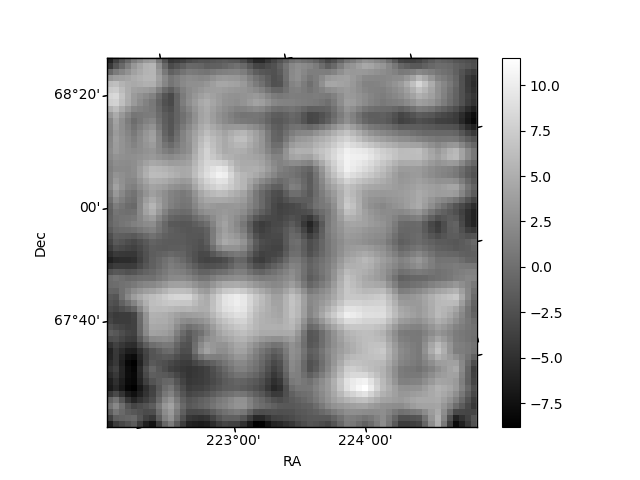
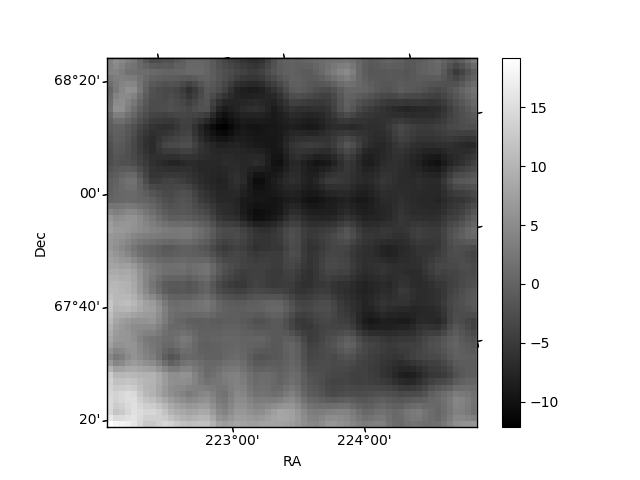
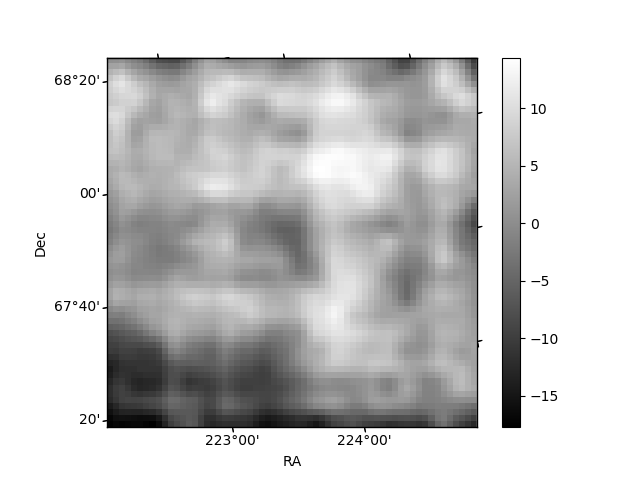
Histogram calculated using DETX and DETY for each event in the final _common_clean file
| Quadrant A | 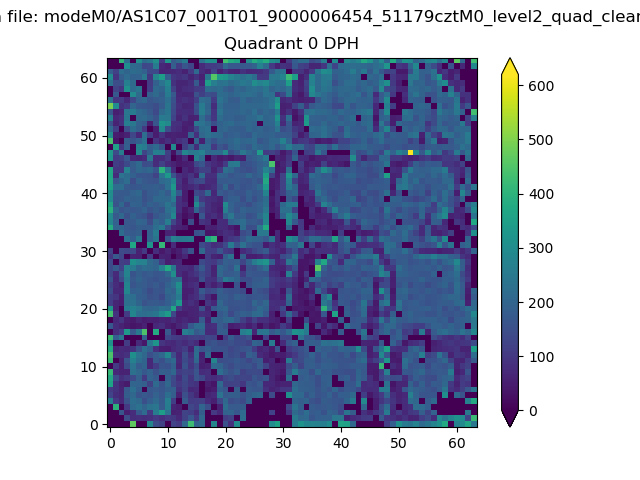 |
 |
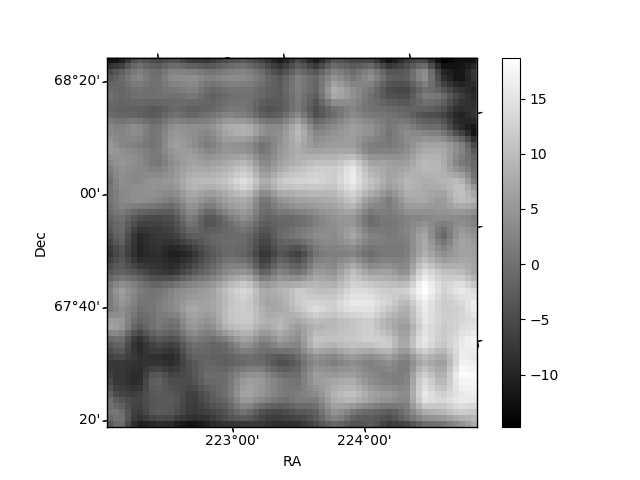
Quadrant B |
|---|---|---|---|
| Quadrant D | 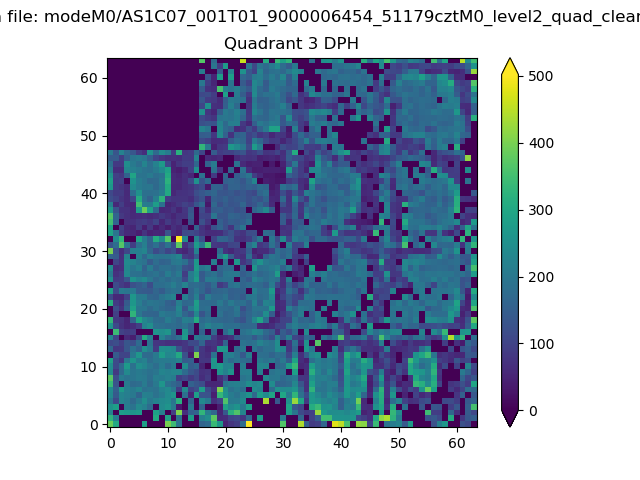 |
 |
Quadrant C |
| Plot type | Count rate plots | Images |
|---|---|---|
| Comparison with Poisson distribution Blue bars denote a histogram of data divided into 1 sec bins. Red curve is a Poisson curve with rate = median count rate of data. |
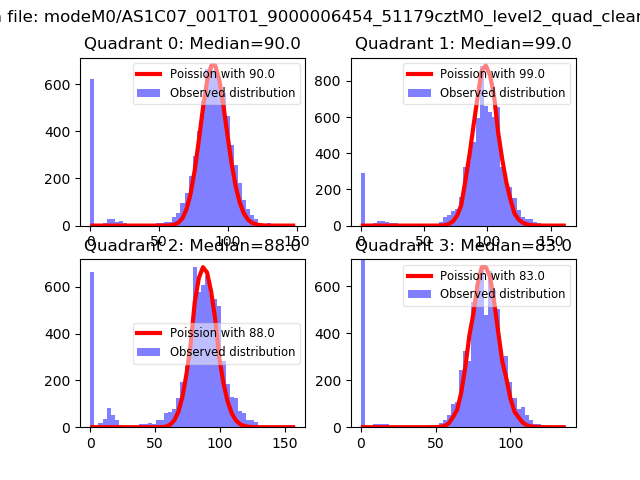 |
 |
| Quadrant-wise count rates Data is divided into 100 sec bins |
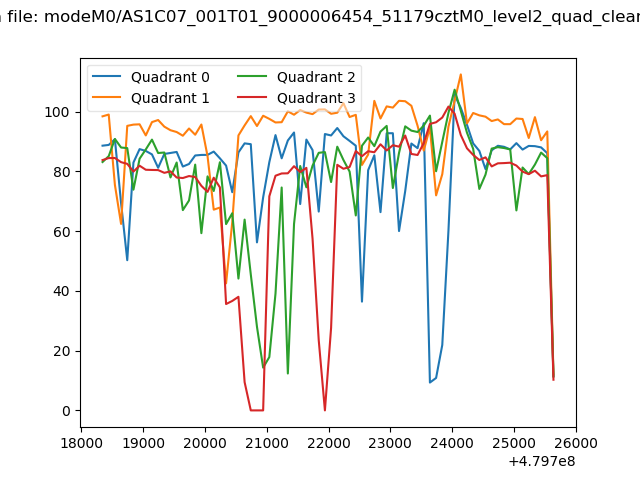 |
|
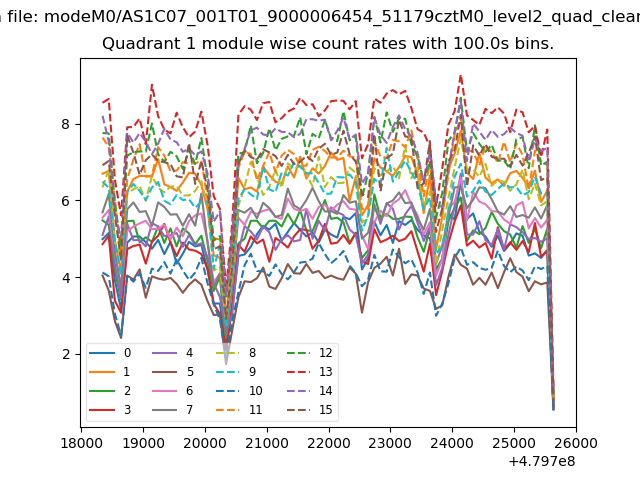
| Module-wise count rates for Quadrant A Data is divided into 100 sec bins |
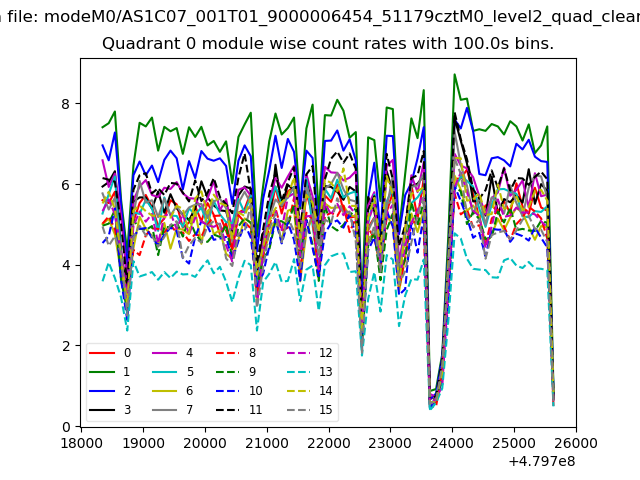 |
 |
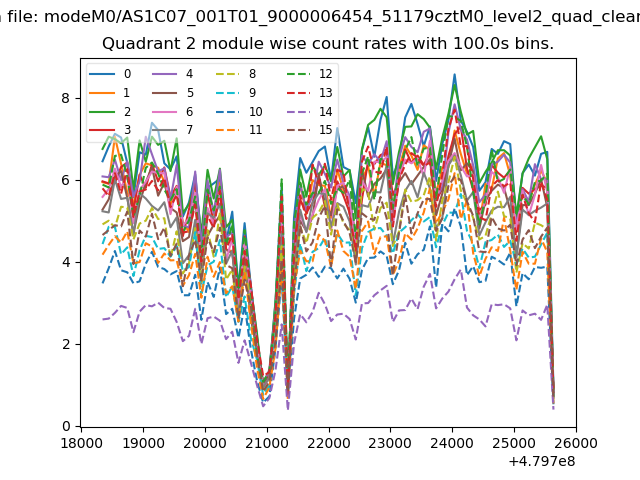
| Module-wise count rates for Quadrant B Data is divided into 100 sec bins |
 |
 |
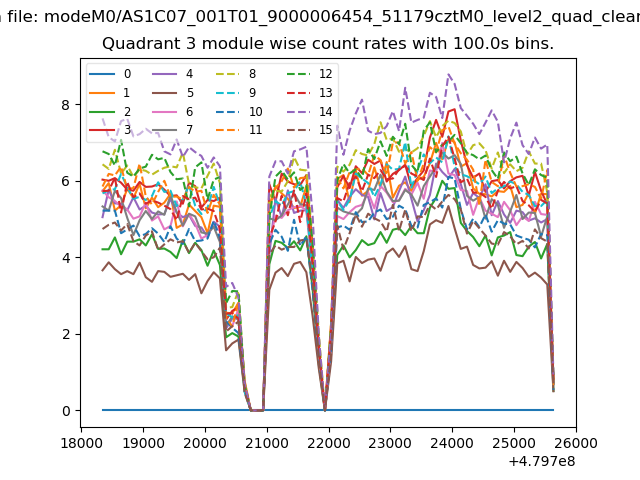
| Module-wise count rates for Quadrant C Data is divided into 100 sec bins |
 |
 |
| Module-wise count rates for Quadrant D Data is divided into 100 sec bins |
 |
 |
| Parameter | Plot |
|---|---|
| CZT HV Monitor | 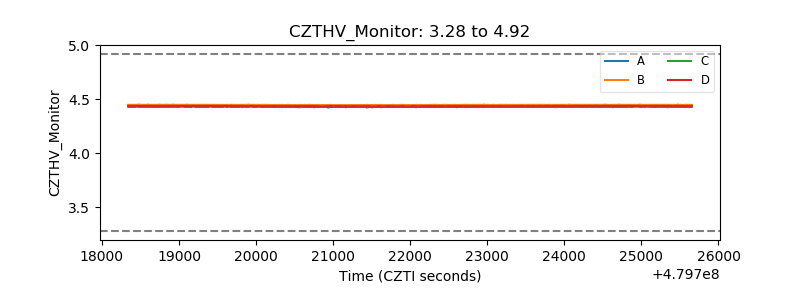 |
| D_VDD | 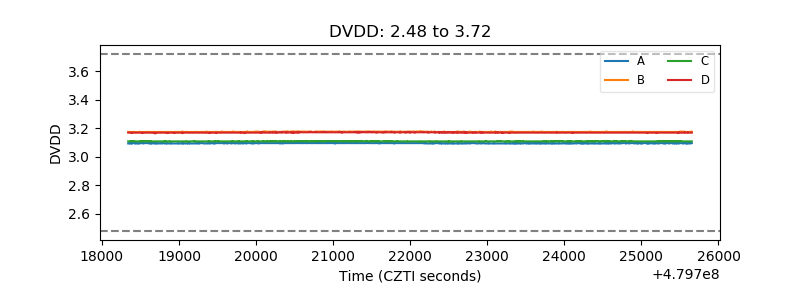 |
| Temperature 1 | 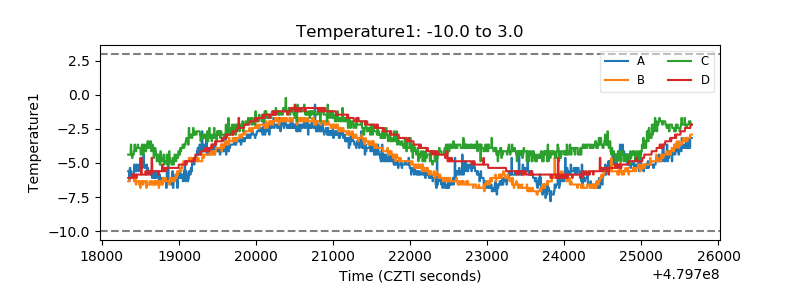 |
| Veto HV Monitor | 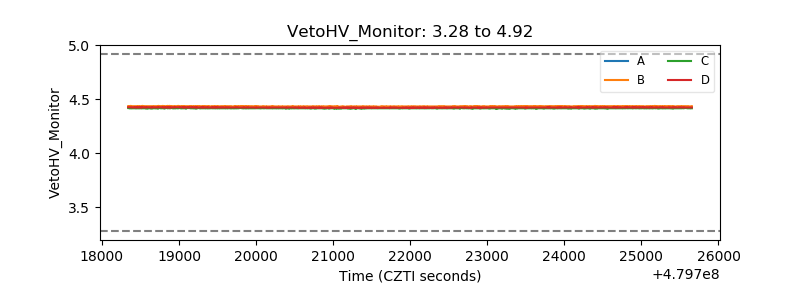 |
| Veto LLD | 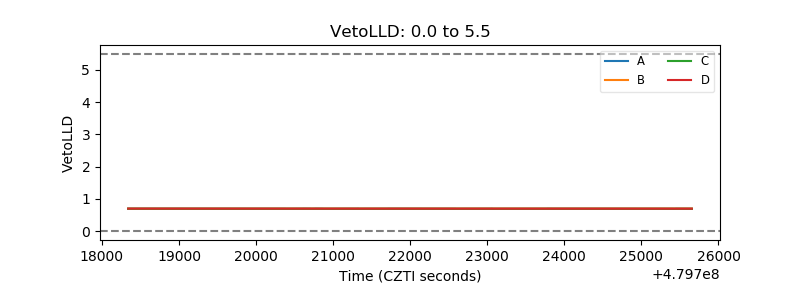 |
| Alpha Counter | 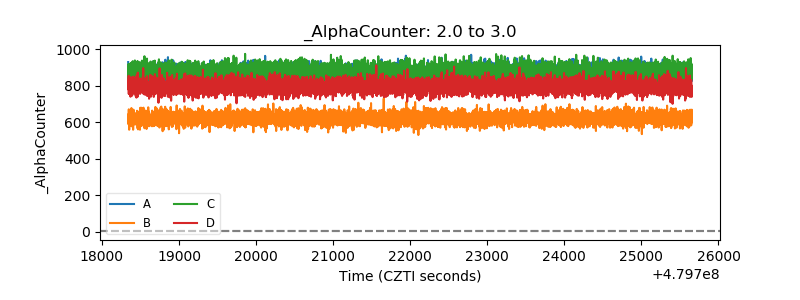 |
| _CPM_Rate | 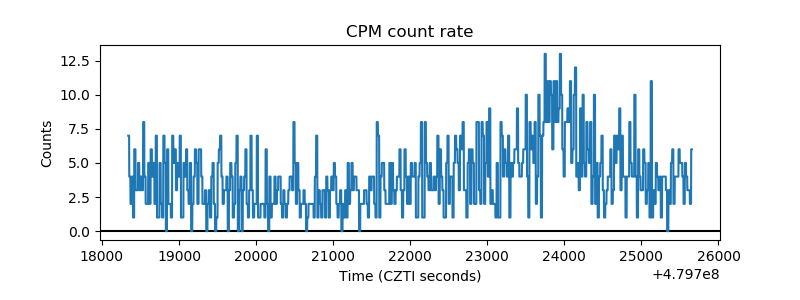 |
| CZT Counter | 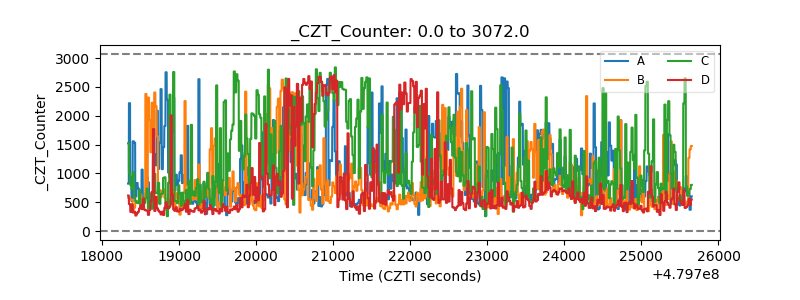 |
| +2.5 Volts monitor | 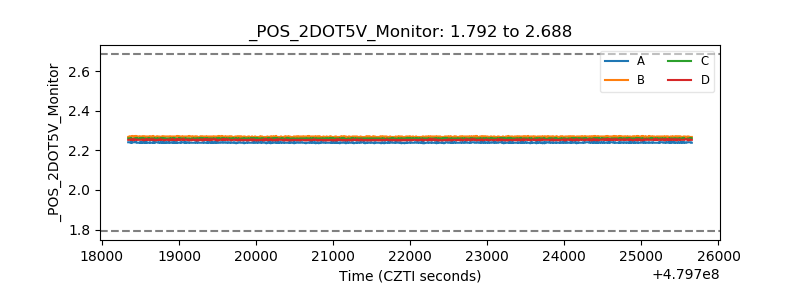 |
| +5 Volts monitor | 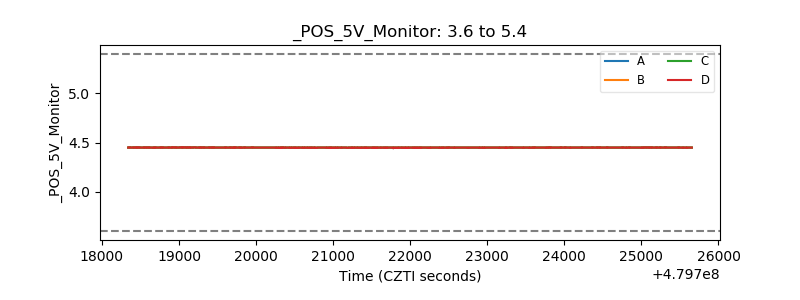 |
| _ROLL_ROT | 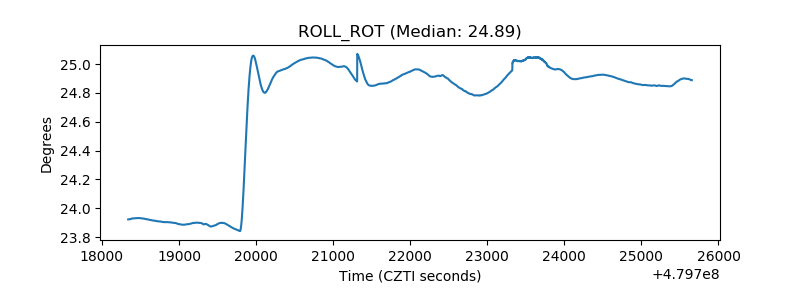 |
| _Roll_DEC | 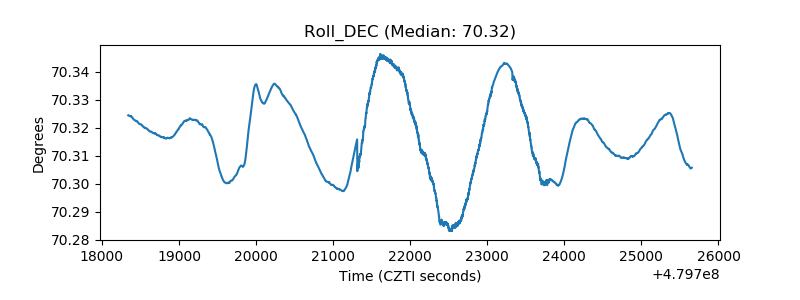 |
| _Roll_RA | 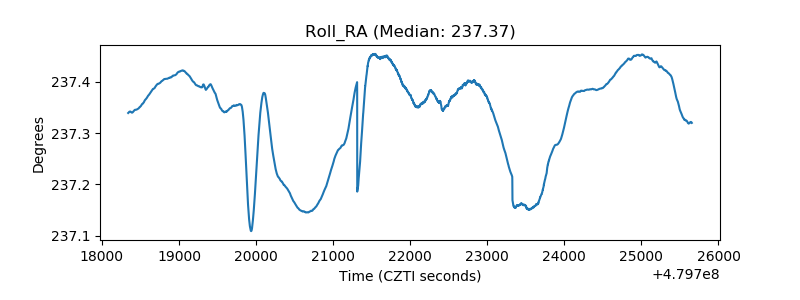 |
| Veto Counter | 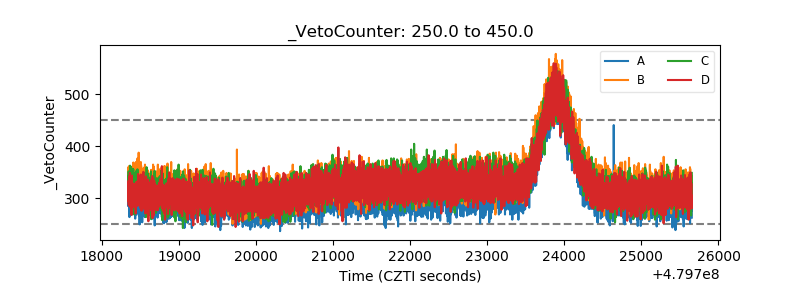 |