| Param | Original file | Final file |
|---|---|---|
| Filename | modeM0/AS1C07_001T01_9000006454_51223cztM0_level2.fits | modeM0/AS1C07_001T01_9000006454_51223cztM0_level2_quad_clean.evt |
| Size (bytes) | 648,279,360 | 94,199,040 |
| Size | 618.2 MB | 89.8 MB |
| Events in quadrant A | 6,603,608 | 593,839 |
| Events in quadrant B | 5,640,518 | 662,113 |
| Events in quadrant C | 7,040,845 | 528,097 |
| Events in quadrant D | 4,167,863 | 578,654 |
| Mode M0 | |||
|---|---|---|---|
| Quadrant | BADHDUFLAG | Total packets | Discarded packets |
| A | 0 | 24576 | 0 |
| B | 0 | 21671 | 0 |
| C | 0 | 25773 | 0 |
| D | 0 | 17531 | 0 |
| Mode SS | |||
|---|---|---|---|
| Quadrant | BADHDUFLAG | Total packets | Discarded packets |
| A | 0 | 140 | 0 |
| B | 0 | 140 | 0 |
| C | 0 | 140 | 0 |
| D | 0 | 140 | 0 |
| Quadrant | Total seconds | Saturated seconds | Saturation percentage |
|---|---|---|---|
| A | 7027 | 677 | 9.634268% |
| B | 7027 | 584 | 8.310801% |
| C | 7027 | 1325 | 18.855842% |
| D | 7027 | 185 | 2.632702% |
Noise dominated data is calculated using 1-second bins in cleaned event files. If a bin has >2000 counts, and if more than 50% of those come from <1% of pixels, then it is considered to be noise-dominated and hence unusable.
| Quadrant | # 1 sec bins | Bins with >0 counts | Bins with >2000 counts | High rate bins dominated by noise | Noise dominated (total time) | Noise dominated (detector-on time) | Marked lightcurve |
|---|---|---|---|---|---|---|---|
| A | 7027 | 7027 | 472 | 472 | 6.72% | 6.72% | 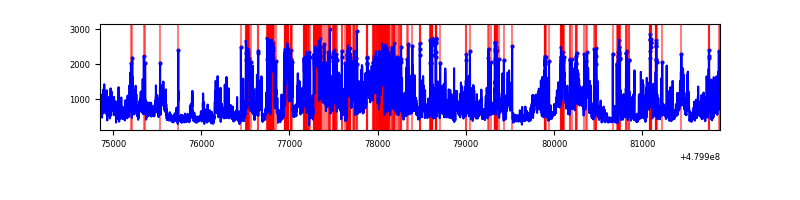 |
| B | 7027 | 7027 | 390 | 390 | 5.55% | 5.55% | 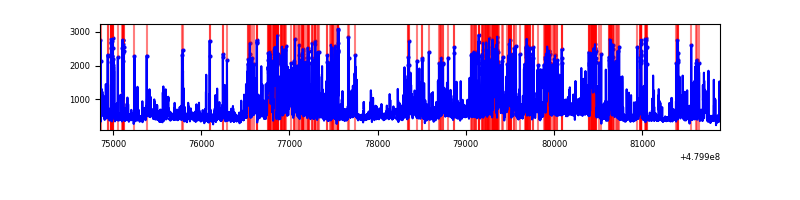 |
| C | 7027 | 7027 | 1168 | 1168 | 16.62% | 16.62% | 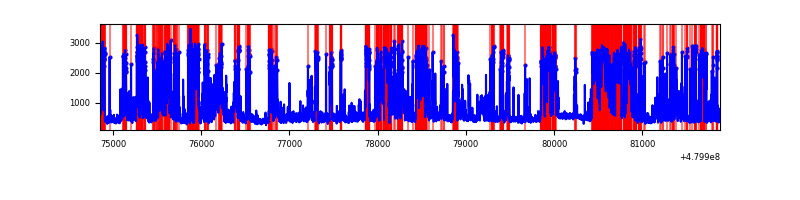 |
| D | 7027 | 7027 | 194 | 194 | 2.76% | 2.76% | 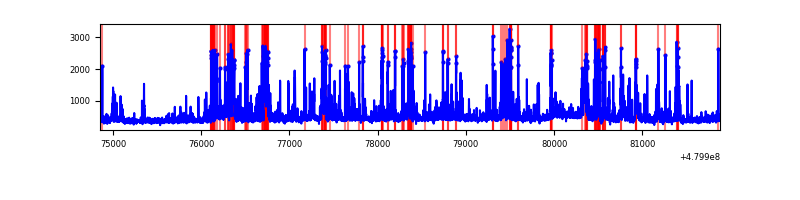 |
Top three noisy pixels from each quadrant. If the there are fewer than three noisy pixels in the level2.evt file, extra rows are filled as -1
| Pixel properties | Quadrant properties | ||||||
|---|---|---|---|---|---|---|---|
| Quadrant | DetID | PixID | Counts | Sigma | Mean | Median | Sigma |
| A | 12 | 3 | 1416051 | 8168.13 | 697 | 678 | 173.3 |
| A | 7 | 206 | 766138 | 4417.48 | 697 | 678 | 173.3 |
| A | 8 | 26 | 531932 | 3065.87 | 697 | 678 | 173.3 |
| B | 5 | 185 | 1368942 | 9090.63 | 702 | 677 | 150.5 |
| B | 5 | 172 | 268191 | 1777.34 | 702 | 677 | 150.5 |
| B | 10 | 247 | 255582 | 1693.57 | 702 | 677 | 150.5 |
| C | 4 | 12 | 2165660 | 12614.93 | 624 | 619 | 171.6 |
| C | 1 | 60 | 1340787 | 7808.68 | 624 | 619 | 171.6 |
| C | 13 | 3 | 335303 | 1950.09 | 624 | 619 | 171.6 |
| D | 8 | 176 | 361208 | 1853.46 | 690 | 665 | 194.5 |
| D | 10 | 172 | 341364 | 1751.45 | 690 | 665 | 194.5 |
| D | 3 | 12 | 183958 | 942.26 | 690 | 665 | 194.5 |
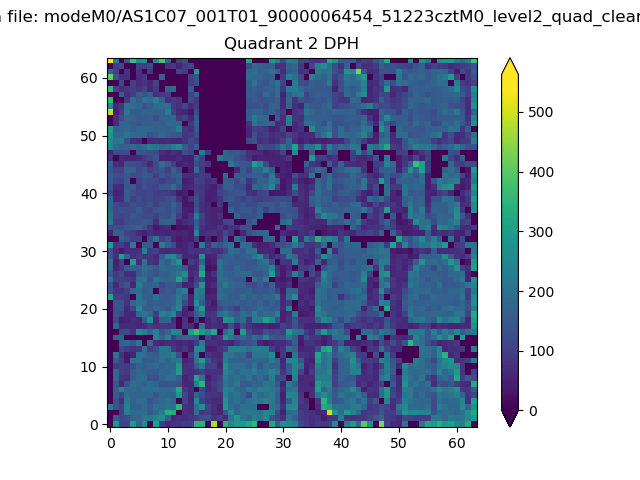
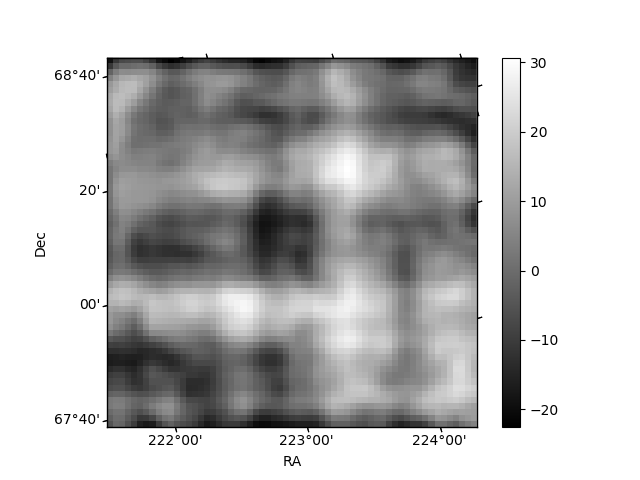
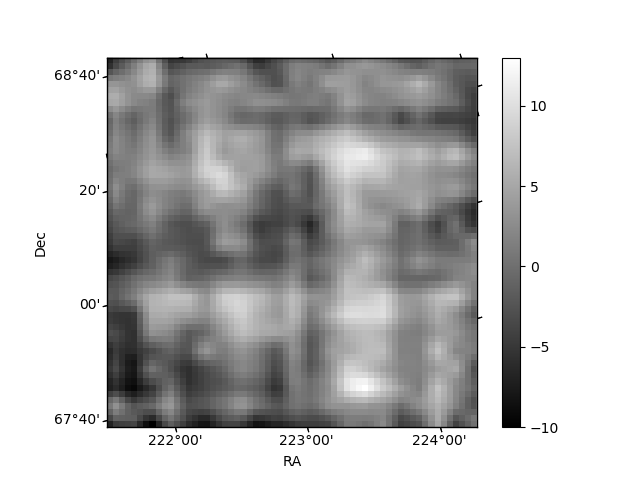
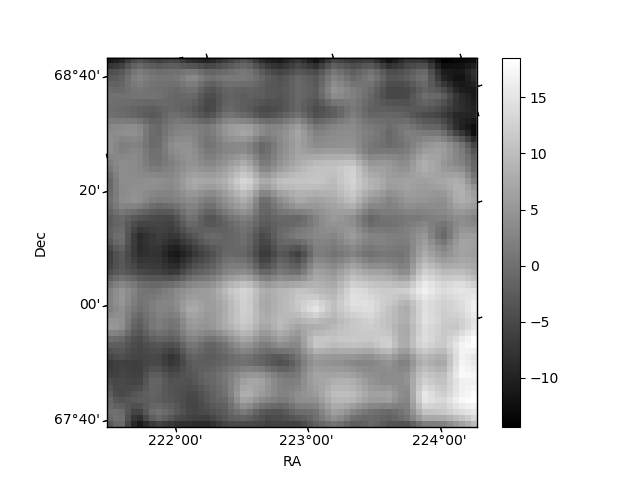
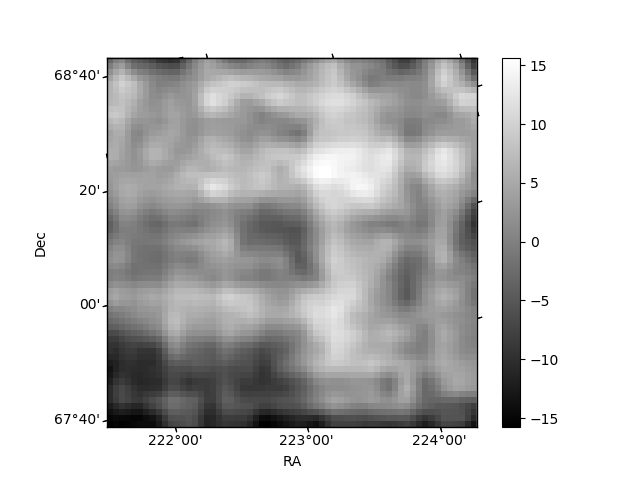
Histogram calculated using DETX and DETY for each event in the final _common_clean file
| Quadrant A | 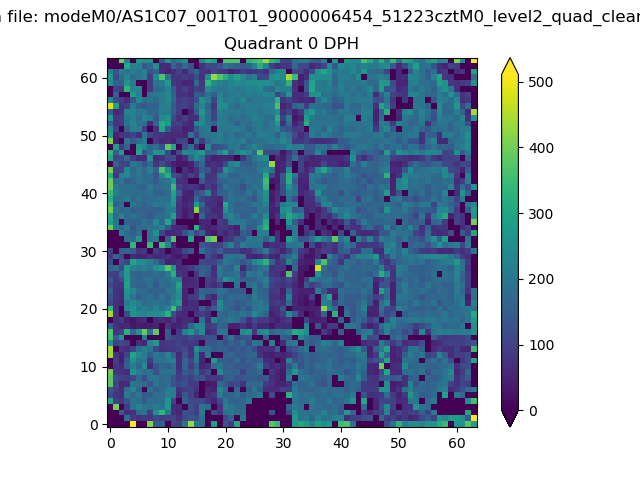 |
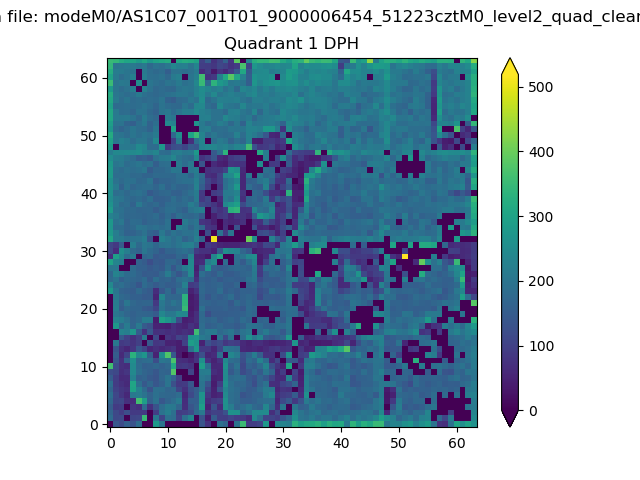 |
Quadrant B |
|---|---|---|---|
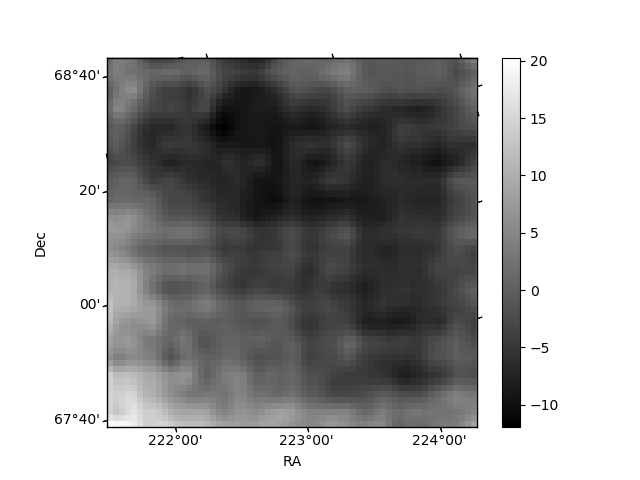
| Quadrant D | 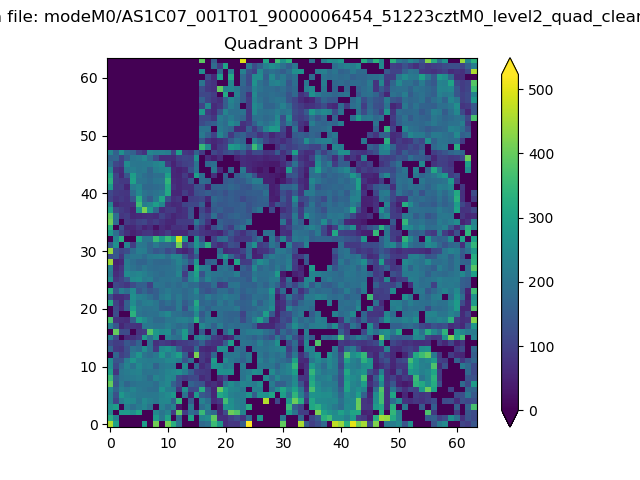 |
 |
Quadrant C |
| Plot type | Count rate plots | Images |
|---|---|---|
| Comparison with Poisson distribution Blue bars denote a histogram of data divided into 1 sec bins. Red curve is a Poisson curve with rate = median count rate of data. |
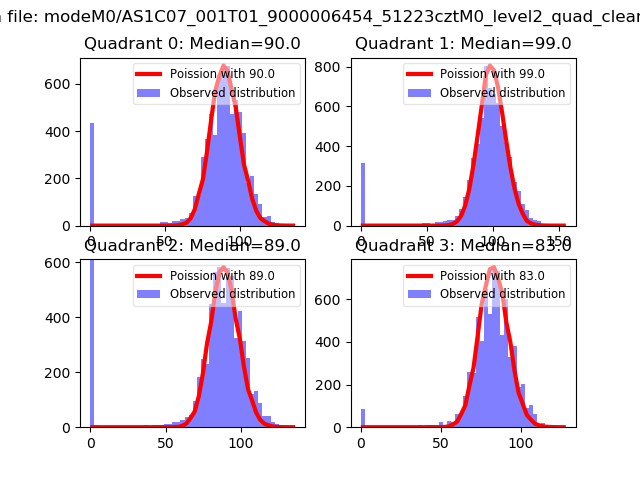 |
 |
| Quadrant-wise count rates Data is divided into 100 sec bins |
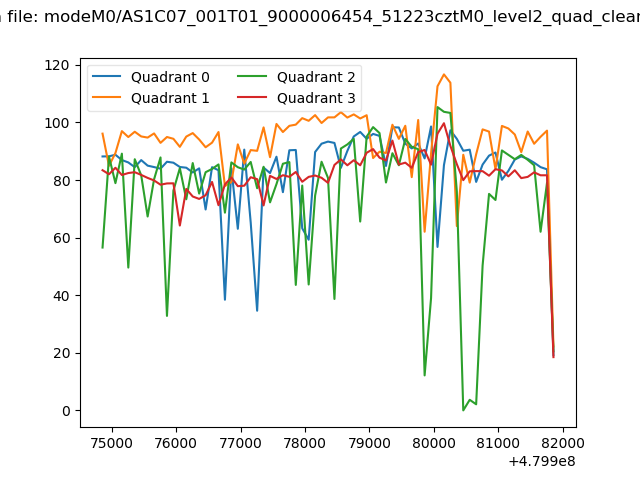 |
|
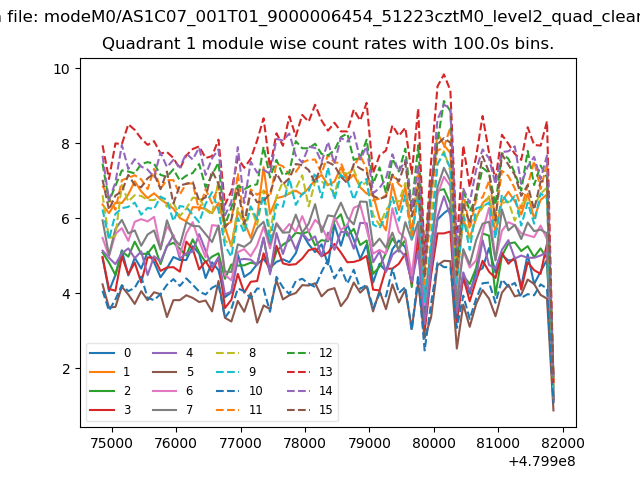
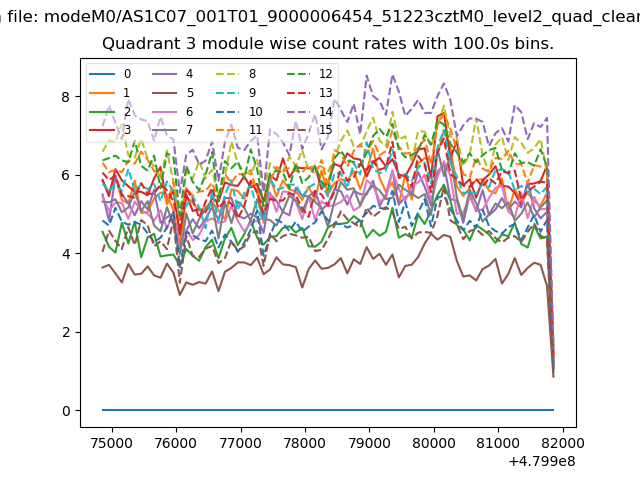
| Module-wise count rates for Quadrant A Data is divided into 100 sec bins |
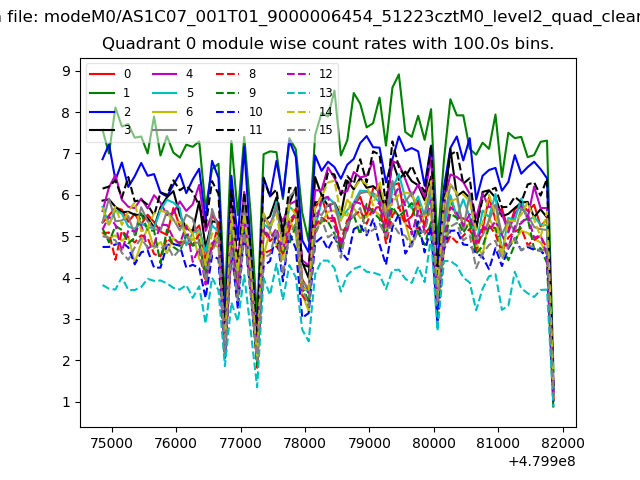 |
 |
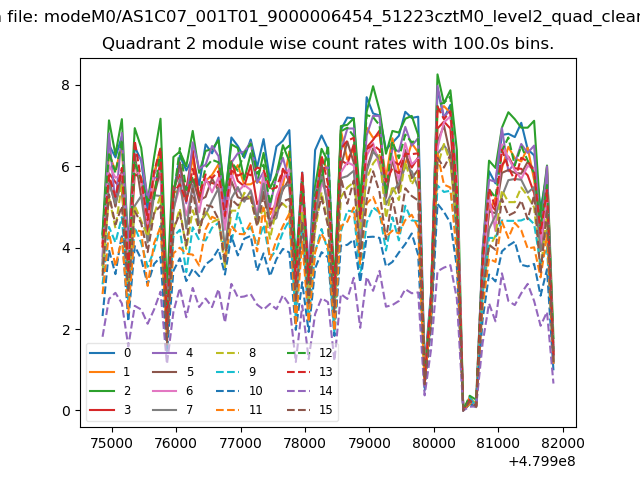
| Module-wise count rates for Quadrant B Data is divided into 100 sec bins |
 |
 |
| Module-wise count rates for Quadrant C Data is divided into 100 sec bins |
 |
 |
| Module-wise count rates for Quadrant D Data is divided into 100 sec bins |
 |
 |
| Parameter | Plot |
|---|---|
| CZT HV Monitor | 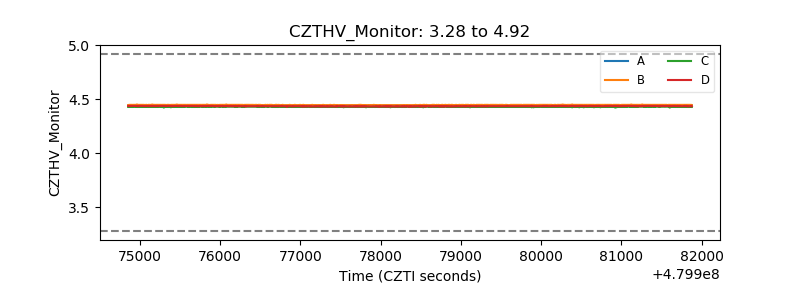 |
| D_VDD | 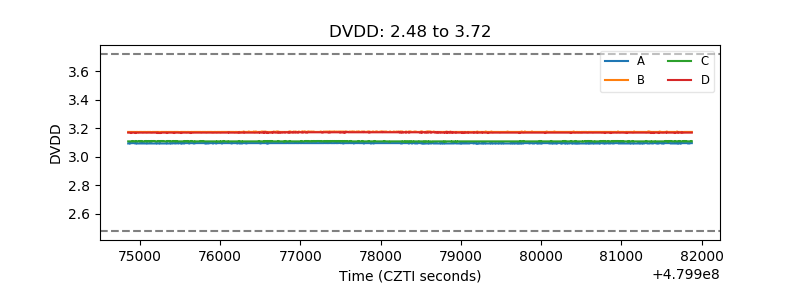 |
| Temperature 1 | 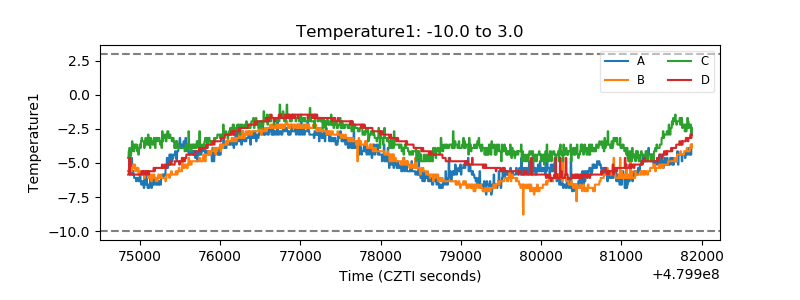 |
| Veto HV Monitor |  |
| Veto LLD | 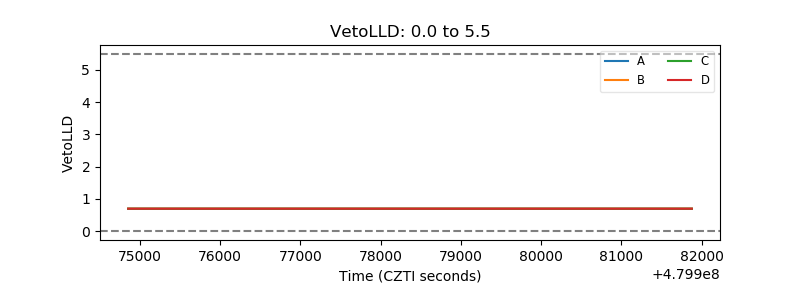 |
| Alpha Counter | 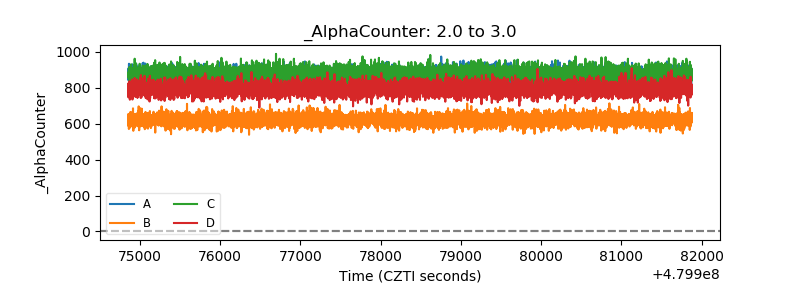 |
| _CPM_Rate | 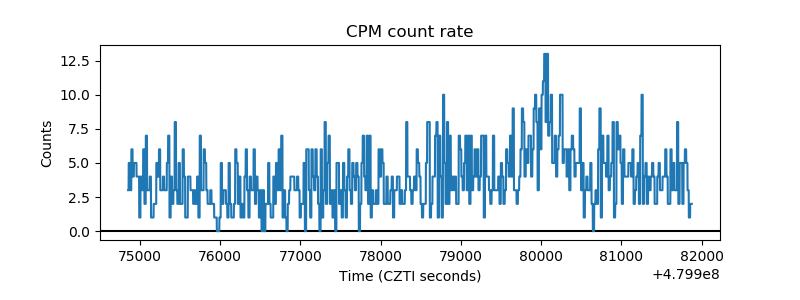 |
| CZT Counter | 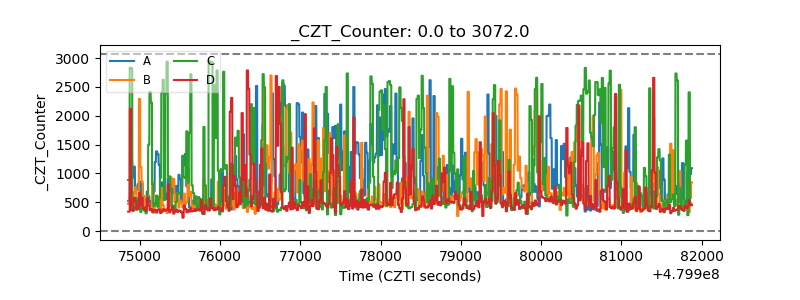 |
| +2.5 Volts monitor |  |
| +5 Volts monitor | 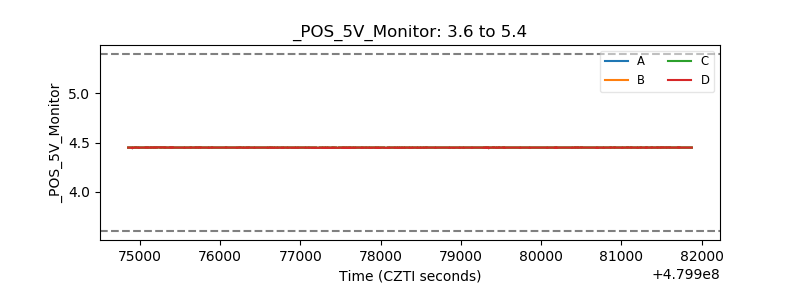 |
| _ROLL_ROT | 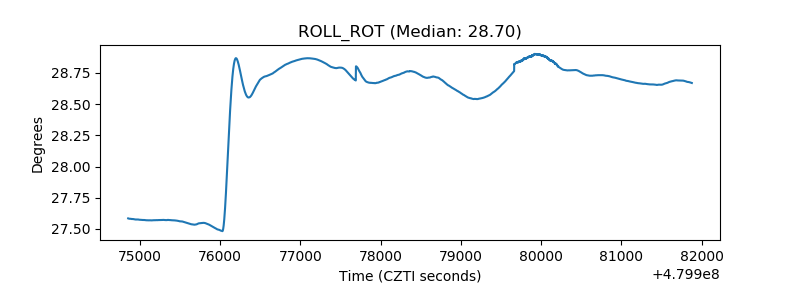 |
| _Roll_DEC | 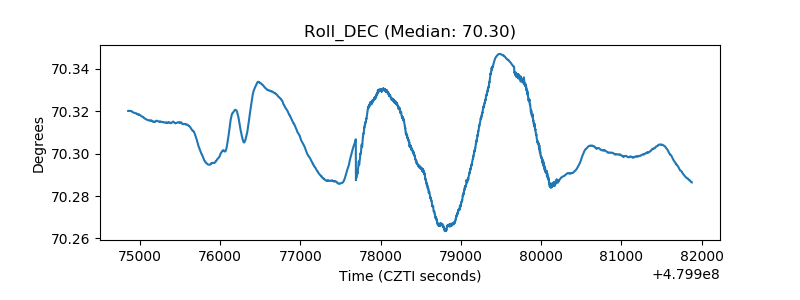 |
| _Roll_RA | 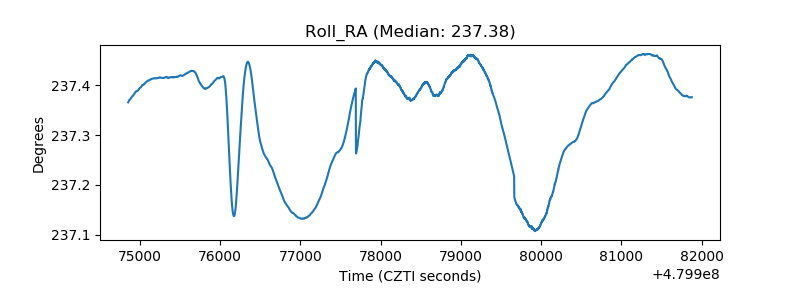 |
| Veto Counter | 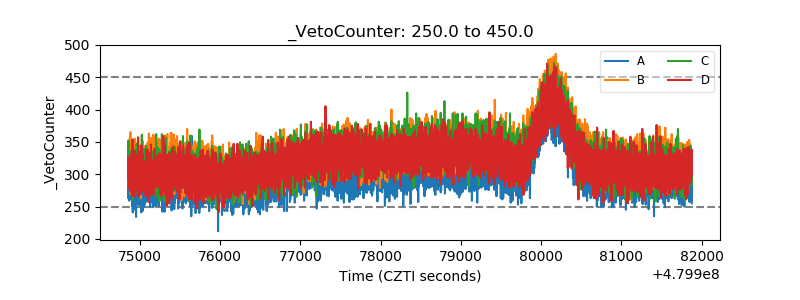 |