| Param | Original file | Final file |
|---|---|---|
| Filename | modeM0/AS1C07_001T01_9000006454_51225cztM0_level2.fits | modeM0/AS1C07_001T01_9000006454_51225cztM0_level2_quad_clean.evt |
| Size (bytes) | 694,215,360 | 105,926,400 |
| Size | 662.1 MB | 101.0 MB |
| Events in quadrant A | 5,422,049 | 692,047 |
| Events in quadrant B | 7,740,327 | 676,308 |
| Events in quadrant C | 6,496,560 | 649,963 |
| Events in quadrant D | 5,428,020 | 640,680 |
| Mode M0 | |||
|---|---|---|---|
| Quadrant | BADHDUFLAG | Total packets | Discarded packets |
| A | 0 | 21421 | 0 |
| B | 0 | 28456 | 0 |
| C | 0 | 24778 | 0 |
| D | 0 | 21651 | 4 |
| Mode SS | |||
|---|---|---|---|
| Quadrant | BADHDUFLAG | Total packets | Discarded packets |
| A | 0 | 158 | 0 |
| B | 0 | 158 | 0 |
| C | 0 | 158 | 0 |
| D | 0 | 158 | 0 |
| Quadrant | Total seconds | Saturated seconds | Saturation percentage |
|---|---|---|---|
| A | 7881 | 420 | 5.329273% |
| B | 7881 | 1420 | 18.018018% |
| C | 7881 | 718 | 9.110519% |
| D | 7880 | 256 | 3.248731% |
Noise dominated data is calculated using 1-second bins in cleaned event files. If a bin has >2000 counts, and if more than 50% of those come from <1% of pixels, then it is considered to be noise-dominated and hence unusable.
| Quadrant | # 1 sec bins | Bins with >0 counts | Bins with >2000 counts | High rate bins dominated by noise | Noise dominated (total time) | Noise dominated (detector-on time) | Marked lightcurve |
|---|---|---|---|---|---|---|---|
| A | 7881 | 7881 | 330 | 330 | 4.19% | 4.19% | 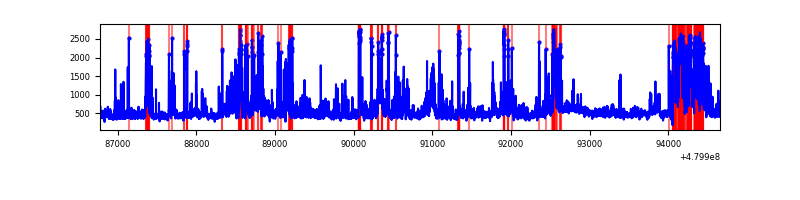 |
| B | 7881 | 7881 | 1098 | 1098 | 13.93% | 13.93% | 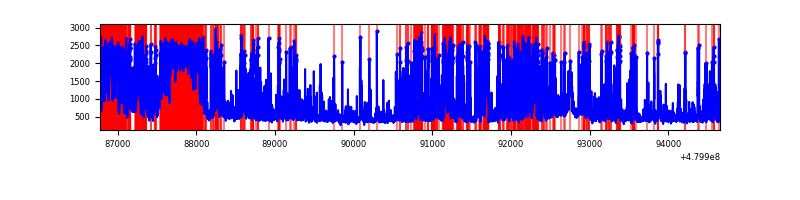 |
| C | 7881 | 7881 | 707 | 707 | 8.97% | 8.97% | 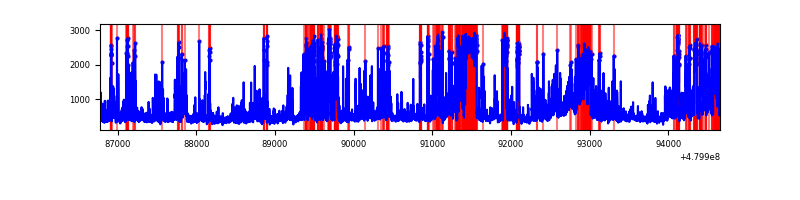 |
| D | 7881 | 7881 | 277 | 277 | 3.51% | 3.51% | 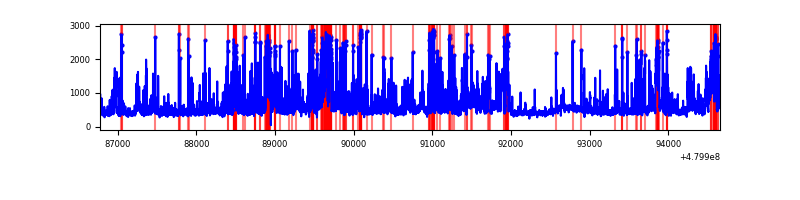 |
Top three noisy pixels from each quadrant. If the there are fewer than three noisy pixels in the level2.evt file, extra rows are filled as -1
| Pixel properties | Quadrant properties | ||||||
|---|---|---|---|---|---|---|---|
| Quadrant | DetID | PixID | Counts | Sigma | Mean | Median | Sigma |
| A | 12 | 3 | 437509 | 2200.65 | 806 | 786 | 198.5 |
| A | 8 | 26 | 363943 | 1829.95 | 806 | 786 | 198.5 |
| A | 3 | 130 | 342194 | 1720.36 | 806 | 786 | 198.5 |
| B | 5 | 185 | 1674420 | 10236.74 | 762 | 735 | 163.5 |
| B | 6 | 255 | 1354331 | 8278.98 | 762 | 735 | 163.5 |
| B | 12 | 32 | 542075 | 3310.99 | 762 | 735 | 163.5 |
| C | 4 | 12 | 1225877 | 5729.09 | 774 | 770 | 213.8 |
| C | 0 | 209 | 634828 | 2965.11 | 774 | 770 | 213.8 |
| C | 4 | 13 | 391195 | 1825.78 | 774 | 770 | 213.8 |
| D | 6 | 42 | 311565 | 1409.31 | 778 | 749 | 220.5 |
| D | 3 | 12 | 247062 | 1116.84 | 778 | 749 | 220.5 |
| D | 10 | 172 | 224264 | 1013.47 | 778 | 749 | 220.5 |
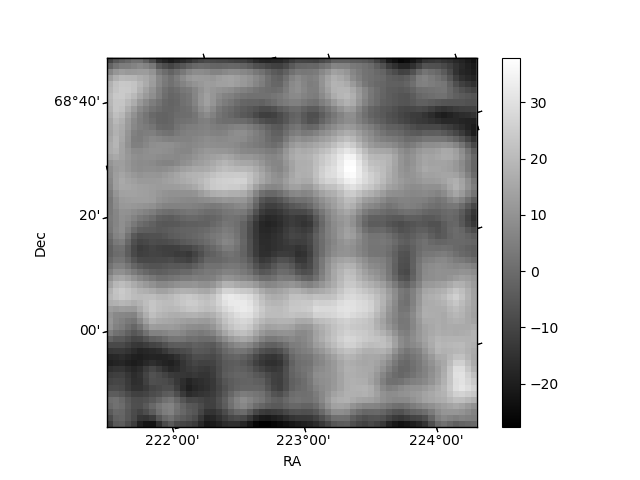
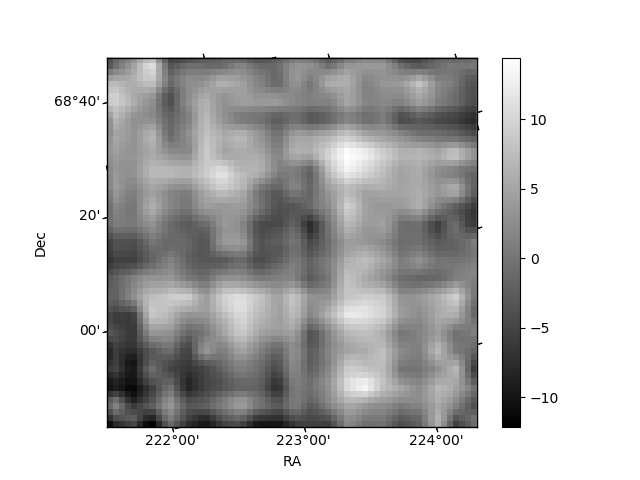
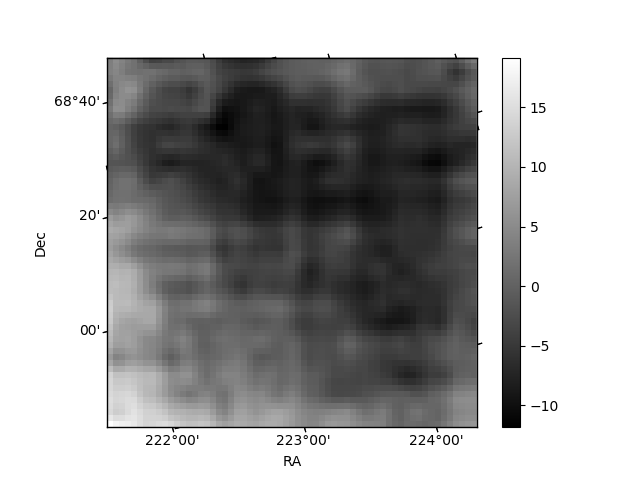
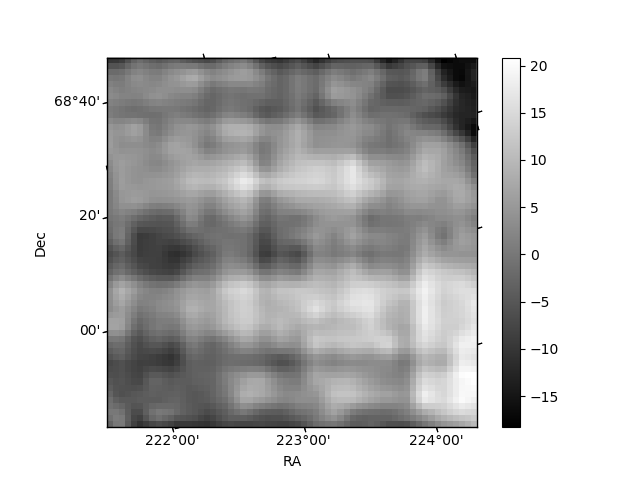
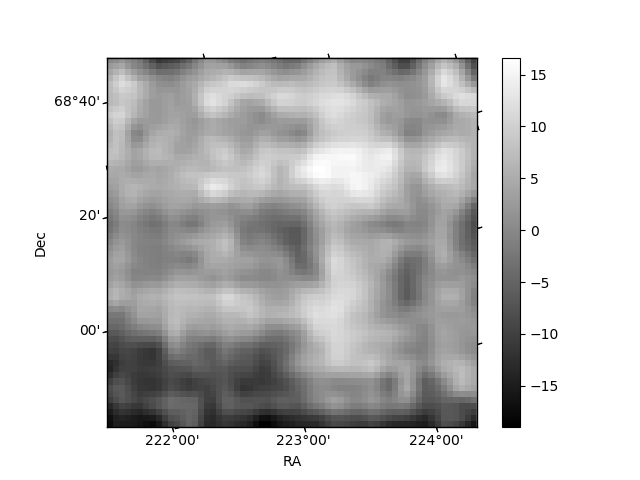
Histogram calculated using DETX and DETY for each event in the final _common_clean file
| Quadrant A | 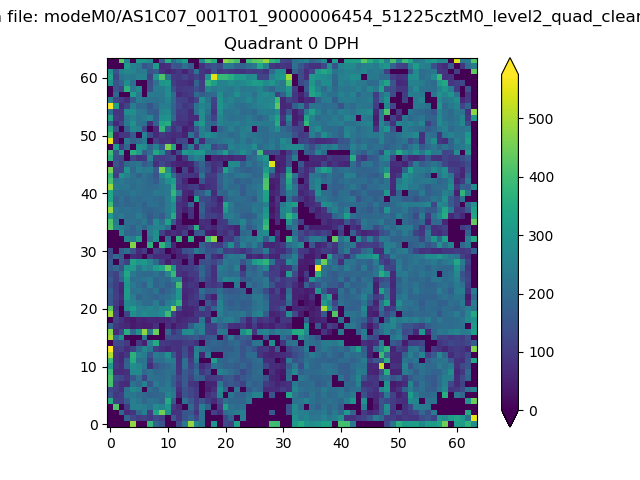 |
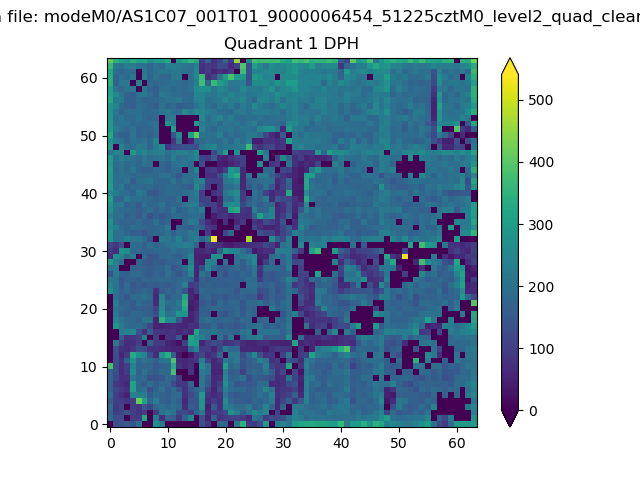 |
Quadrant B |
|---|---|---|---|
| Quadrant D | 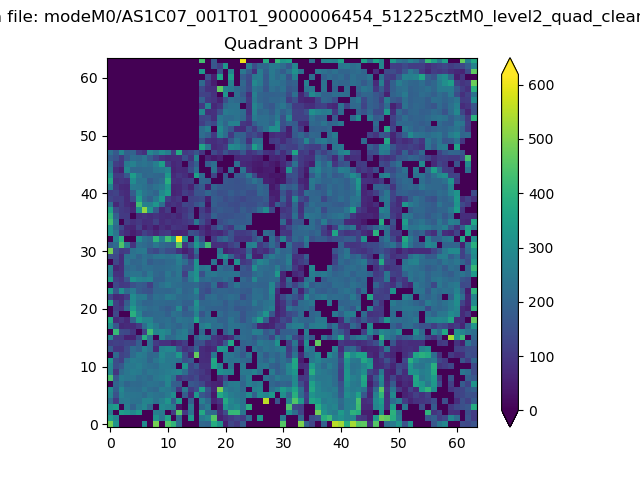 |
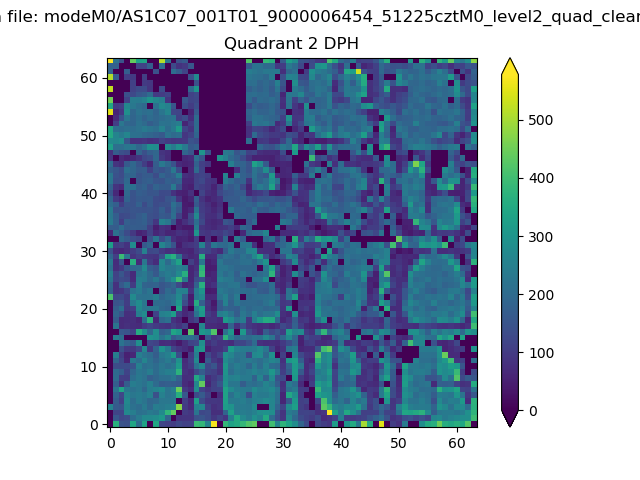 |
Quadrant C |
| Plot type | Count rate plots | Images |
|---|---|---|
| Comparison with Poisson distribution Blue bars denote a histogram of data divided into 1 sec bins. Red curve is a Poisson curve with rate = median count rate of data. |
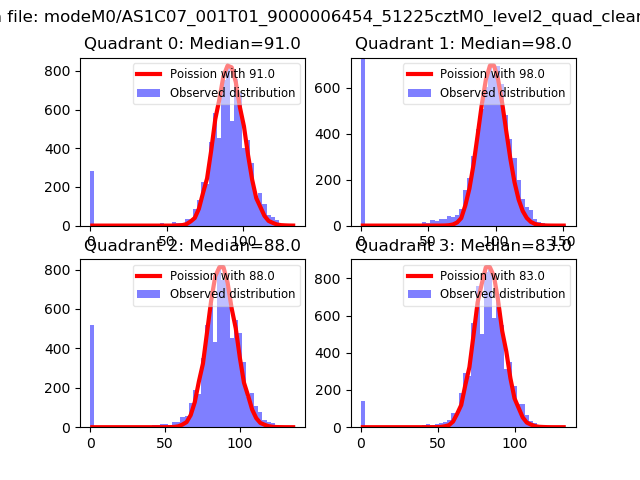 |
 |
| Quadrant-wise count rates Data is divided into 100 sec bins |
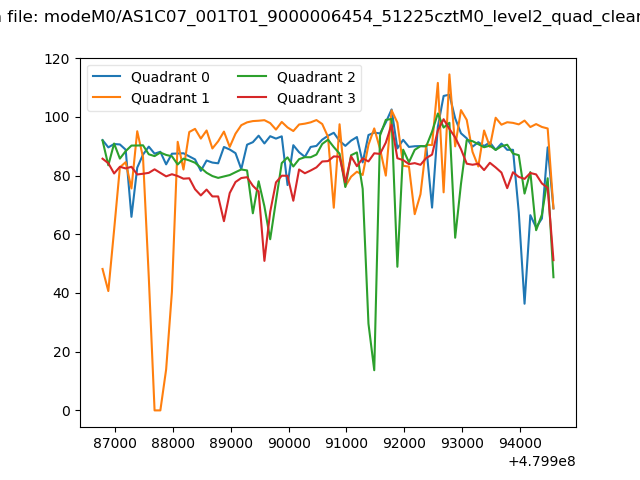 |
|
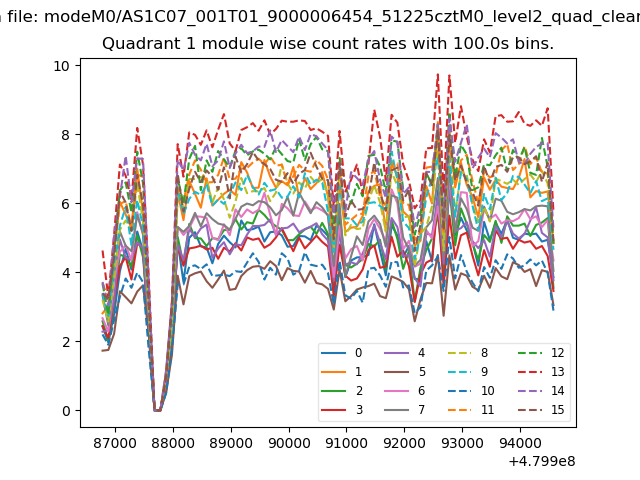
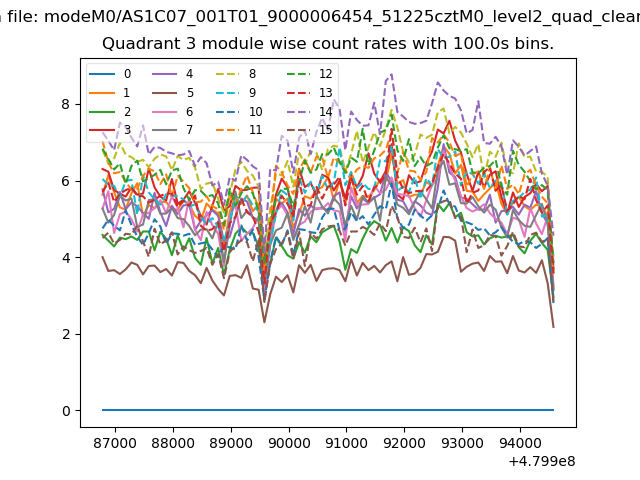
| Module-wise count rates for Quadrant A Data is divided into 100 sec bins |
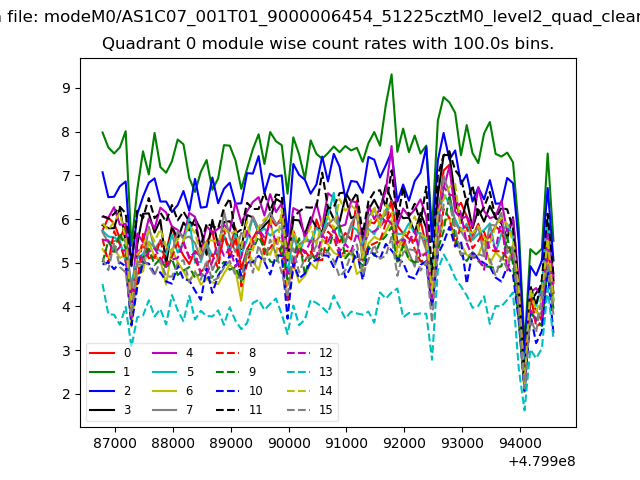 |
 |
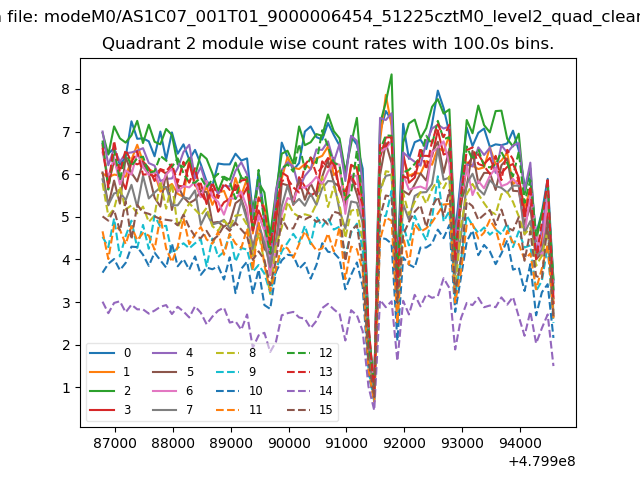
| Module-wise count rates for Quadrant B Data is divided into 100 sec bins |
 |
 |
| Module-wise count rates for Quadrant C Data is divided into 100 sec bins |
 |
 |
| Module-wise count rates for Quadrant D Data is divided into 100 sec bins |
 |
 |
| Parameter | Plot |
|---|---|
| CZT HV Monitor | 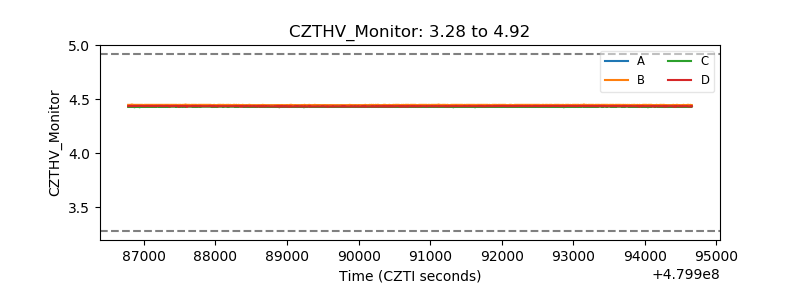 |
| D_VDD | 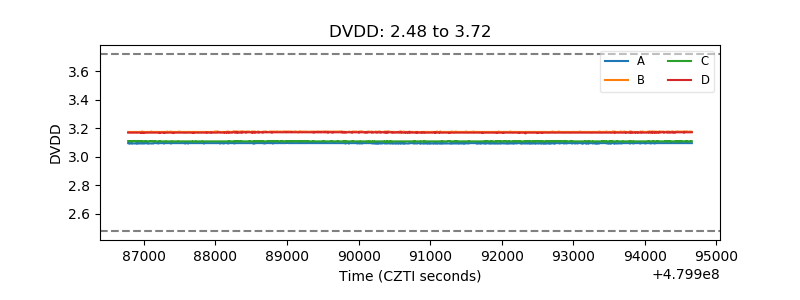 |
| Temperature 1 | 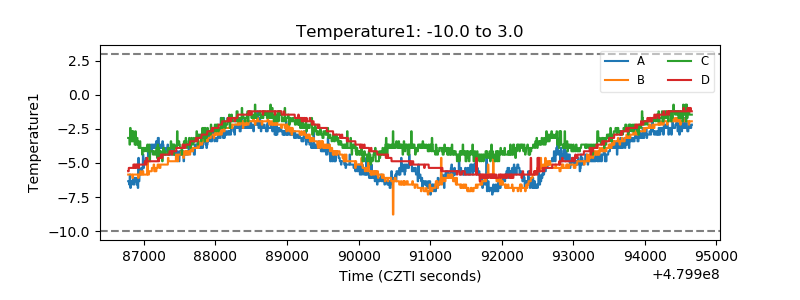 |
| Veto HV Monitor |  |
| Veto LLD | 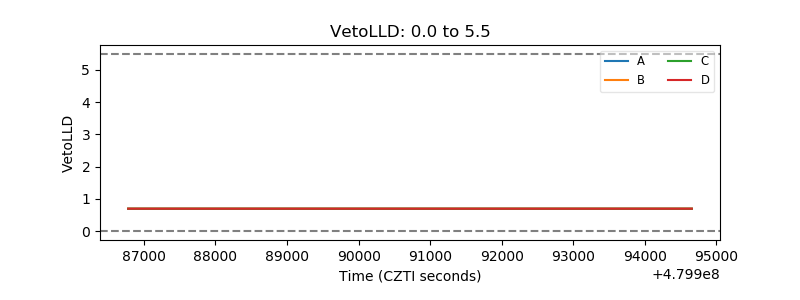 |
| Alpha Counter | 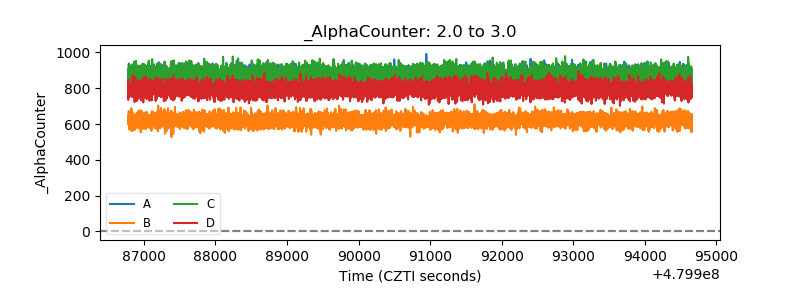 |
| _CPM_Rate | 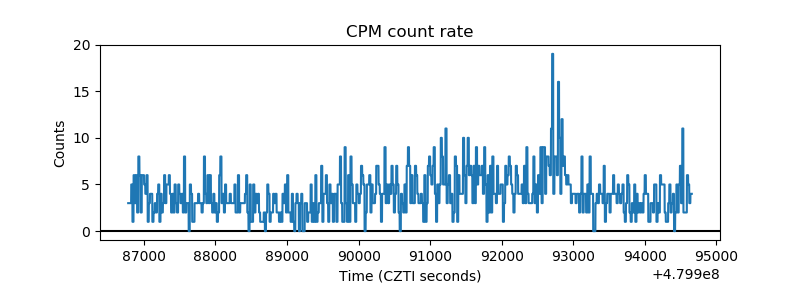 |
| CZT Counter | 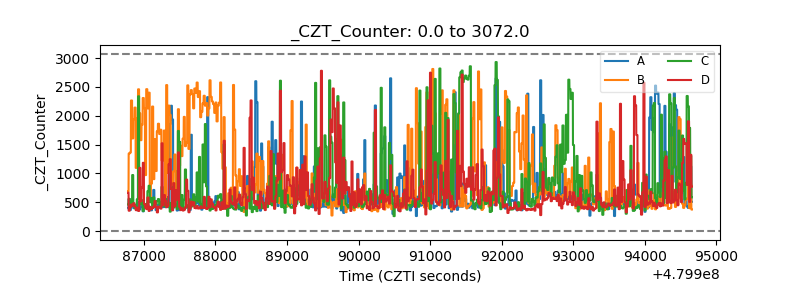 |
| +2.5 Volts monitor |  |
| +5 Volts monitor | 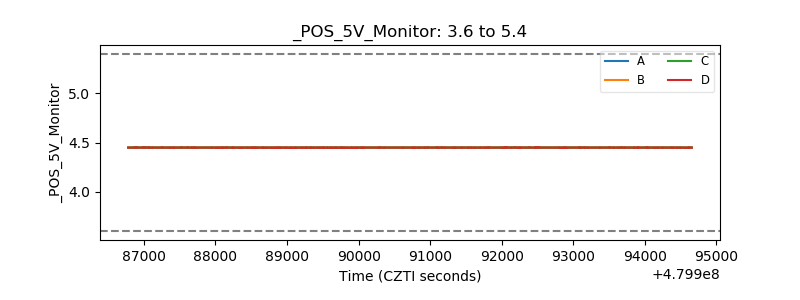 |
| _ROLL_ROT | 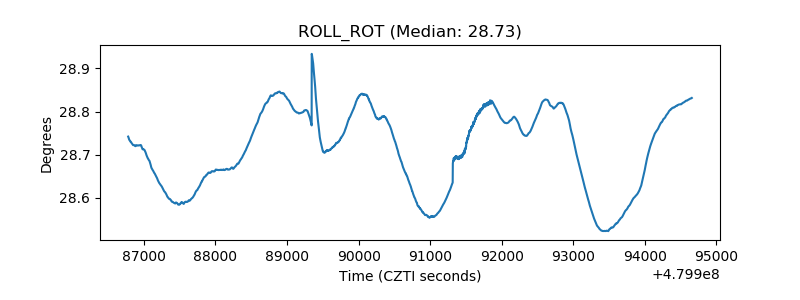 |
| _Roll_DEC | 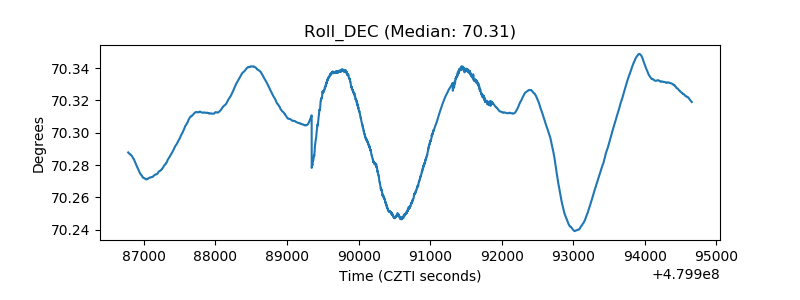 |
| _Roll_RA | 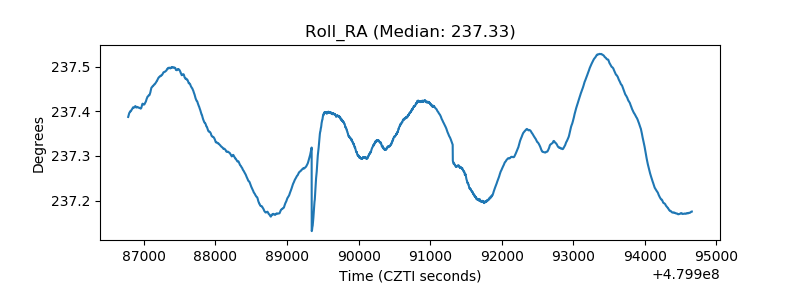 |
| Veto Counter | 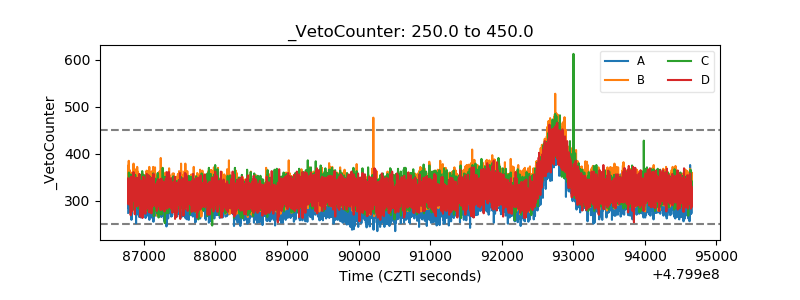 |