| Param | Original file | Final file |
|---|---|---|
| Filename | modeM0/AS1C07_001T03_9000006456_51322cztM0_level2.fits | modeM0/AS1C07_001T03_9000006456_51322cztM0_level2_quad_clean.evt |
| Size (bytes) | 724,158,720 | 89,449,920 |
| Size | 690.6 MB | 85.3 MB |
| Events in quadrant A | 6,280,465 | 607,256 |
| Events in quadrant B | 4,940,578 | 666,607 |
| Events in quadrant C | 9,035,137 | 441,730 |
| Events in quadrant D | 6,051,296 | 542,825 |
| Mode SS | |||
|---|---|---|---|
| Quadrant | BADHDUFLAG | Total packets | Discarded packets |
| A | 0 | 130 | 0 |
| B | 0 | 130 | 0 |
| C | 0 | 130 | 0 |
| D | 0 | 130 | 0 |
| Mode M0 | |||
|---|---|---|---|
| Quadrant | BADHDUFLAG | Total packets | Discarded packets |
| A | 0 | 23265 | 2 |
| B | 0 | 19171 | 2 |
| C | 0 | 31178 | 3 |
| D | 0 | 22644 | 2 |
| Mode M9 | |||
|---|---|---|---|
| Quadrant | BADHDUFLAG | Total packets | Discarded packets |
| A | 0 | 15 | 0 |
| B | 0 | 16 | 0 |
| C | 0 | 16 | 0 |
| D | 0 | 16 | 0 |
| Quadrant | Total seconds | Saturated seconds | Saturation percentage |
|---|---|---|---|
| A | 6451 | 300 | 4.650442% |
| B | 6451 | 340 | 5.270501% |
| C | 6450 | 2149 | 33.317829% |
| D | 6450 | 552 | 8.558140% |
Noise dominated data is calculated using 1-second bins in cleaned event files. If a bin has >2000 counts, and if more than 50% of those come from <1% of pixels, then it is considered to be noise-dominated and hence unusable.
| Quadrant | # 1 sec bins | Bins with >0 counts | Bins with >2000 counts | High rate bins dominated by noise | Noise dominated (total time) | Noise dominated (detector-on time) | Marked lightcurve |
|---|---|---|---|---|---|---|---|
| A | 7551 | 6452 | 212 | 212 | 2.81% | 3.29% | 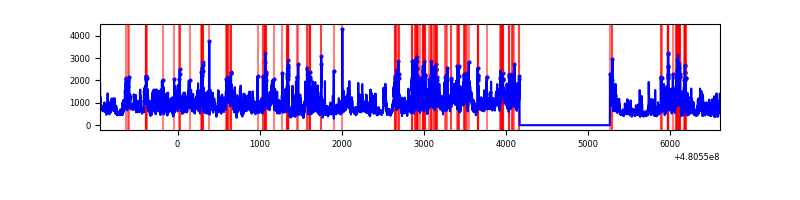 |
| B | 7551 | 6452 | 201 | 201 | 2.66% | 3.12% | 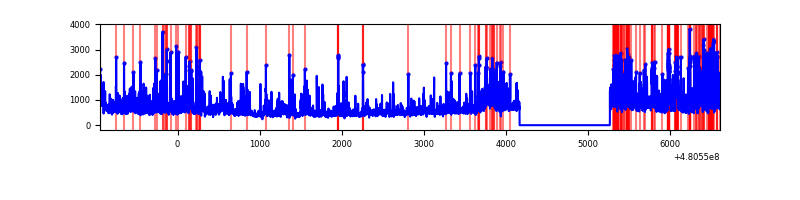 |
| C | 7550 | 6451 | 2054 | 2054 | 27.21% | 31.84% | 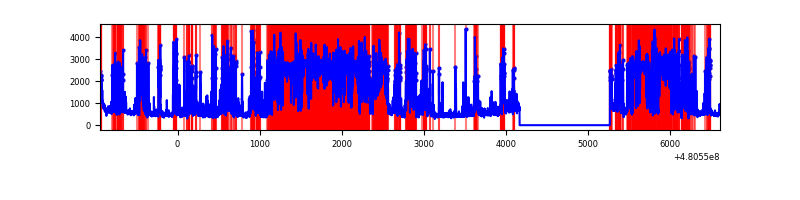 |
| D | 7550 | 6451 | 545 | 545 | 7.22% | 8.45% | 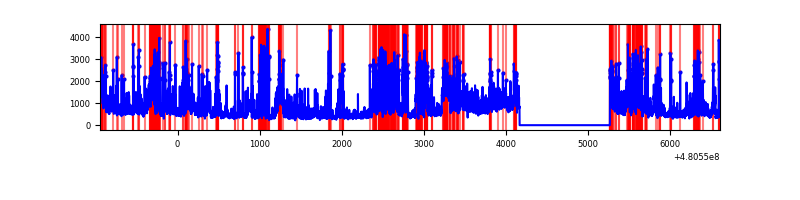 |
Top three noisy pixels from each quadrant. If the there are fewer than three noisy pixels in the level2.evt file, extra rows are filled as -1
| Pixel properties | Quadrant properties | ||||||
|---|---|---|---|---|---|---|---|
| Quadrant | DetID | PixID | Counts | Sigma | Mean | Median | Sigma |
| A | 12 | 3 | 2603902 | 15754.86 | 665 | 648 | 165.2 |
| A | 12 | 194 | 298639 | 1803.44 | 665 | 648 | 165.2 |
| A | 4 | 175 | 207646 | 1252.75 | 665 | 648 | 165.2 |
| B | 5 | 185 | 408770 | 2875.03 | 672 | 650 | 142.0 |
| B | 10 | 31 | 367584 | 2584.89 | 672 | 650 | 142.0 |
| B | 0 | 197 | 345274 | 2427.73 | 672 | 650 | 142.0 |
| C | 4 | 12 | 3862260 | 24769.03 | 564 | 561 | 155.9 |
| C | 15 | 148 | 1755079 | 11253.52 | 564 | 561 | 155.9 |
| C | 3 | 233 | 358624 | 2296.63 | 564 | 561 | 155.9 |
| D | 11 | 176 | 1195903 | 6740.55 | 636 | 615 | 177.3 |
| D | 8 | 176 | 453408 | 2553.42 | 636 | 615 | 177.3 |
| D | 6 | 175 | 313255 | 1763.06 | 636 | 615 | 177.3 |
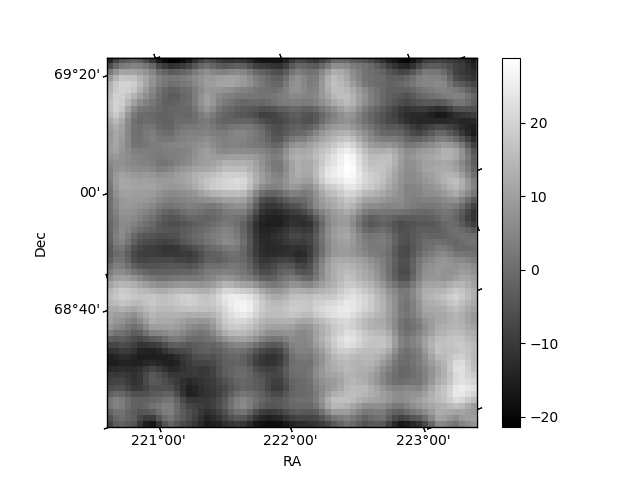
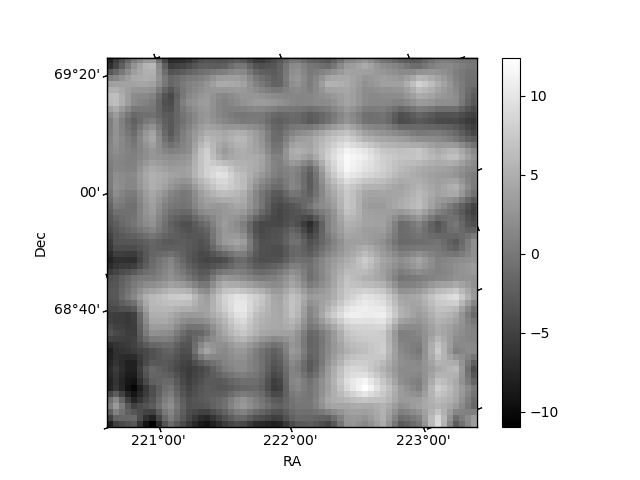
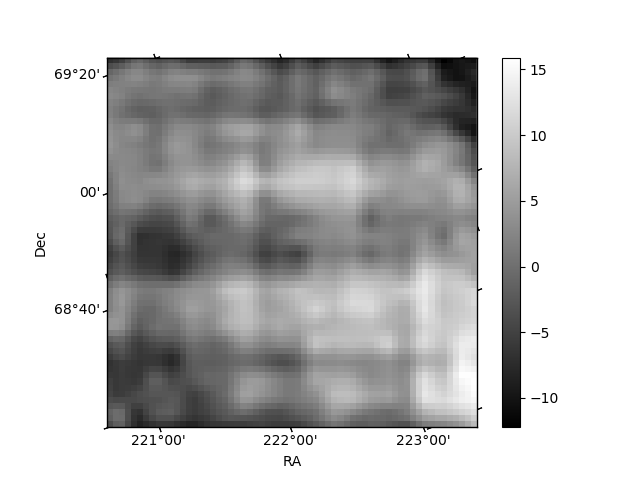
Histogram calculated using DETX and DETY for each event in the final _common_clean file
| Quadrant A | 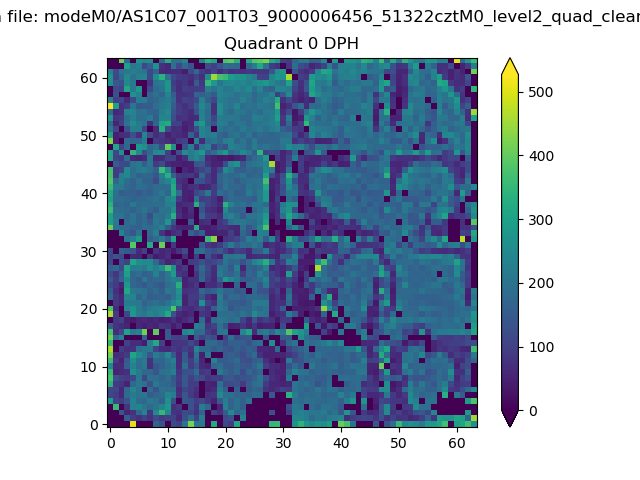 |
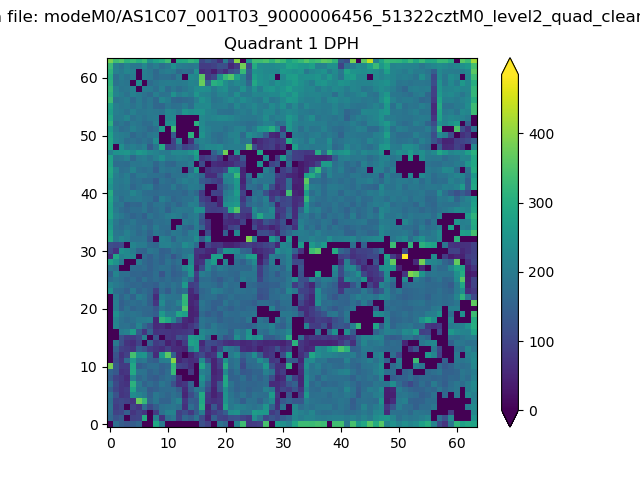 |
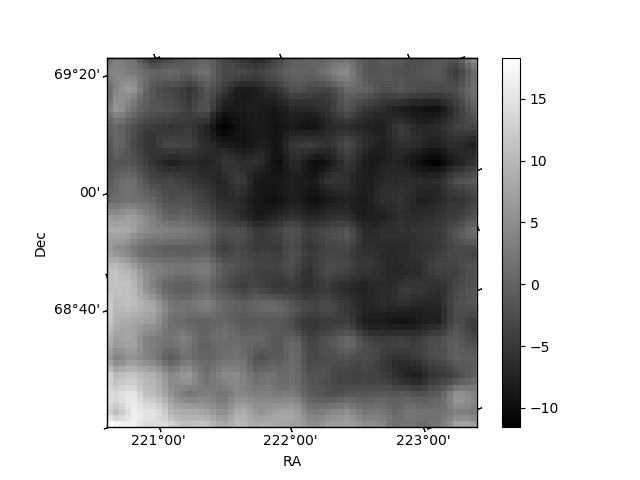
Quadrant B |
|---|---|---|---|
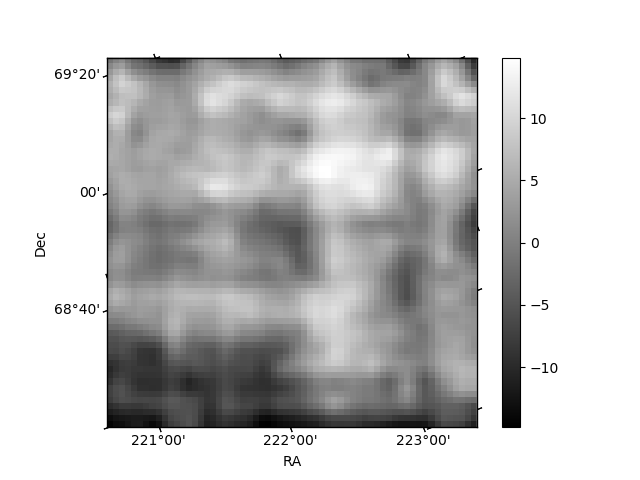
| Quadrant D | 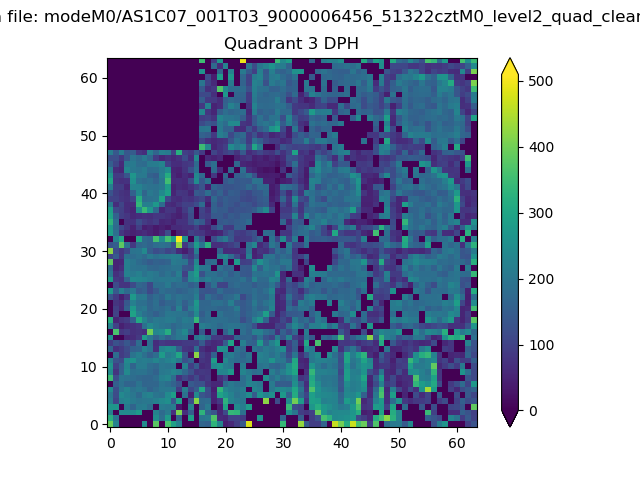 |
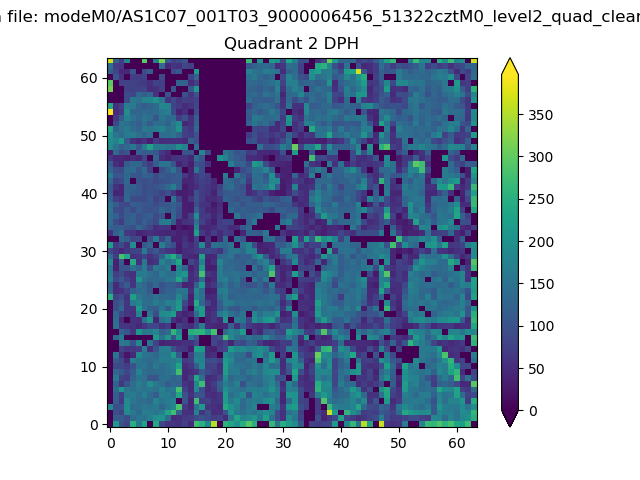 |
Quadrant C |
| Plot type | Count rate plots | Images |
|---|---|---|
| Comparison with Poisson distribution Blue bars denote a histogram of data divided into 1 sec bins. Red curve is a Poisson curve with rate = median count rate of data. |
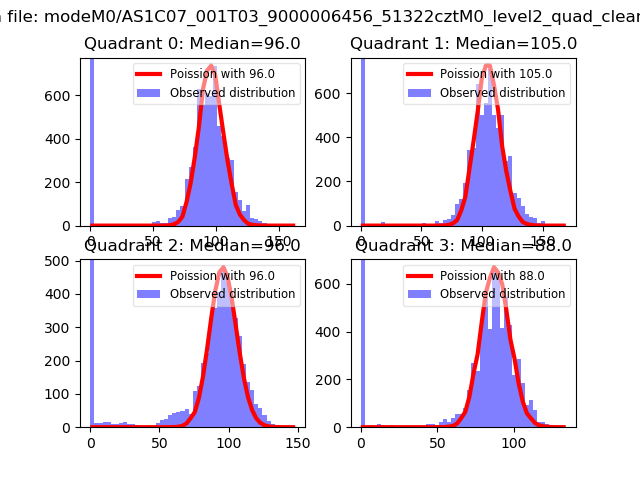 |
 |
| Quadrant-wise count rates Data is divided into 100 sec bins |
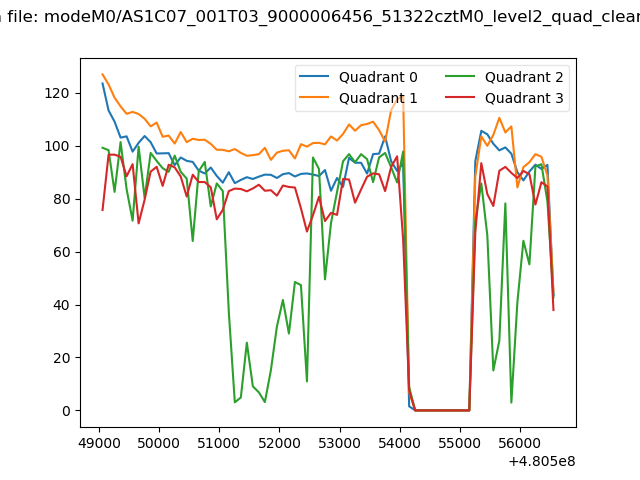 |
|
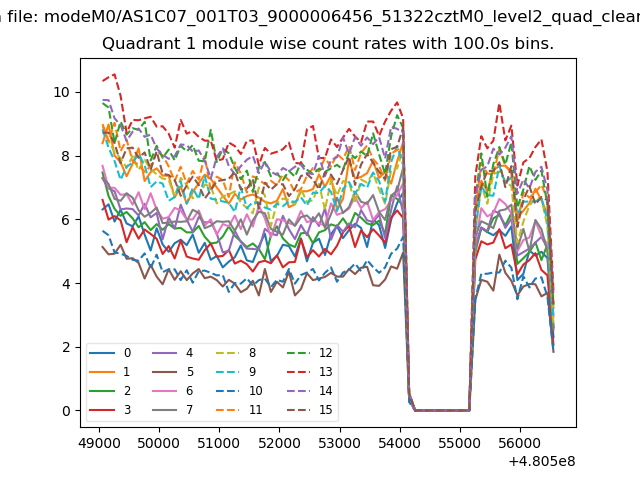
| Module-wise count rates for Quadrant A Data is divided into 100 sec bins |
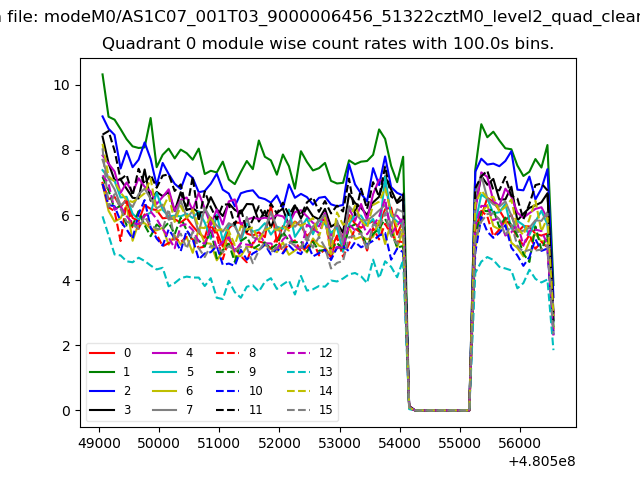 |
 |
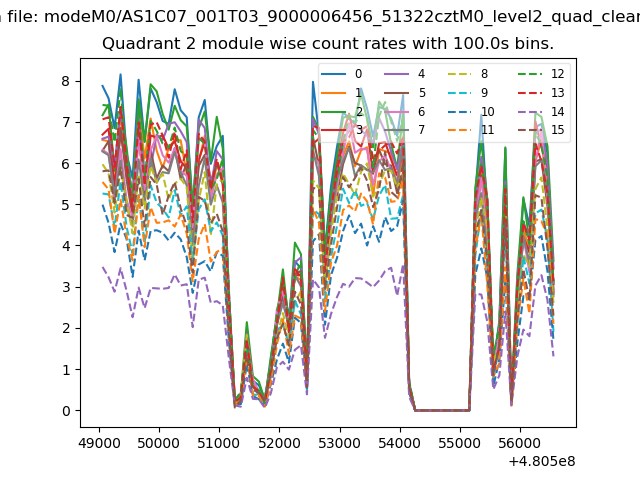
| Module-wise count rates for Quadrant B Data is divided into 100 sec bins |
 |
 |
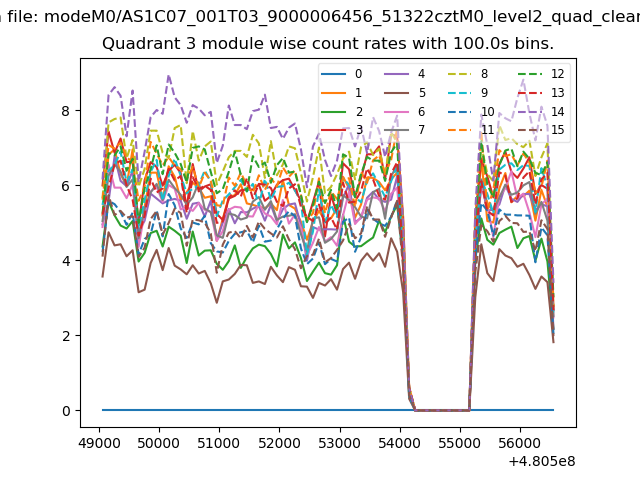
| Module-wise count rates for Quadrant C Data is divided into 100 sec bins |
 |
 |
| Module-wise count rates for Quadrant D Data is divided into 100 sec bins |
 |
 |
| Parameter | Plot |
|---|---|
| CZT HV Monitor | 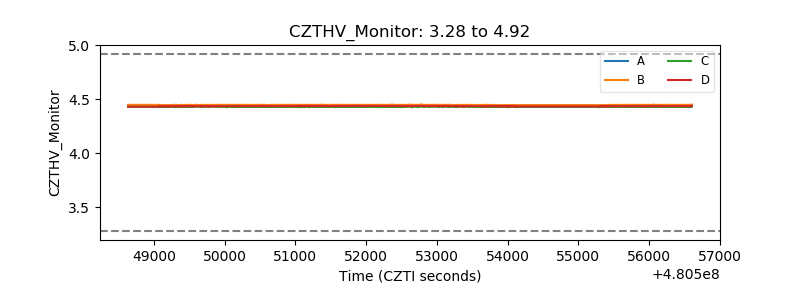 |
| D_VDD | 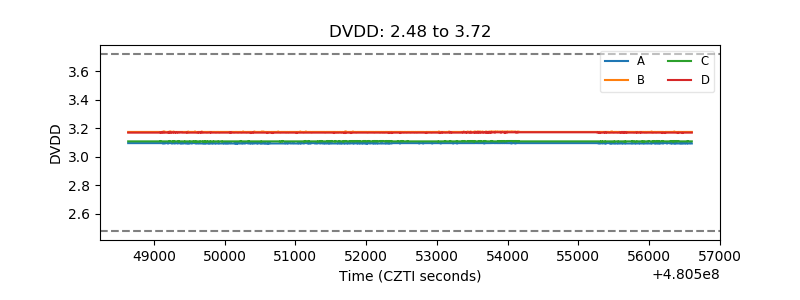 |
| Temperature 1 | 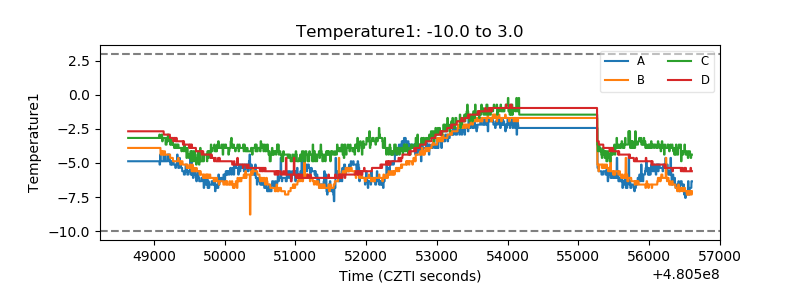 |
| Veto HV Monitor | 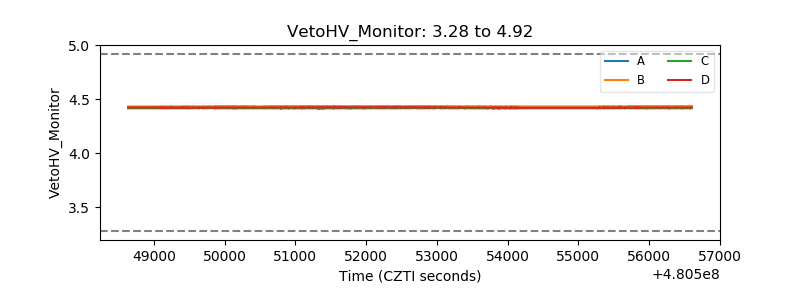 |
| Veto LLD | 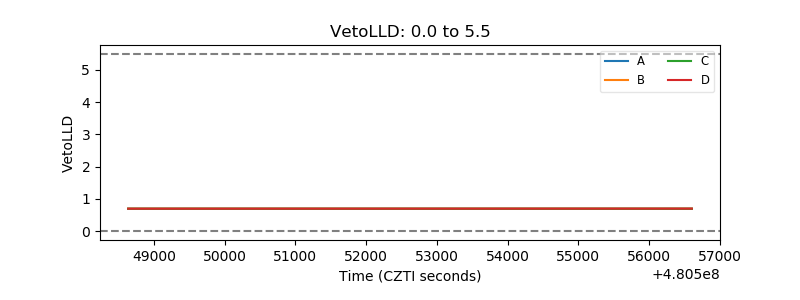 |
| Alpha Counter | 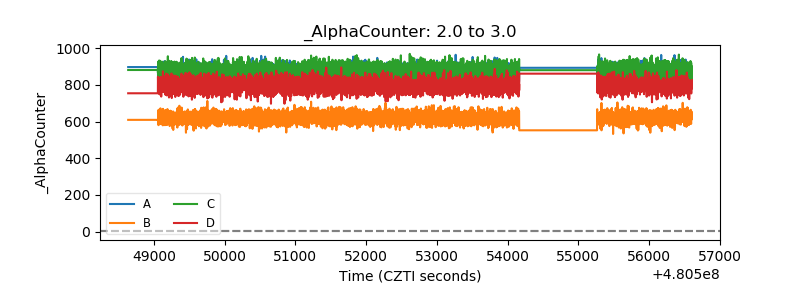 |
| _CPM_Rate | 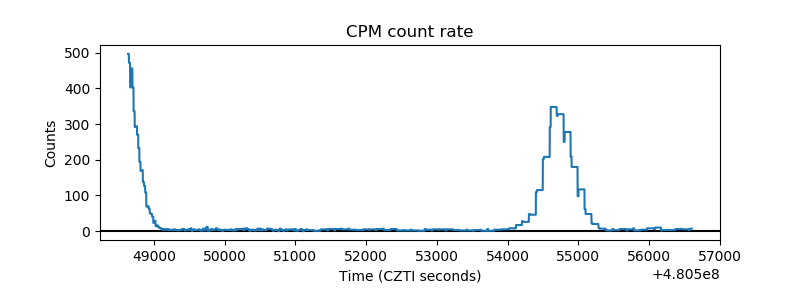 |
| CZT Counter | 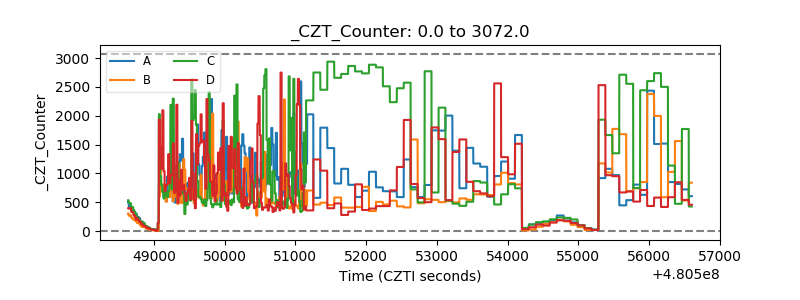 |
| +2.5 Volts monitor | 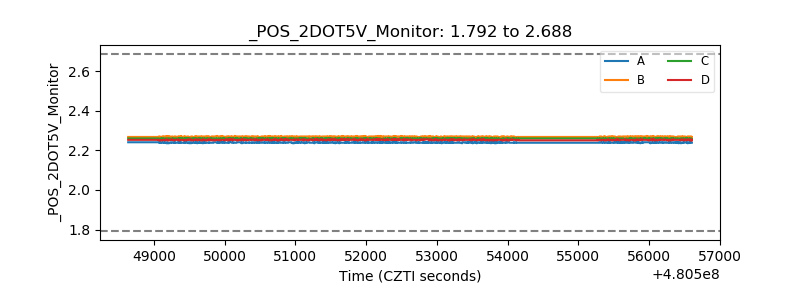 |
| +5 Volts monitor | 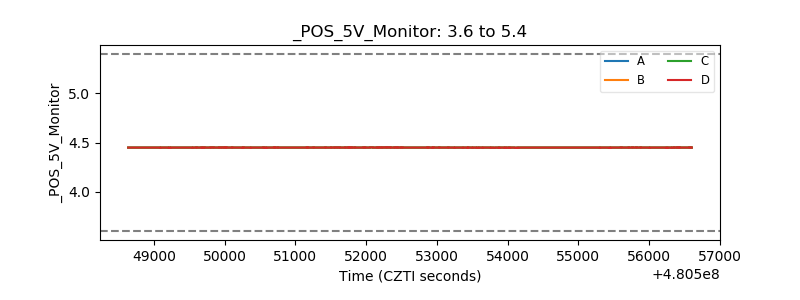 |
| _ROLL_ROT | 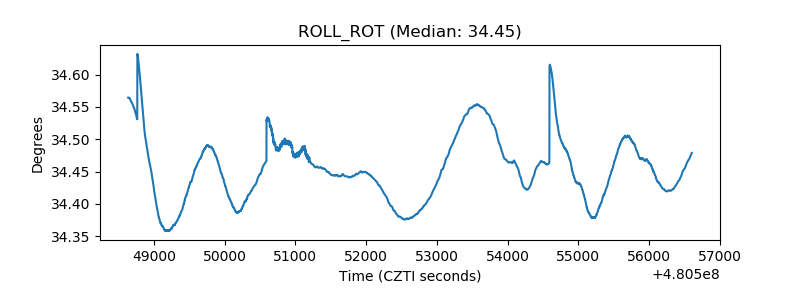 |
| _Roll_DEC | 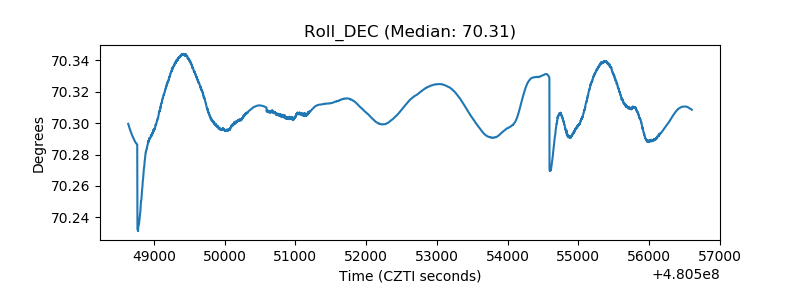 |
| _Roll_RA | 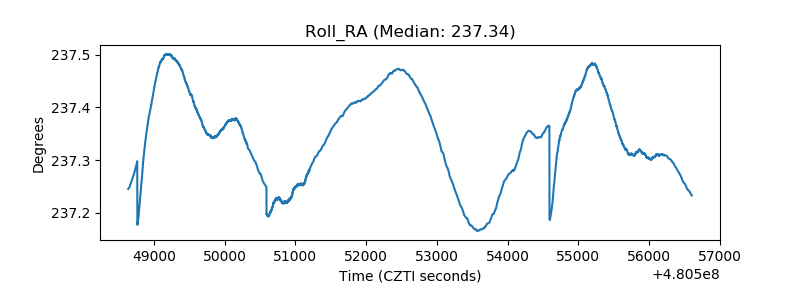 |
| Veto Counter | 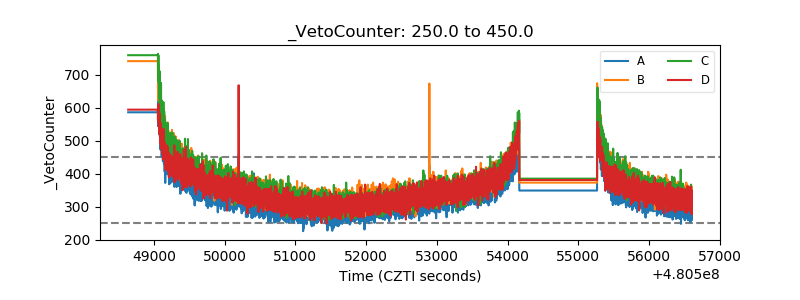 |