| Param | Original file | Final file |
|---|---|---|
| Filename | modeM0/AS1C07_001T03_9000006456_51413cztM0_level2.fits | modeM0/AS1C07_001T03_9000006456_51413cztM0_level2_quad_clean.evt |
| Size (bytes) | 990,656,640 | 85,803,840 |
| Size | 944.8 MB | 81.8 MB |
| Events in quadrant A | 7,139,743 | 674,736 |
| Events in quadrant B | 5,877,082 | 759,304 |
| Events in quadrant C | 17,208,333 | 19,113 |
| Events in quadrant D | 5,849,969 | 609,932 |
| Mode SS | |||
|---|---|---|---|
| Quadrant | BADHDUFLAG | Total packets | Discarded packets |
| A | 0 | 154 | 0 |
| B | 0 | 154 | 0 |
| C | 0 | 154 | 0 |
| D | 0 | 154 | 0 |
| Mode M0 | |||
|---|---|---|---|
| Quadrant | BADHDUFLAG | Total packets | Discarded packets |
| A | 0 | 26623 | 0 |
| B | 0 | 22765 | 0 |
| C | 0 | 56350 | 0 |
| D | 0 | 23056 | 0 |
| Quadrant | Total seconds | Saturated seconds | Saturation percentage |
|---|---|---|---|
| A | 7686 | 409 | 5.321364% |
| B | 7686 | 222 | 2.888368% |
| C | 7686 | 7528 | 97.944314% |
| D | 7686 | 572 | 7.442103% |
Noise dominated data is calculated using 1-second bins in cleaned event files. If a bin has >2000 counts, and if more than 50% of those come from <1% of pixels, then it is considered to be noise-dominated and hence unusable.
| Quadrant | # 1 sec bins | Bins with >0 counts | Bins with >2000 counts | High rate bins dominated by noise | Noise dominated (total time) | Noise dominated (detector-on time) | Marked lightcurve |
|---|---|---|---|---|---|---|---|
| A | 7686 | 7686 | 356 | 356 | 4.63% | 4.63% | 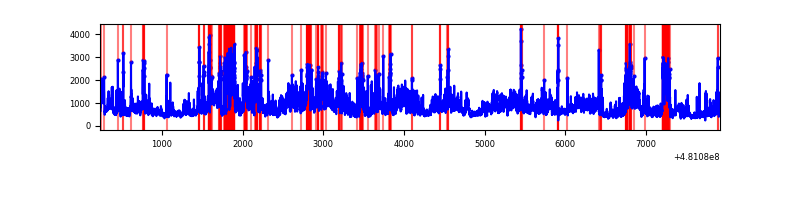 |
| B | 7686 | 7686 | 151 | 151 | 1.96% | 1.96% | 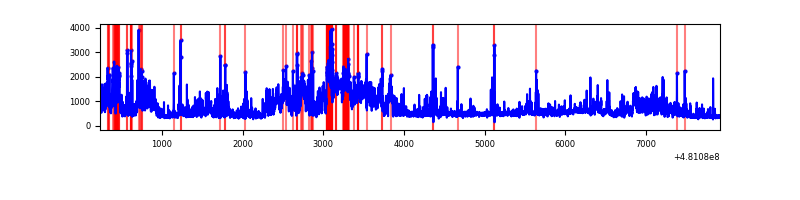 |
| C | 7685 | 7685 | 6011 | 6011 | 78.22% | 78.22% | 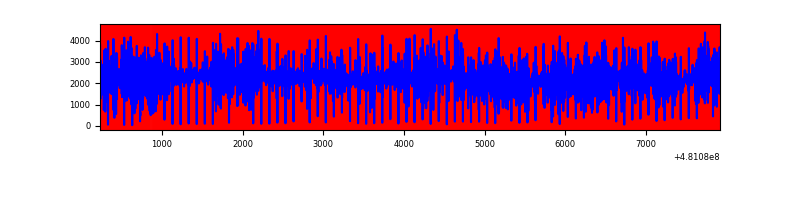 |
| D | 7686 | 7686 | 507 | 507 | 6.60% | 6.60% | 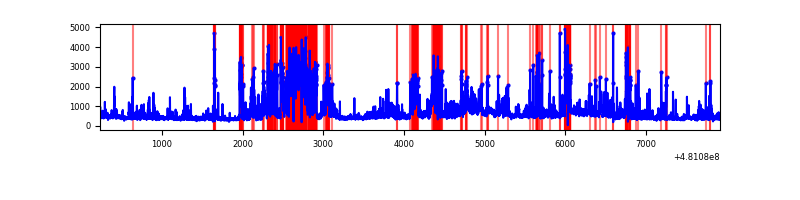 |
Top three noisy pixels from each quadrant. If the there are fewer than three noisy pixels in the level2.evt file, extra rows are filled as -1
| Pixel properties | Quadrant properties | ||||||
|---|---|---|---|---|---|---|---|
| Quadrant | DetID | PixID | Counts | Sigma | Mean | Median | Sigma |
| A | 12 | 3 | 2097850 | 11023.99 | 767 | 748 | 190.2 |
| A | 15 | 174 | 636160 | 3340.22 | 767 | 748 | 190.2 |
| A | 12 | 250 | 575771 | 3022.77 | 767 | 748 | 190.2 |
| B | 10 | 254 | 2072166 | 12399.1 | 779 | 750 | 167.1 |
| B | 7 | 252 | 139331 | 829.52 | 779 | 750 | 167.1 |
| B | 6 | 51 | 75773 | 449.07 | 779 | 750 | 167.1 |
| C | 15 | 179 | 12288248 | 211282.83 | 206 | 204 | 58.2 |
| C | 4 | 12 | 3615240 | 62157.58 | 206 | 204 | 58.2 |
| C | 10 | 171 | 129036 | 2215.16 | 206 | 204 | 58.2 |
| D | 6 | 42 | 1472962 | 7269.31 | 732 | 707 | 202.5 |
| D | 7 | 126 | 187871 | 924.13 | 732 | 707 | 202.5 |
| D | 12 | 218 | 181891 | 894.6 | 732 | 707 | 202.5 |
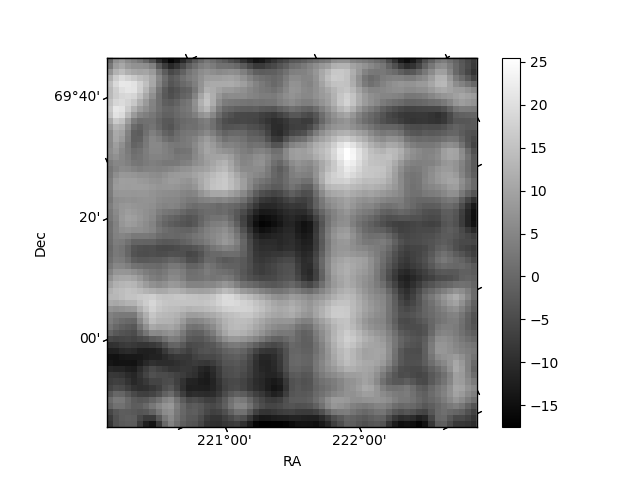
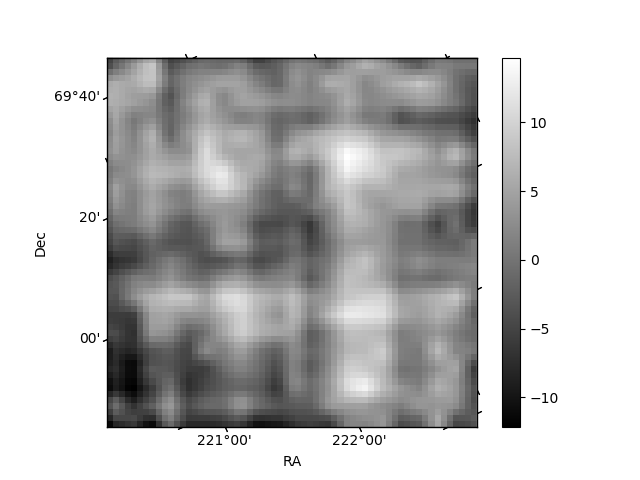
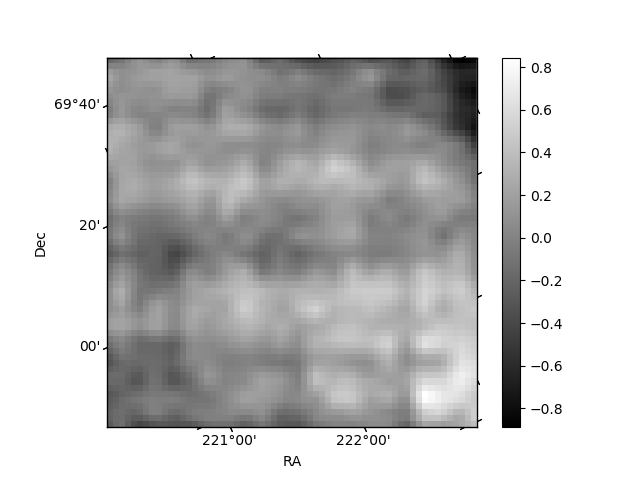
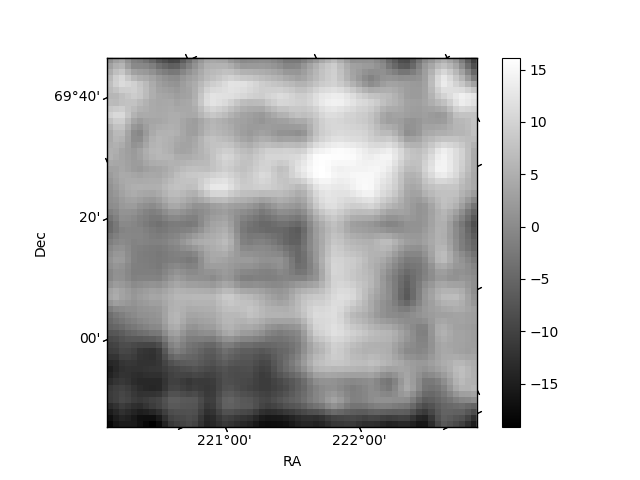
Histogram calculated using DETX and DETY for each event in the final _common_clean file
| Quadrant A | 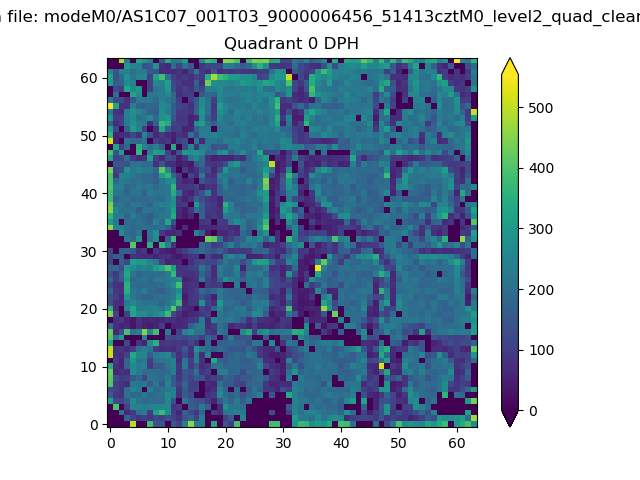 |
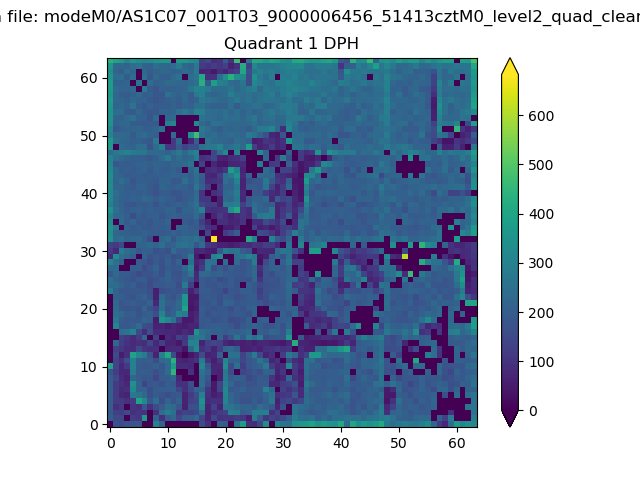 |
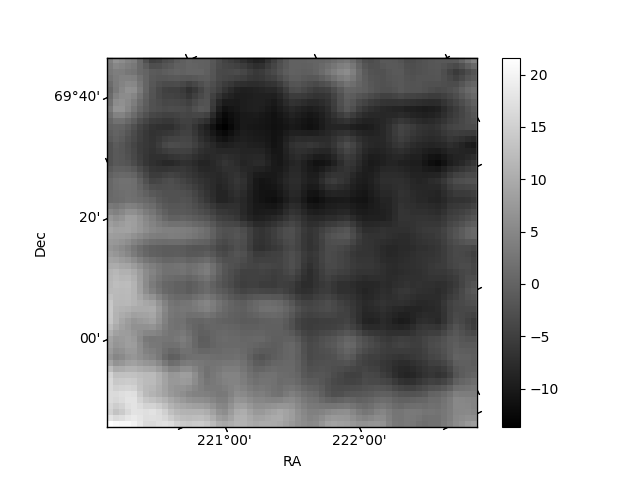
Quadrant B |
|---|---|---|---|
| Quadrant D | 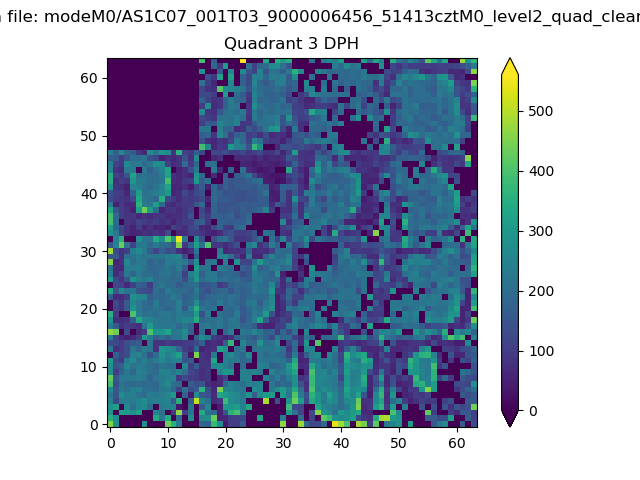 |
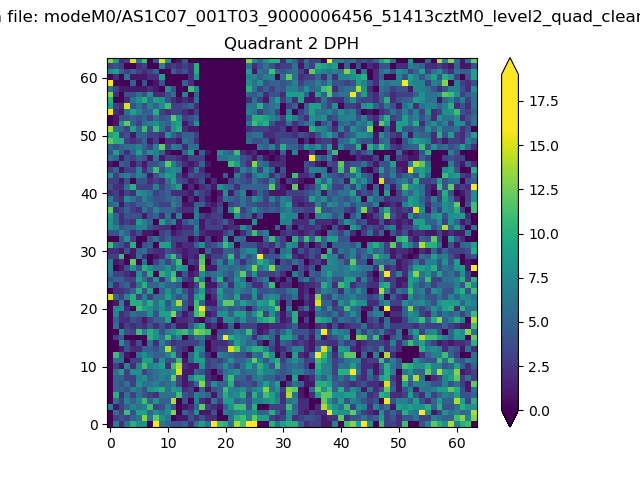 |
Quadrant C |
| Plot type | Count rate plots | Images |
|---|---|---|
| Comparison with Poisson distribution Blue bars denote a histogram of data divided into 1 sec bins. Red curve is a Poisson curve with rate = median count rate of data. |
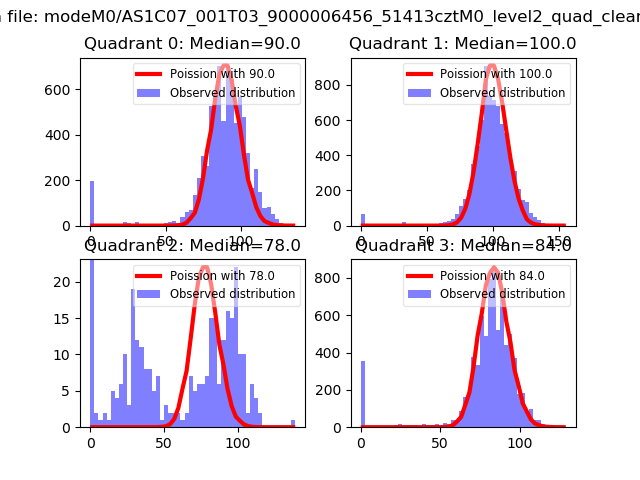 |
 |
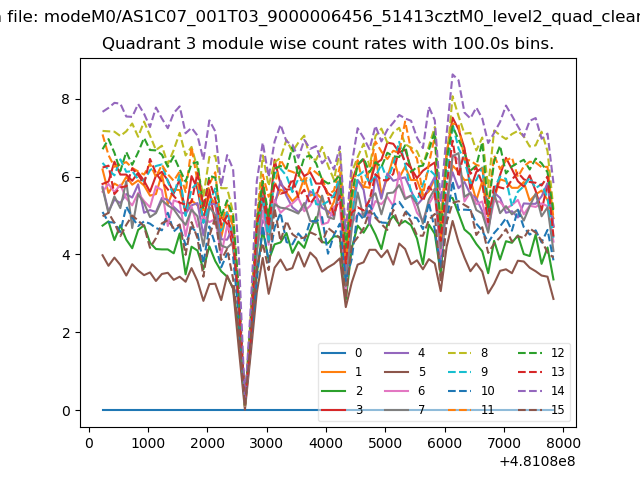
| Quadrant-wise count rates Data is divided into 100 sec bins |
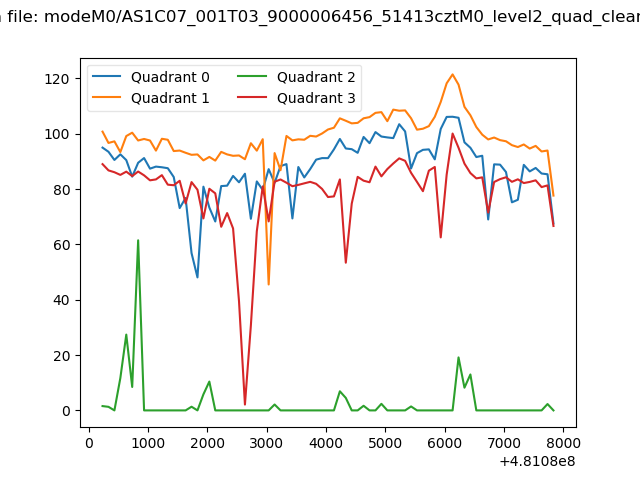 |
|
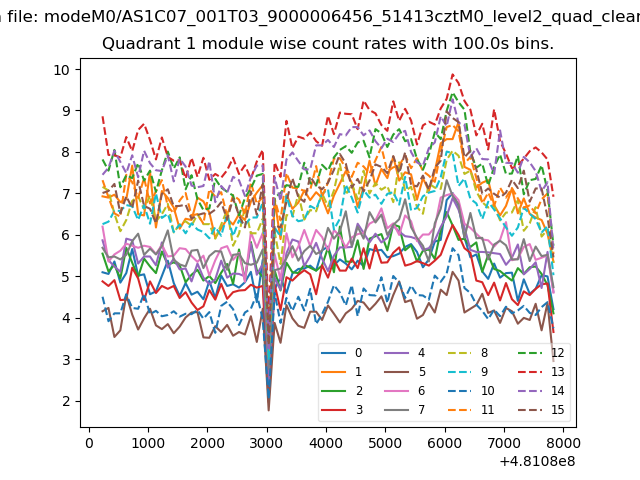
| Module-wise count rates for Quadrant A Data is divided into 100 sec bins |
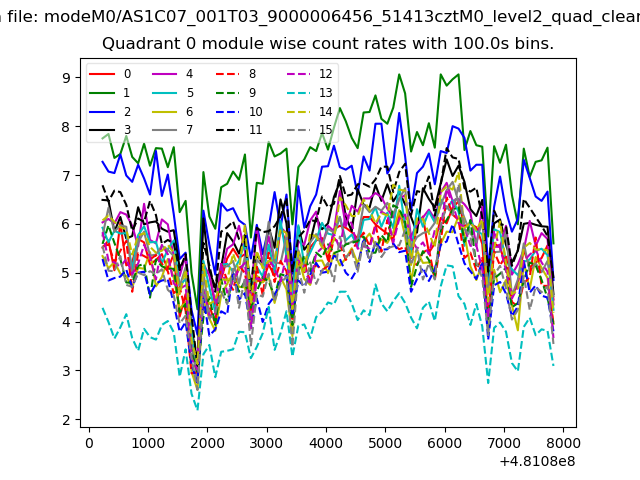 |
 |
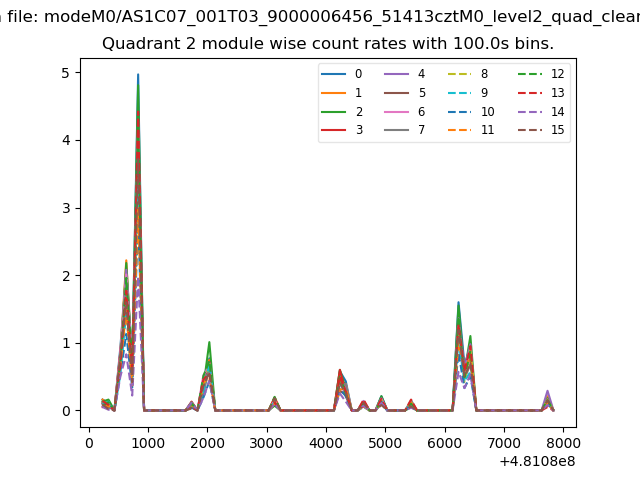
| Module-wise count rates for Quadrant B Data is divided into 100 sec bins |
 |
 |
| Module-wise count rates for Quadrant C Data is divided into 100 sec bins |
 |
 |
| Module-wise count rates for Quadrant D Data is divided into 100 sec bins |
 |
 |
| Parameter | Plot |
|---|---|
| CZT HV Monitor | 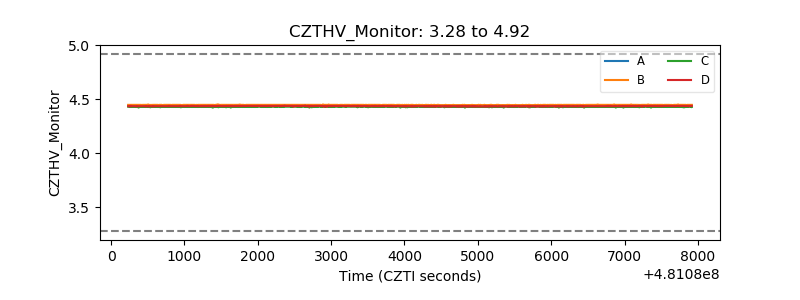 |
| D_VDD | 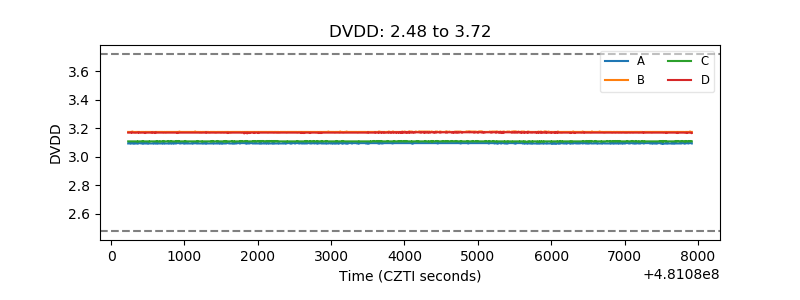 |
| Temperature 1 | 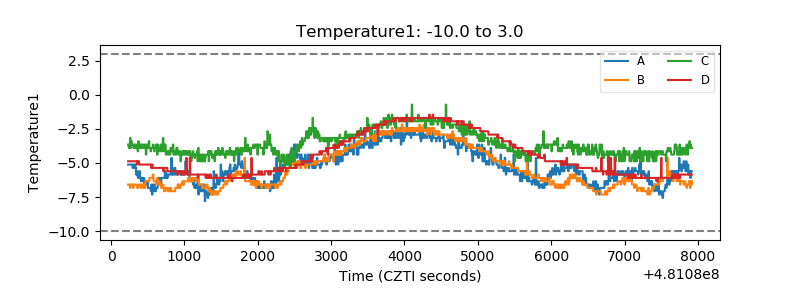 |
| Veto HV Monitor | 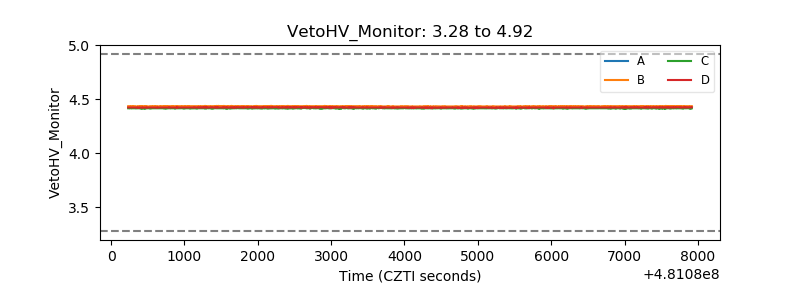 |
| Veto LLD |  |
| Alpha Counter | 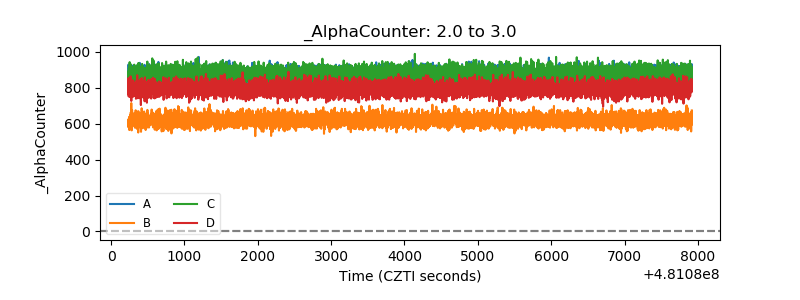 |
| _CPM_Rate | 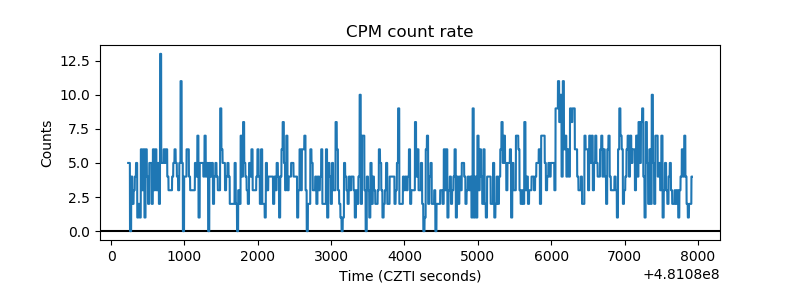 |
| CZT Counter | 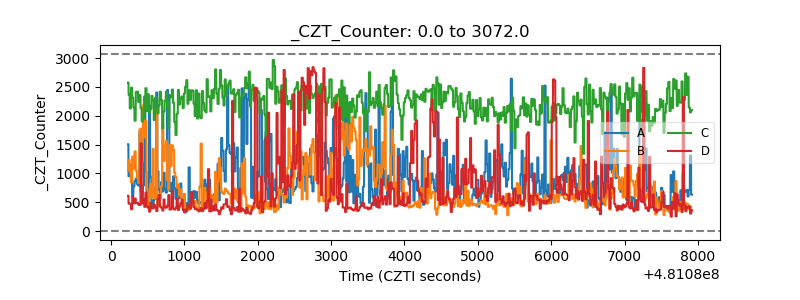 |
| +2.5 Volts monitor | 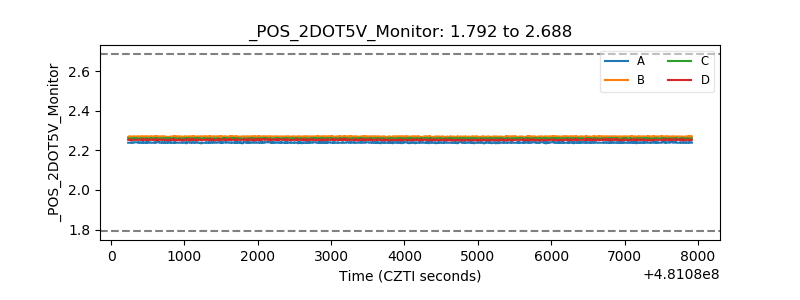 |
| +5 Volts monitor | 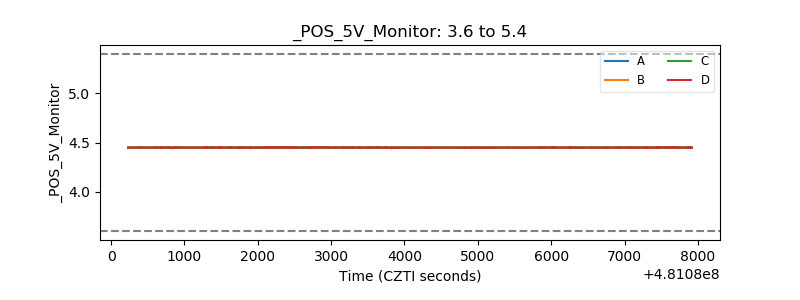 |
| _ROLL_ROT | 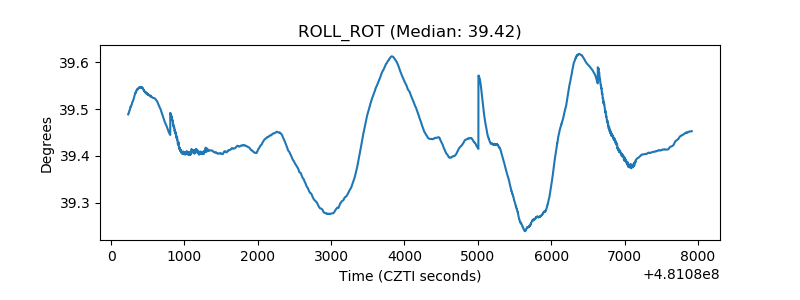 |
| _Roll_DEC | 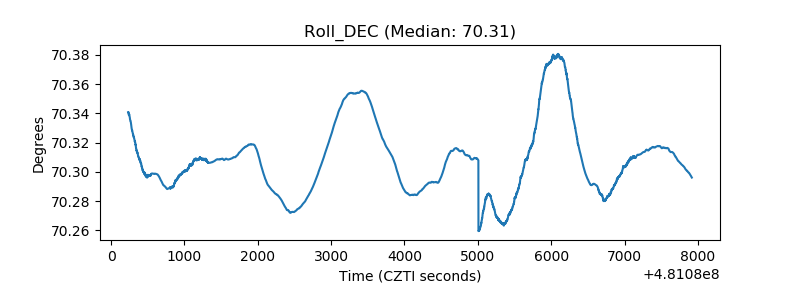 |
| _Roll_RA | 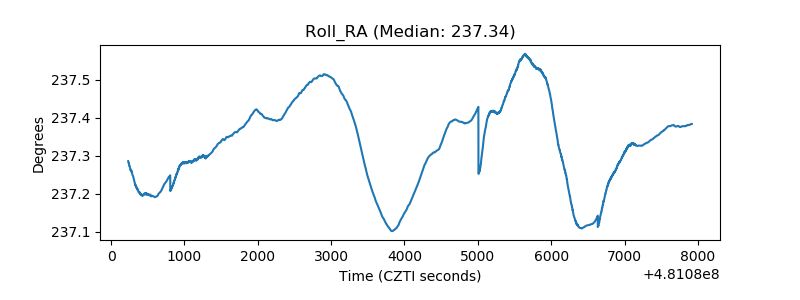 |
| Veto Counter | 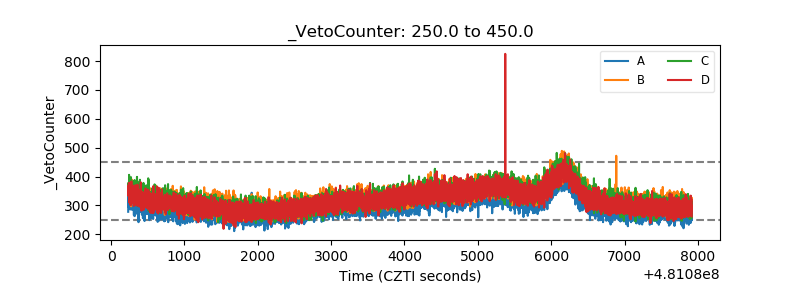 |