| Param | Original file | Final file |
|---|---|---|
| Filename | modeM0/AS1A13_090T01_9000006458_51455cztM0_level2.fits | modeM0/AS1A13_090T01_9000006458_51455cztM0_level2_quad_clean.evt |
| Size (bytes) | 766,134,720 | 108,054,720 |
| Size | 730.6 MB | 103.0 MB |
| Events in quadrant A | 9,119,361 | 655,658 |
| Events in quadrant B | 4,817,882 | 783,300 |
| Events in quadrant C | 6,738,077 | 649,561 |
| Events in quadrant D | 7,067,024 | 628,256 |
| Mode M0 | |||
|---|---|---|---|
| Quadrant | BADHDUFLAG | Total packets | Discarded packets |
| A | 0 | 32727 | 2 |
| B | 0 | 20083 | 2 |
| C | 0 | 25840 | 2 |
| D | 0 | 26617 | 2 |
| Mode M9 | |||
|---|---|---|---|
| Quadrant | BADHDUFLAG | Total packets | Discarded packets |
| A | 0 | 10 | 0 |
| B | 0 | 10 | 0 |
| C | 0 | 10 | 0 |
| D | 0 | 10 | 0 |
| Mode SS | |||
|---|---|---|---|
| Quadrant | BADHDUFLAG | Total packets | Discarded packets |
| A | 0 | 164 | 0 |
| B | 0 | 164 | 0 |
| C | 0 | 164 | 0 |
| D | 0 | 164 | 0 |
| Quadrant | Total seconds | Saturated seconds | Saturation percentage |
|---|---|---|---|
| A | 7978 | 1333 | 16.708448% |
| B | 7979 | 458 | 5.740068% |
| C | 7979 | 1002 | 12.557965% |
| D | 7979 | 807 | 10.114049% |
Noise dominated data is calculated using 1-second bins in cleaned event files. If a bin has >2000 counts, and if more than 50% of those come from <1% of pixels, then it is considered to be noise-dominated and hence unusable.
| Quadrant | # 1 sec bins | Bins with >0 counts | Bins with >2000 counts | High rate bins dominated by noise | Noise dominated (total time) | Noise dominated (detector-on time) | Marked lightcurve |
|---|---|---|---|---|---|---|---|
| A | 8968 | 7981 | 934 | 934 | 10.41% | 11.70% | 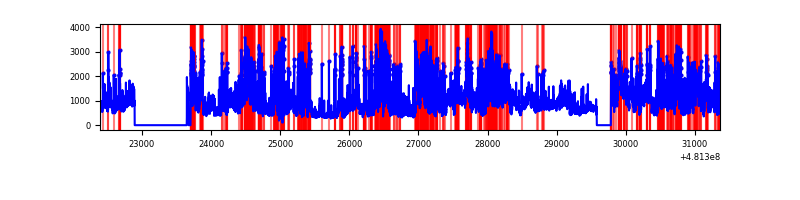 |
| B | 8969 | 7982 | 205 | 205 | 2.29% | 2.57% | 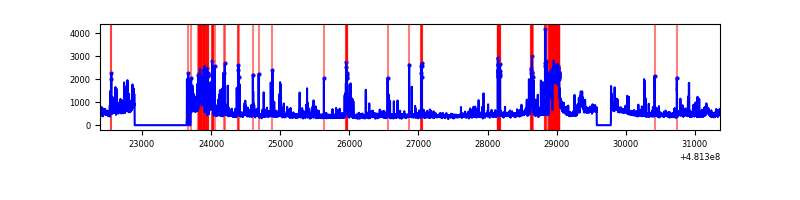 |
| C | 8969 | 7982 | 838 | 838 | 9.34% | 10.50% | 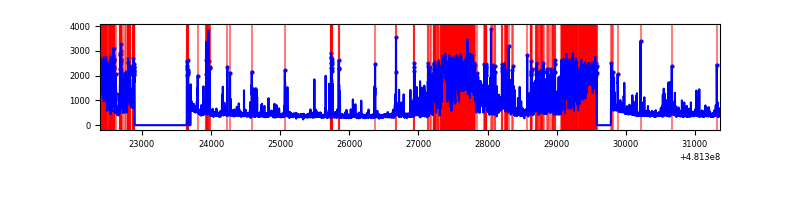 |
| D | 8969 | 7982 | 738 | 738 | 8.23% | 9.25% | 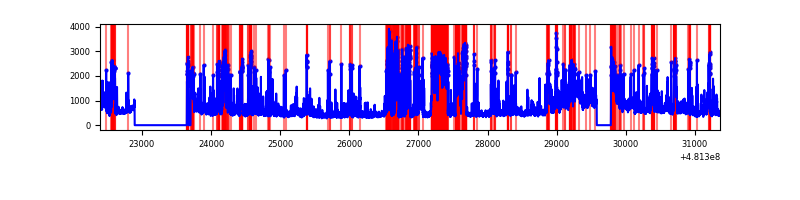 |
Top three noisy pixels from each quadrant. If the there are fewer than three noisy pixels in the level2.evt file, extra rows are filled as -1
| Pixel properties | Quadrant properties | ||||||
|---|---|---|---|---|---|---|---|
| Quadrant | DetID | PixID | Counts | Sigma | Mean | Median | Sigma |
| A | 7 | 64 | 2497551 | 12378.74 | 818 | 794 | 201.7 |
| A | 12 | 3 | 2220481 | 11005.05 | 818 | 794 | 201.7 |
| A | 12 | 194 | 264551 | 1307.69 | 818 | 794 | 201.7 |
| B | 15 | 52 | 331515 | 1783.76 | 864 | 832 | 185.4 |
| B | 5 | 185 | 305169 | 1641.65 | 864 | 832 | 185.4 |
| B | 4 | 206 | 144749 | 776.31 | 864 | 832 | 185.4 |
| C | 15 | 179 | 2492160 | 11090.61 | 818 | 808 | 224.6 |
| C | 4 | 12 | 355546 | 1579.17 | 818 | 808 | 224.6 |
| C | 13 | 3 | 331898 | 1473.89 | 818 | 808 | 224.6 |
| D | 3 | 12 | 1415753 | 6187.8 | 817 | 787 | 228.7 |
| D | 11 | 176 | 883566 | 3860.49 | 817 | 787 | 228.7 |
| D | 8 | 176 | 784353 | 3426.62 | 817 | 787 | 228.7 |
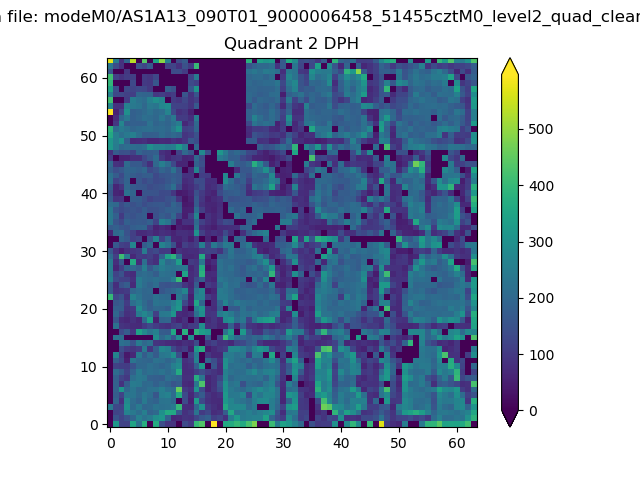
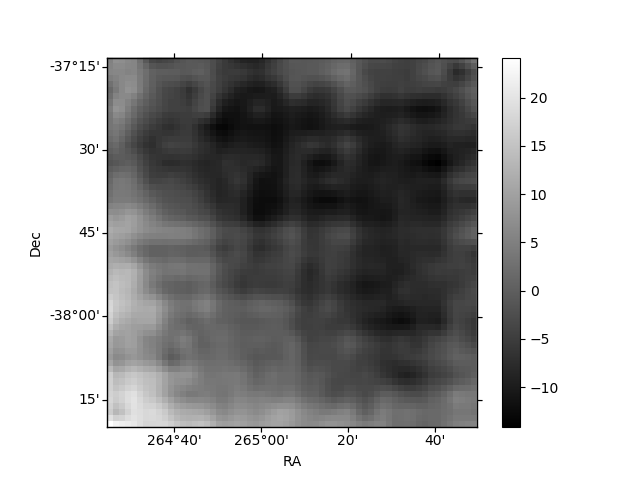
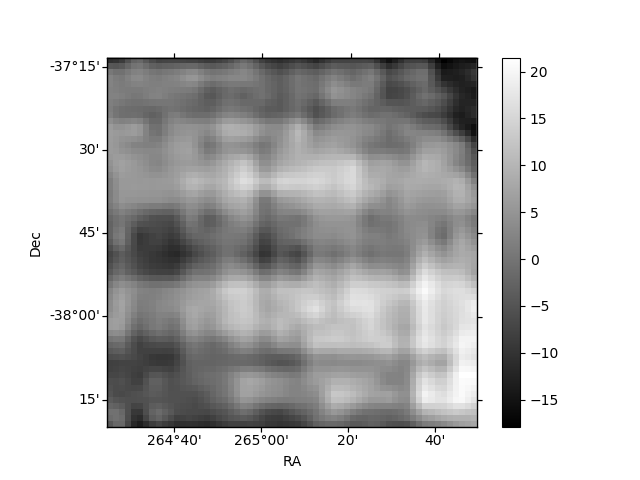
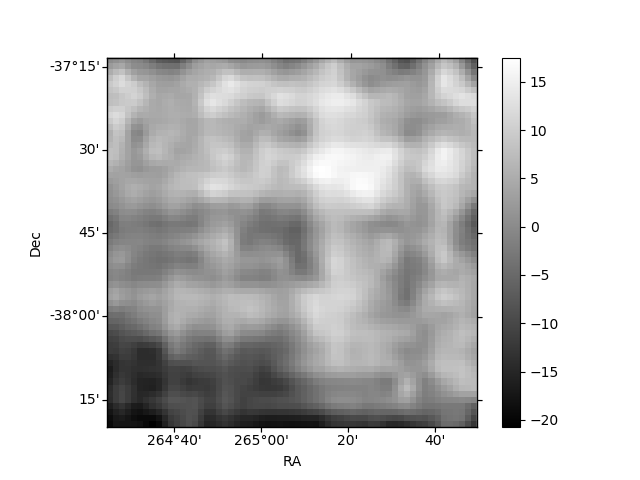
Histogram calculated using DETX and DETY for each event in the final _common_clean file
| Quadrant A | 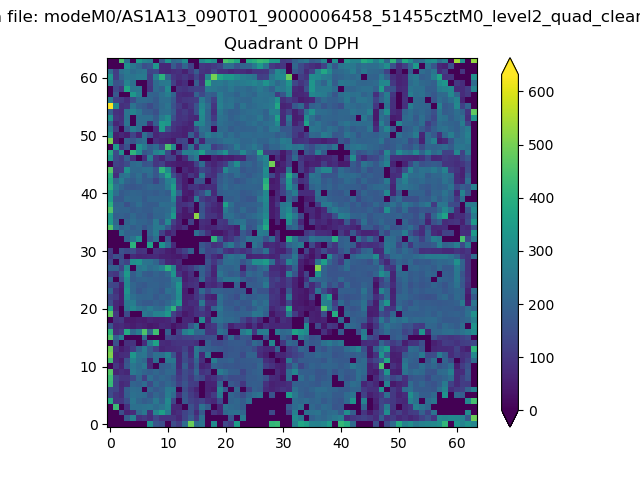 |
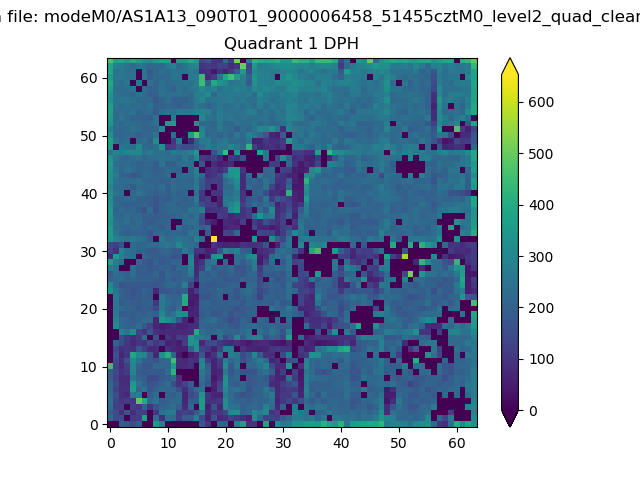 |
Quadrant B |
|---|---|---|---|
| Quadrant D | 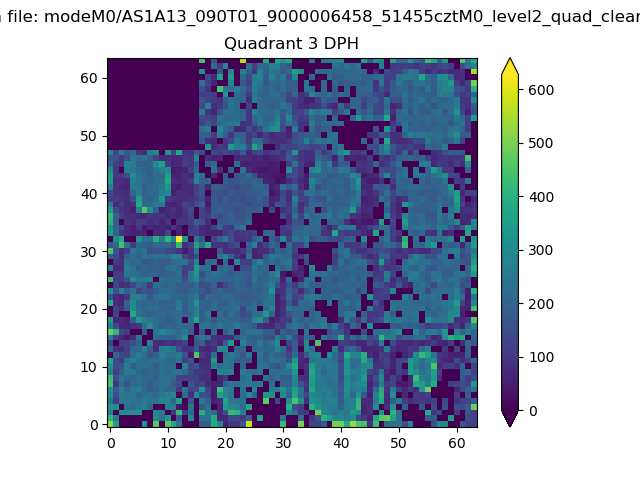 |
 |
Quadrant C |
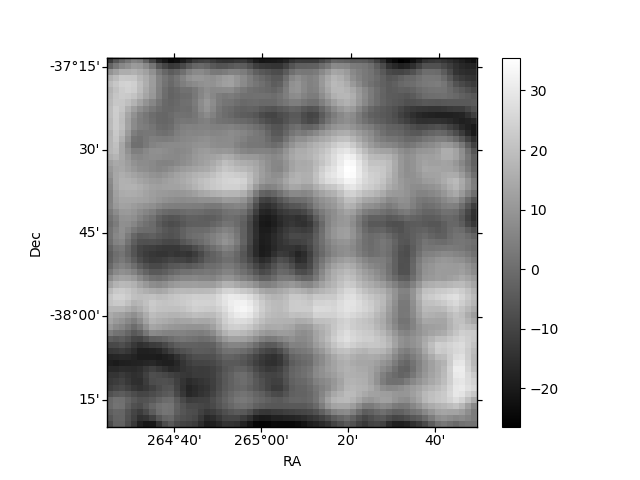
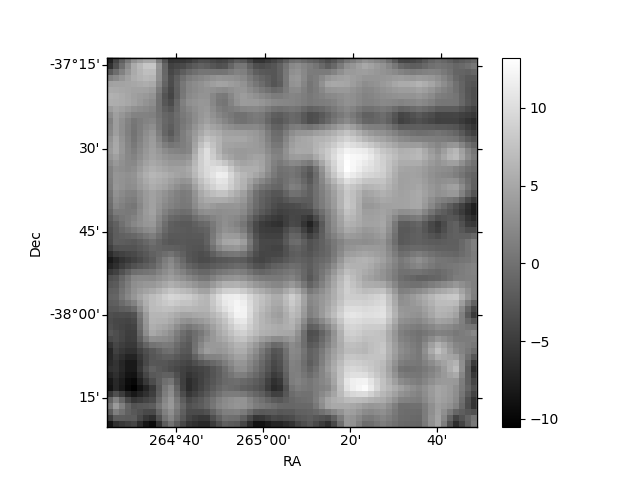
| Plot type | Count rate plots | Images |
|---|---|---|
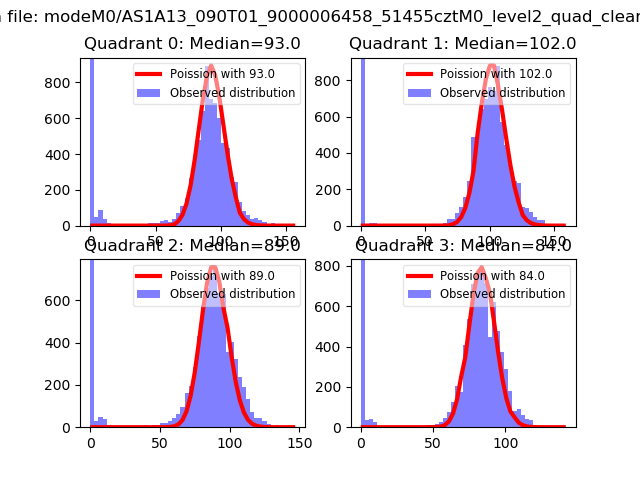
| Comparison with Poisson distribution Blue bars denote a histogram of data divided into 1 sec bins. Red curve is a Poisson curve with rate = median count rate of data. |
 |
 |
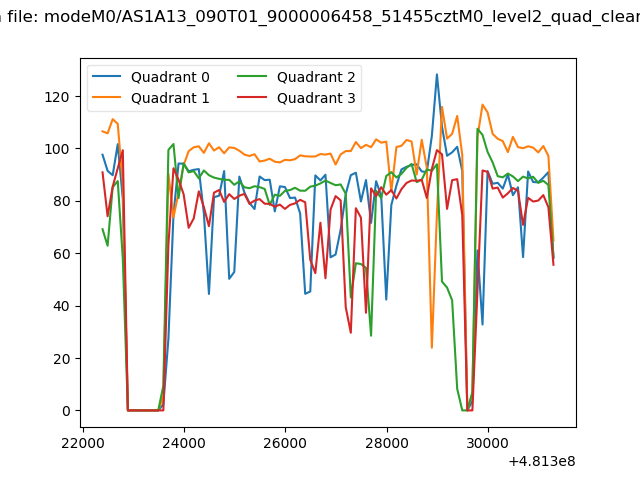
| Quadrant-wise count rates Data is divided into 100 sec bins |
 |
|
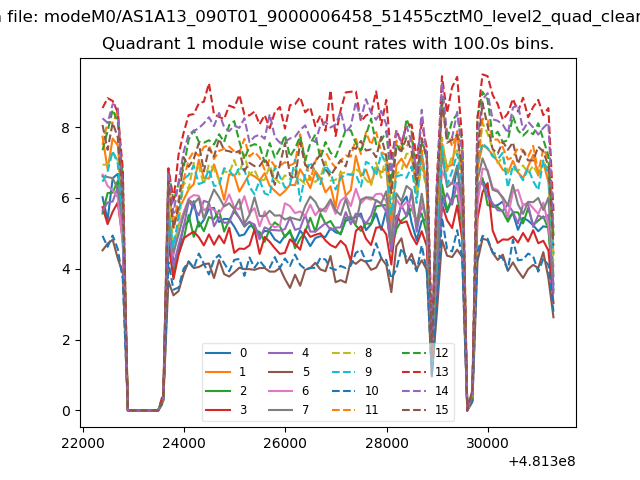
| Module-wise count rates for Quadrant A Data is divided into 100 sec bins |
 |
 |
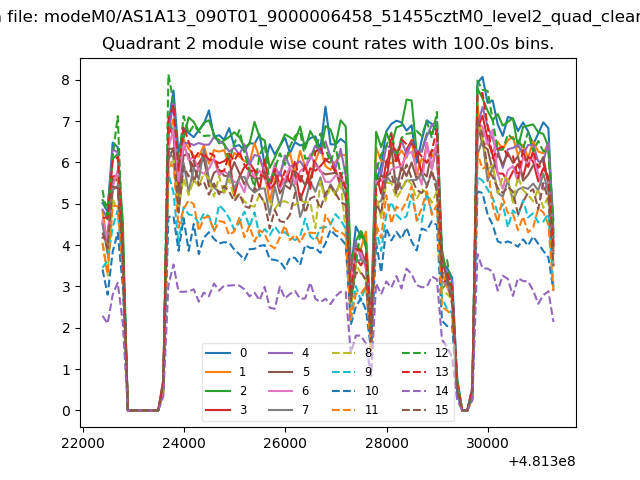
| Module-wise count rates for Quadrant B Data is divided into 100 sec bins |
 |
 |
| Module-wise count rates for Quadrant C Data is divided into 100 sec bins |
 |
 |
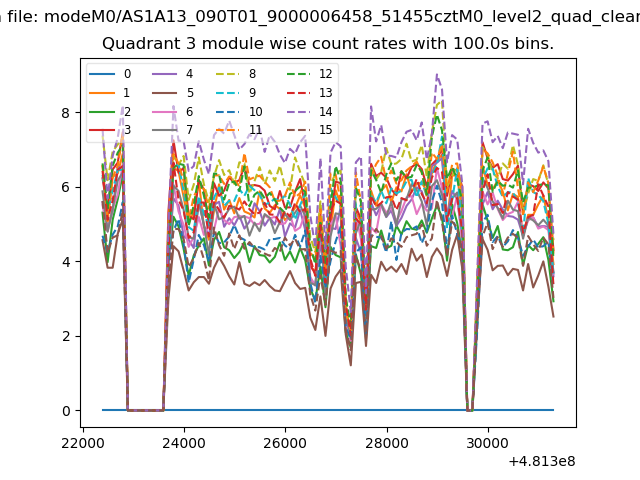
| Module-wise count rates for Quadrant D Data is divided into 100 sec bins |
 |
 |
| Parameter | Plot |
|---|---|
| CZT HV Monitor | 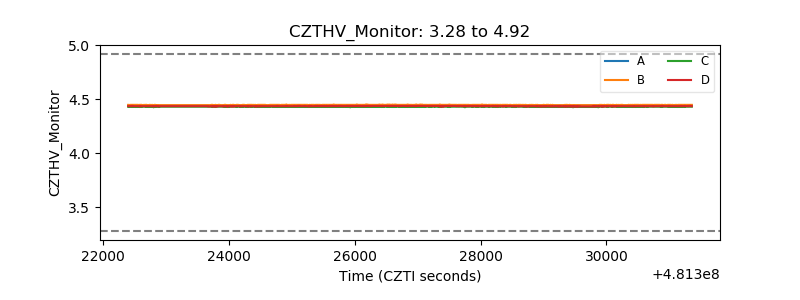 |
| D_VDD | 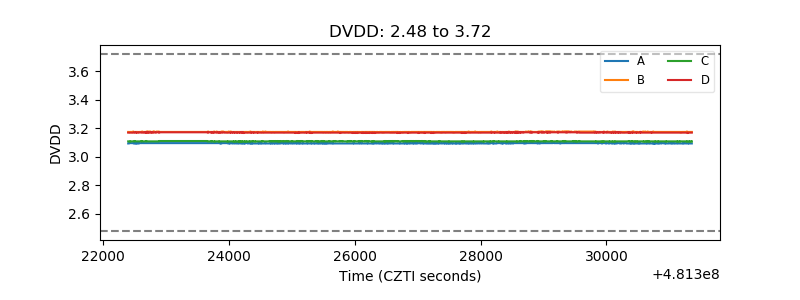 |
| Temperature 1 | 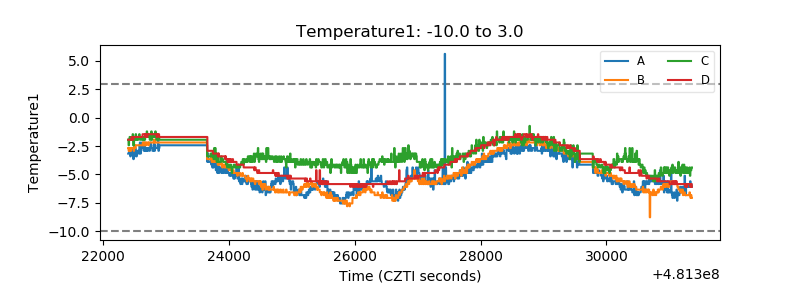 |
| Veto HV Monitor | 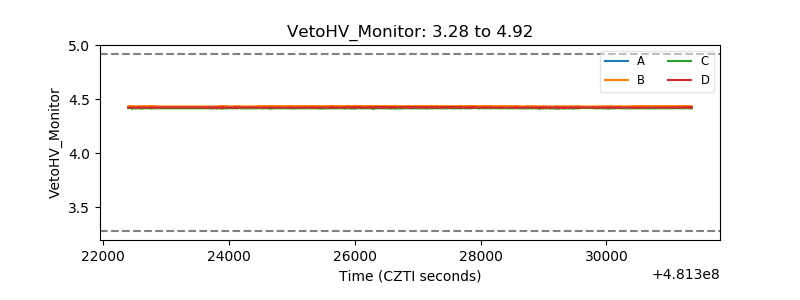 |
| Veto LLD | 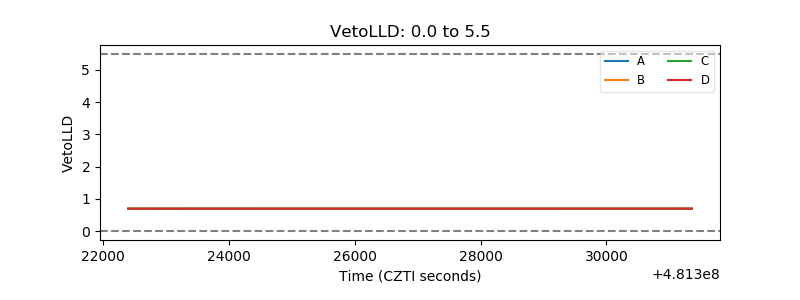 |
| Alpha Counter | 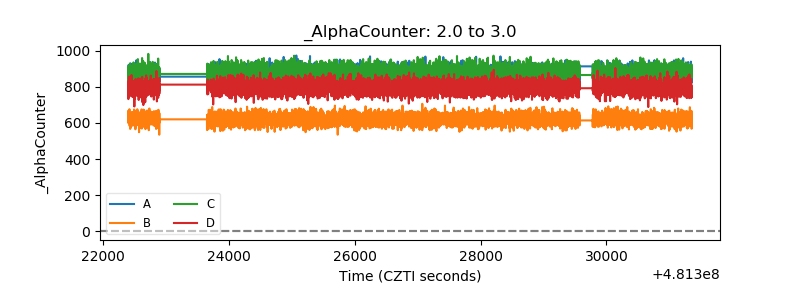 |
| _CPM_Rate | 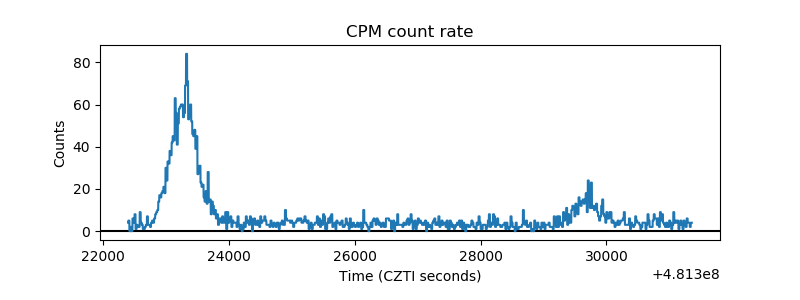 |
| CZT Counter | 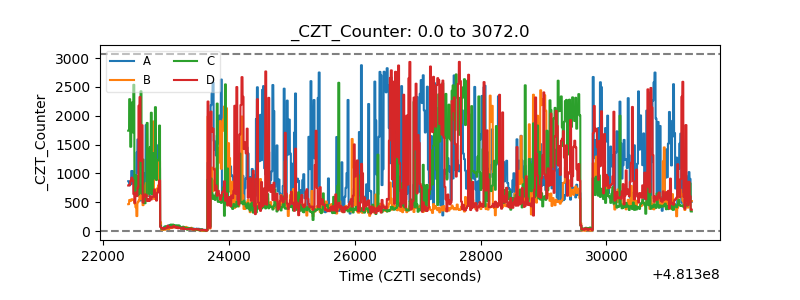 |
| +2.5 Volts monitor |  |
| +5 Volts monitor | 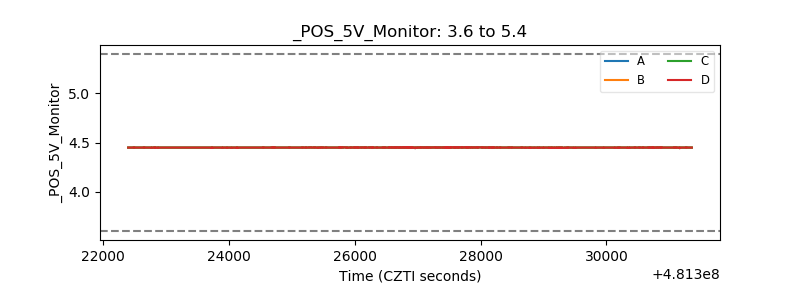 |
| _ROLL_ROT | 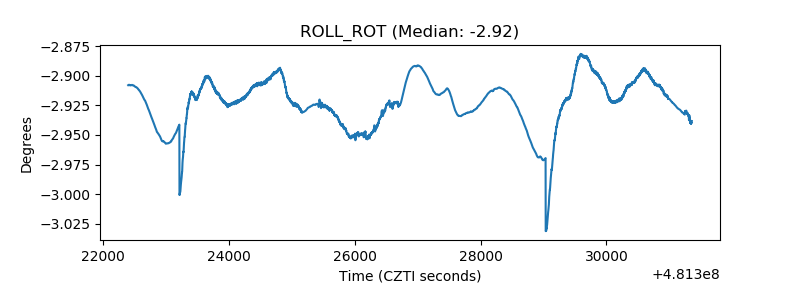 |
| _Roll_DEC | 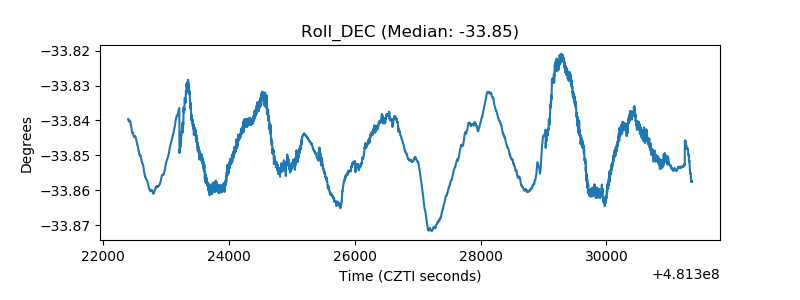 |
| _Roll_RA | 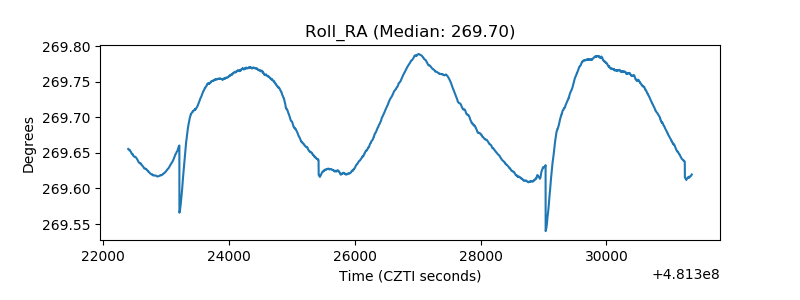 |
| Veto Counter | 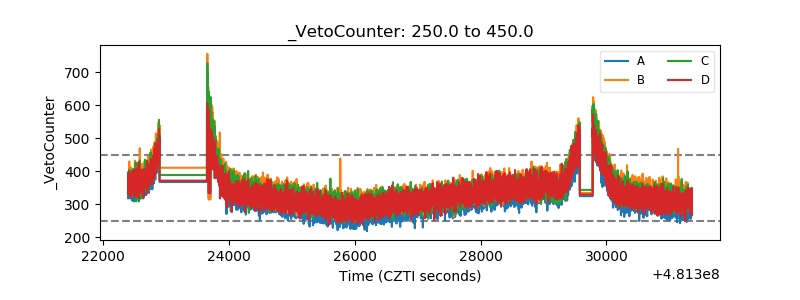 |