| Param | Original file | Final file |
|---|---|---|
| Filename | modeM0/AS1A13_037T05_9000006460_51642cztM0_level2.fits | modeM0/AS1A13_037T05_9000006460_51642cztM0_level2_quad_clean.evt |
| Size (bytes) | 535,613,760 | 100,834,560 |
| Size | 510.8 MB | 96.2 MB |
| Events in quadrant A | 5,535,151 | 641,056 |
| Events in quadrant B | 4,749,656 | 694,219 |
| Events in quadrant C | 4,418,466 | 634,489 |
| Events in quadrant D | 4,582,172 | 598,036 |
| Mode M9 | |||
|---|---|---|---|
| Quadrant | BADHDUFLAG | Total packets | Discarded packets |
| A | 0 | 9 | 0 |
| B | 0 | 9 | 0 |
| C | 0 | 9 | 0 |
| D | 0 | 9 | 0 |
| Mode M0 | |||
|---|---|---|---|
| Quadrant | BADHDUFLAG | Total packets | Discarded packets |
| A | 0 | 21224 | 2 |
| B | 0 | 18757 | 1 |
| C | 0 | 17956 | 1 |
| D | 0 | 18248 | 1 |
| Mode SS | |||
|---|---|---|---|
| Quadrant | BADHDUFLAG | Total packets | Discarded packets |
| A | 0 | 140 | 0 |
| B | 0 | 140 | 0 |
| C | 0 | 140 | 0 |
| D | 0 | 140 | 0 |
| Quadrant | Total seconds | Saturated seconds | Saturation percentage |
|---|---|---|---|
| A | 6973 | 509 | 7.299584% |
| B | 6973 | 457 | 6.553851% |
| C | 6973 | 326 | 4.675176% |
| D | 6973 | 275 | 3.943783% |
Noise dominated data is calculated using 1-second bins in cleaned event files. If a bin has >2000 counts, and if more than 50% of those come from <1% of pixels, then it is considered to be noise-dominated and hence unusable.
| Quadrant | # 1 sec bins | Bins with >0 counts | Bins with >2000 counts | High rate bins dominated by noise | Noise dominated (total time) | Noise dominated (detector-on time) | Marked lightcurve |
|---|---|---|---|---|---|---|---|
| A | 7838 | 6974 | 247 | 247 | 3.15% | 3.54% | 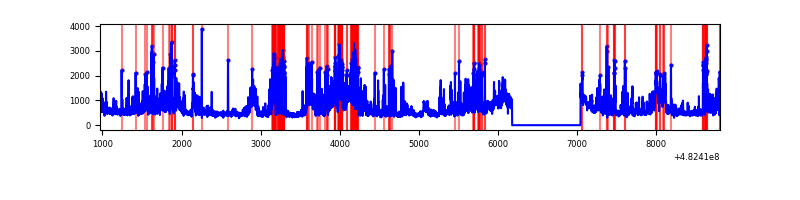 |
| B | 7838 | 6974 | 135 | 135 | 1.72% | 1.94% | 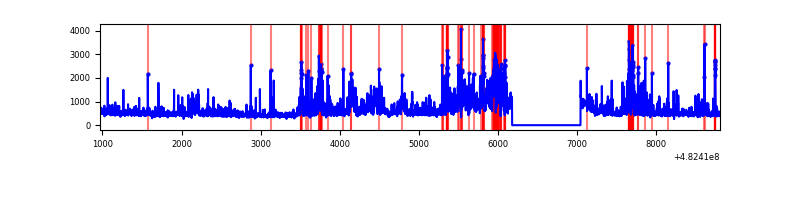 |
| C | 7838 | 6974 | 150 | 150 | 1.91% | 2.15% | 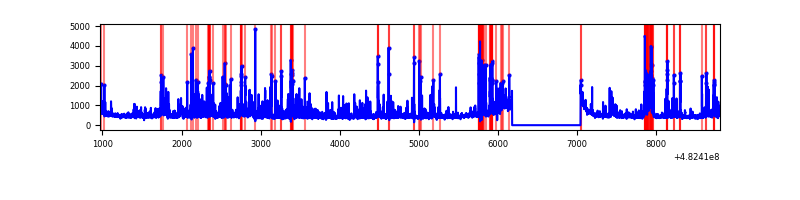 |
| D | 7838 | 6974 | 114 | 114 | 1.45% | 1.63% | 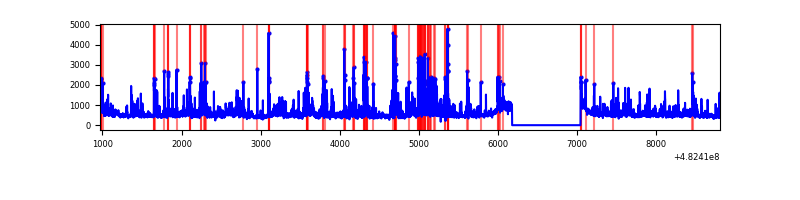 |
Top three noisy pixels from each quadrant. If the there are fewer than three noisy pixels in the level2.evt file, extra rows are filled as -1
| Pixel properties | Quadrant properties | ||||||
|---|---|---|---|---|---|---|---|
| Quadrant | DetID | PixID | Counts | Sigma | Mean | Median | Sigma |
| A | 12 | 80 | 736069 | 3879.03 | 779 | 759 | 189.6 |
| A | 12 | 250 | 586758 | 3091.36 | 779 | 759 | 189.6 |
| A | 4 | 175 | 335538 | 1766.08 | 779 | 759 | 189.6 |
| B | 5 | 185 | 627735 | 3823.98 | 765 | 739 | 164.0 |
| B | 10 | 44 | 468077 | 2850.24 | 765 | 739 | 164.0 |
| B | 7 | 252 | 90685 | 548.57 | 765 | 739 | 164.0 |
| C | 15 | 189 | 545619 | 2604.85 | 764 | 758 | 209.2 |
| C | 10 | 19 | 179023 | 852.24 | 764 | 758 | 209.2 |
| C | 12 | 254 | 163886 | 779.88 | 764 | 758 | 209.2 |
| D | 8 | 176 | 546017 | 2579.53 | 766 | 738 | 211.4 |
| D | 2 | 249 | 412200 | 1946.49 | 766 | 738 | 211.4 |
| D | 1 | 3 | 255769 | 1206.47 | 766 | 738 | 211.4 |
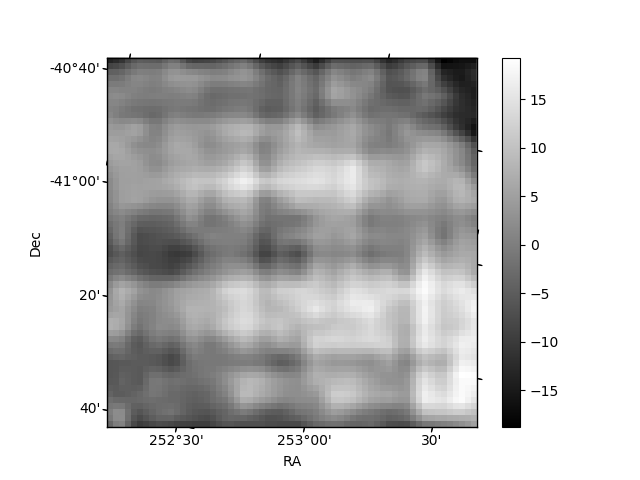
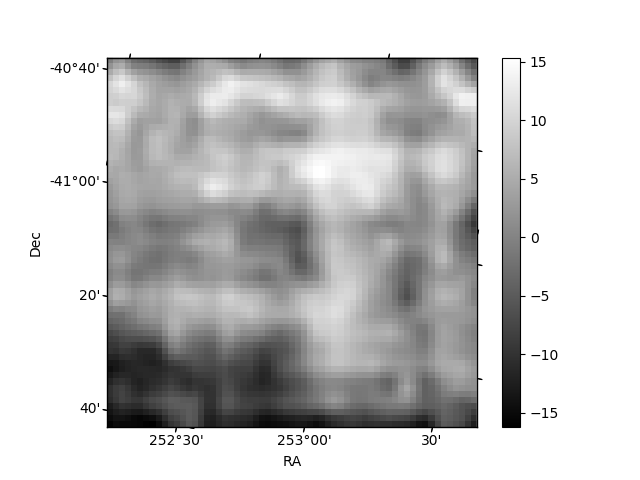
Histogram calculated using DETX and DETY for each event in the final _common_clean file
| Quadrant A | 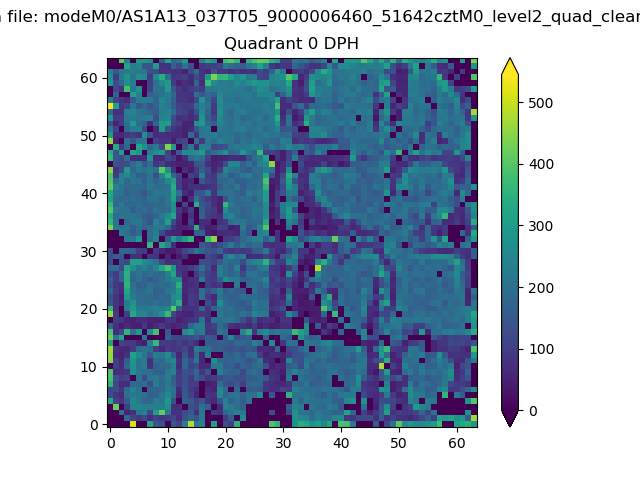 |
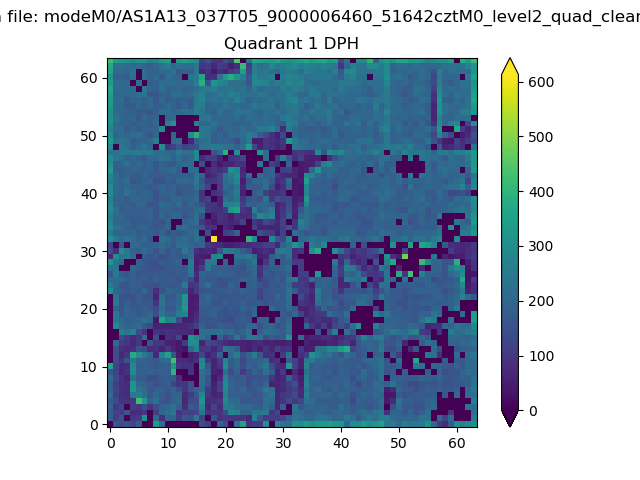 |
Quadrant B |
|---|---|---|---|
| Quadrant D | 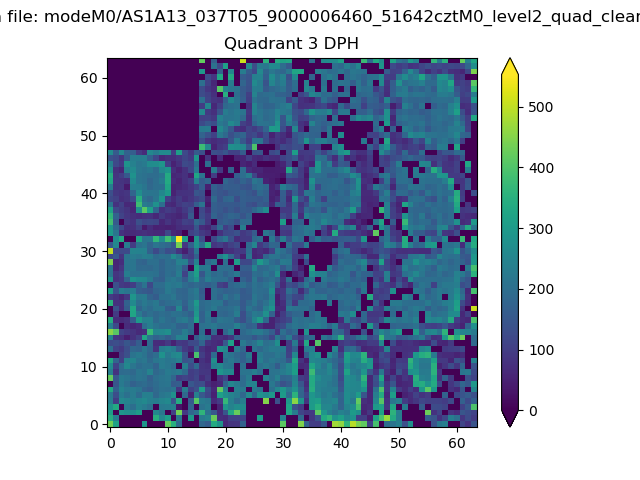 |
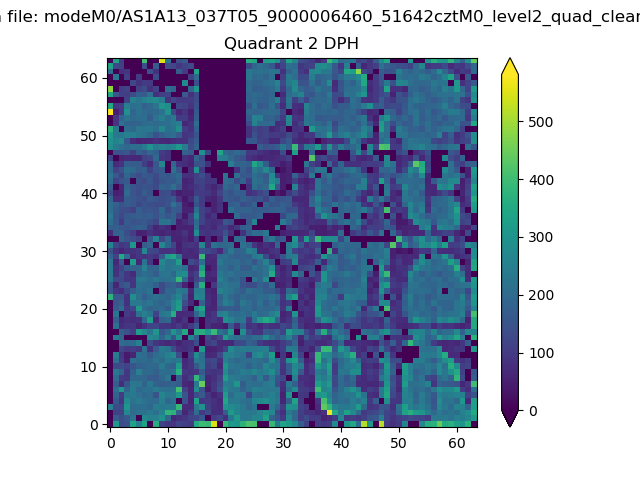 |
Quadrant C |
| Plot type | Count rate plots | Images |
|---|---|---|
| Comparison with Poisson distribution Blue bars denote a histogram of data divided into 1 sec bins. Red curve is a Poisson curve with rate = median count rate of data. |
 |
 |
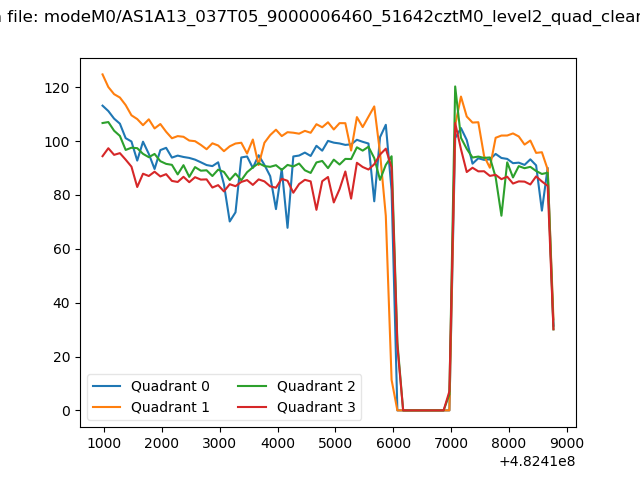
| Quadrant-wise count rates Data is divided into 100 sec bins |
 |
|
| Module-wise count rates for Quadrant A Data is divided into 100 sec bins |
 |
 |
| Module-wise count rates for Quadrant B Data is divided into 100 sec bins |
 |
 |
| Module-wise count rates for Quadrant C Data is divided into 100 sec bins |
 |
 |
| Module-wise count rates for Quadrant D Data is divided into 100 sec bins |
 |
 |
| Parameter | Plot |
|---|---|
| CZT HV Monitor |  |
| D_VDD |  |
| Temperature 1 | 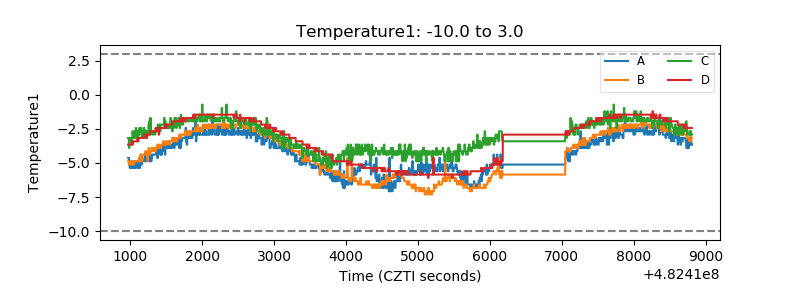 |
| Veto HV Monitor | 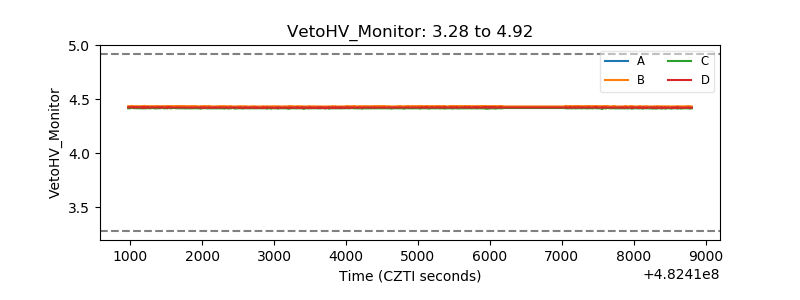 |
| Veto LLD | 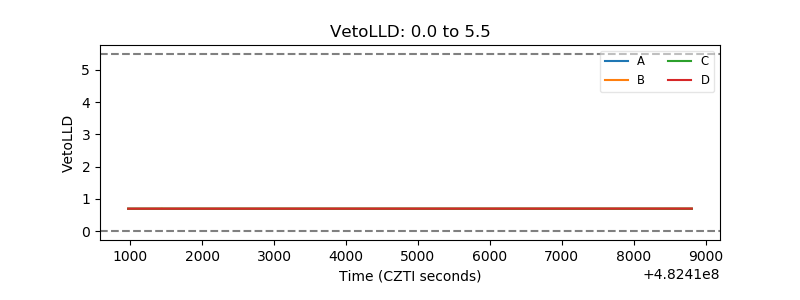 |
| Alpha Counter | 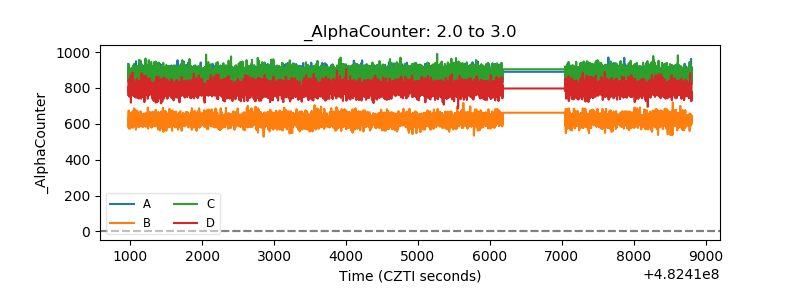 |
| _CPM_Rate | 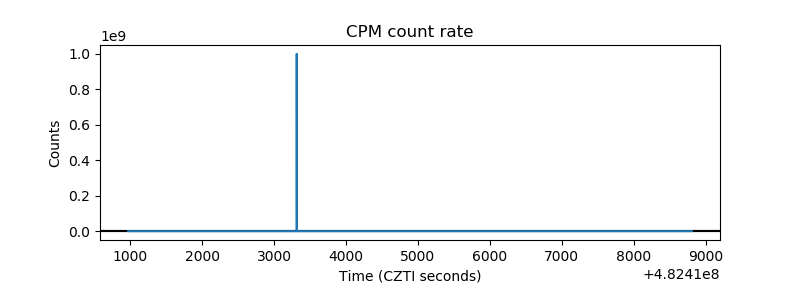 |
| CZT Counter | 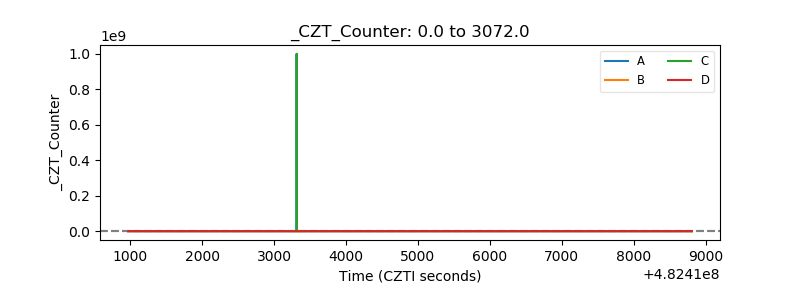 |
| +2.5 Volts monitor |  |
| +5 Volts monitor | 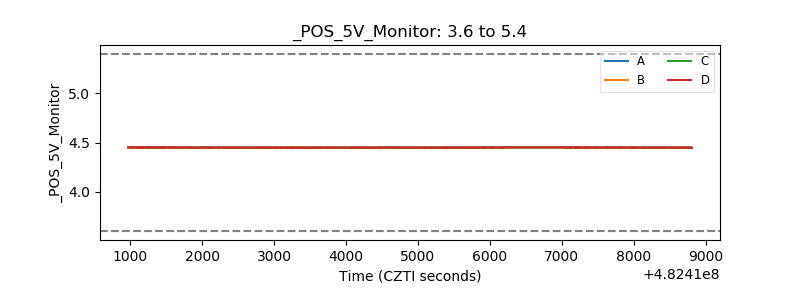 |
| _ROLL_ROT |  |
| _Roll_DEC | 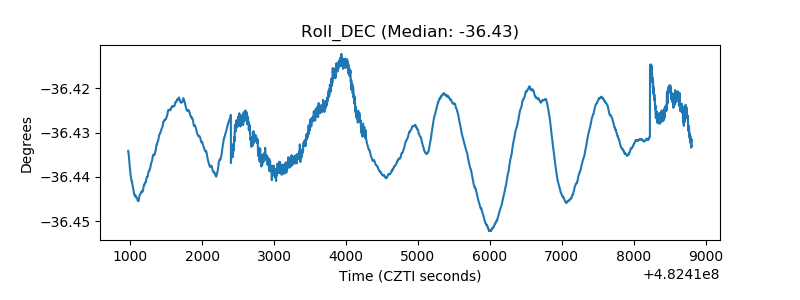 |
| _Roll_RA | 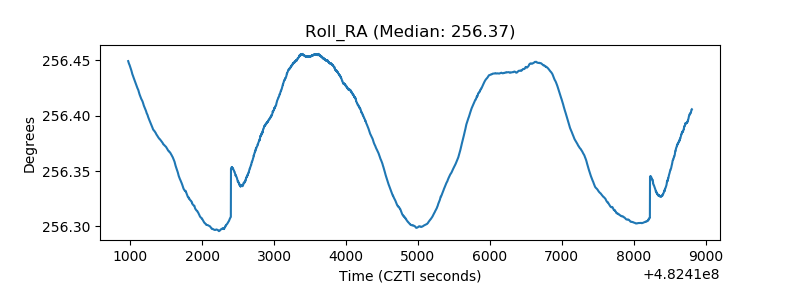 |
| Veto Counter |  |