| Param | Original file | Final file |
|---|---|---|
| Filename | modeM0/AS1A13_031T01_9000006462_51704cztM0_level2.fits | modeM0/AS1A13_031T01_9000006462_51704cztM0_level2_quad_clean.evt |
| Size (bytes) | 639,901,440 | 120,507,840 |
| Size | 610.3 MB | 114.9 MB |
| Events in quadrant A | 6,459,503 | 793,809 |
| Events in quadrant B | 5,765,400 | 822,488 |
| Events in quadrant C | 5,479,383 | 743,759 |
| Events in quadrant D | 5,328,391 | 702,271 |
| Mode M0 | |||
|---|---|---|---|
| Quadrant | BADHDUFLAG | Total packets | Discarded packets |
| A | 0 | 25163 | 0 |
| B | 0 | 22967 | 0 |
| C | 0 | 22244 | 0 |
| D | 0 | 21809 | 0 |
| Mode SS | |||
|---|---|---|---|
| Quadrant | BADHDUFLAG | Total packets | Discarded packets |
| A | 0 | 168 | 0 |
| B | 0 | 168 | 0 |
| C | 0 | 168 | 0 |
| D | 0 | 168 | 0 |
| Quadrant | Total seconds | Saturated seconds | Saturation percentage |
|---|---|---|---|
| A | 8445 | 165 | 1.953819% |
| B | 8445 | 585 | 6.927176% |
| C | 8446 | 379 | 4.487331% |
| D | 8446 | 256 | 3.031021% |
Noise dominated data is calculated using 1-second bins in cleaned event files. If a bin has >2000 counts, and if more than 50% of those come from <1% of pixels, then it is considered to be noise-dominated and hence unusable.
| Quadrant | # 1 sec bins | Bins with >0 counts | Bins with >2000 counts | High rate bins dominated by noise | Noise dominated (total time) | Noise dominated (detector-on time) | Marked lightcurve |
|---|---|---|---|---|---|---|---|
| A | 8445 | 8445 | 74 | 74 | 0.88% | 0.88% | 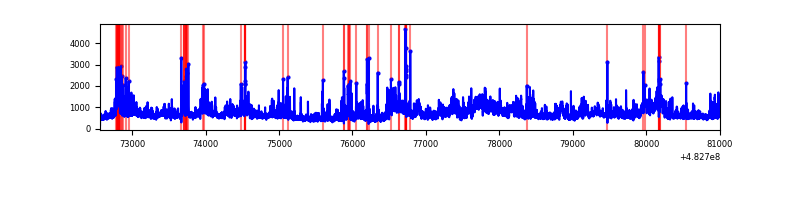 |
| B | 8445 | 8445 | 341 | 341 | 4.04% | 4.04% | 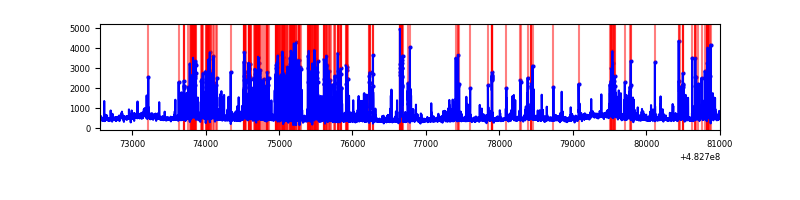 |
| C | 8446 | 8446 | 264 | 264 | 3.13% | 3.13% | 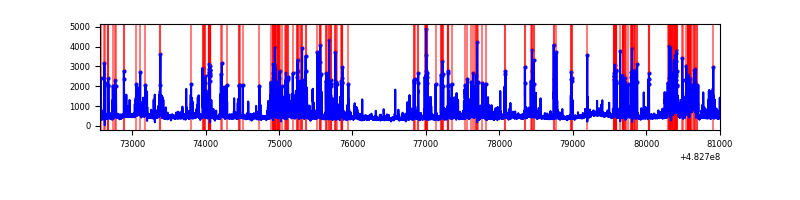 |
| D | 8446 | 8446 | 219 | 219 | 2.59% | 2.59% | 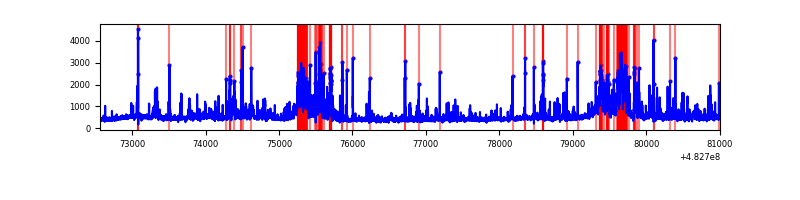 |
Top three noisy pixels from each quadrant. If the there are fewer than three noisy pixels in the level2.evt file, extra rows are filled as -1
| Pixel properties | Quadrant properties | ||||||
|---|---|---|---|---|---|---|---|
| Quadrant | DetID | PixID | Counts | Sigma | Mean | Median | Sigma |
| A | 12 | 3 | 913115 | 4052.63 | 915 | 894 | 225.1 |
| A | 3 | 14 | 617964 | 2741.4 | 915 | 894 | 225.1 |
| A | 3 | 46 | 479947 | 2128.24 | 915 | 894 | 225.1 |
| B | 1 | 223 | 1609530 | 8487.84 | 890 | 861 | 189.5 |
| B | 0 | 213 | 220914 | 1161.07 | 890 | 861 | 189.5 |
| B | 8 | 128 | 50817 | 263.58 | 890 | 861 | 189.5 |
| C | 15 | 189 | 613167 | 2526.6 | 885 | 879 | 242.3 |
| C | 12 | 254 | 481159 | 1981.87 | 885 | 879 | 242.3 |
| C | 15 | 178 | 259787 | 1068.38 | 885 | 879 | 242.3 |
| D | 7 | 60 | 892710 | 3671.71 | 880 | 848 | 242.9 |
| D | 3 | 12 | 149122 | 610.43 | 880 | 848 | 242.9 |
| D | 6 | 228 | 137476 | 562.48 | 880 | 848 | 242.9 |
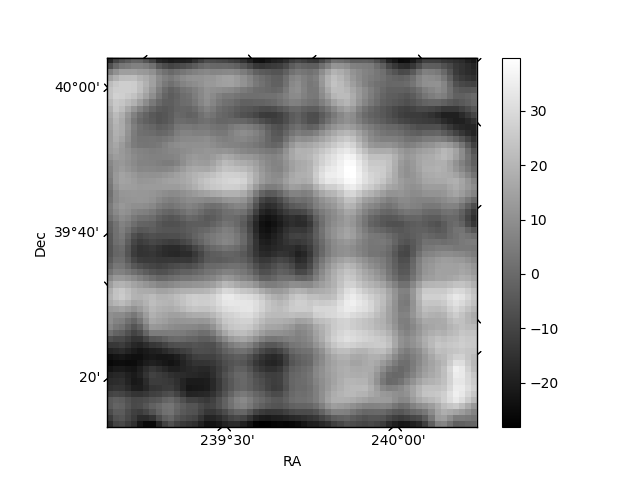
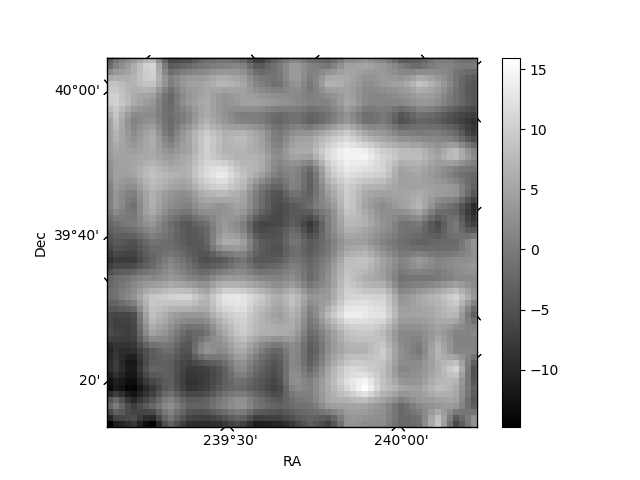
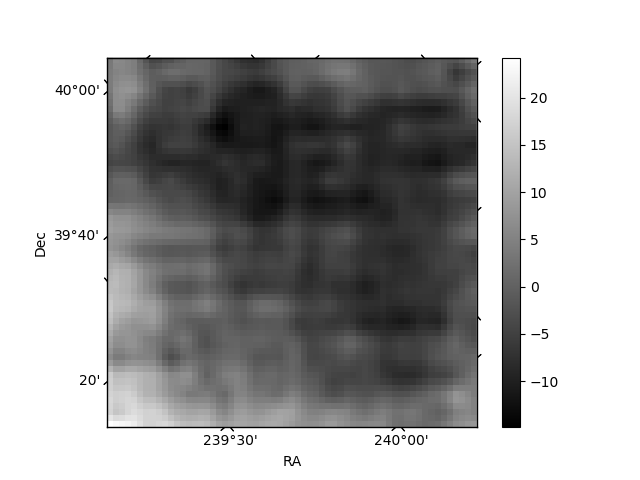
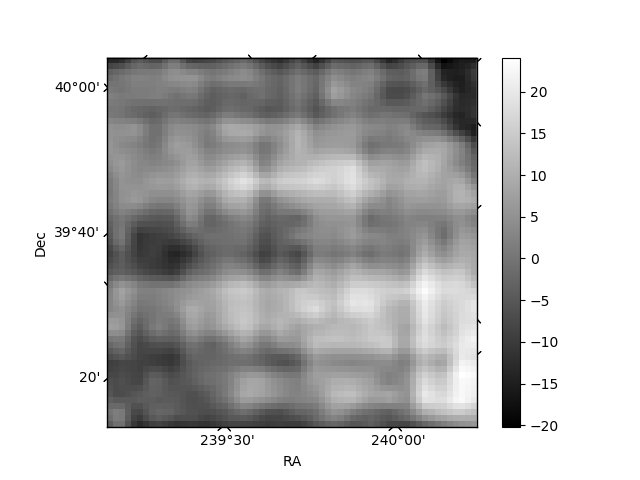
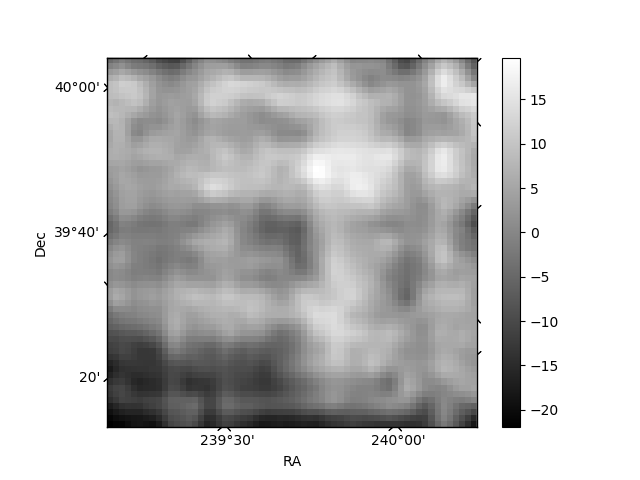
Histogram calculated using DETX and DETY for each event in the final _common_clean file
| Quadrant A | 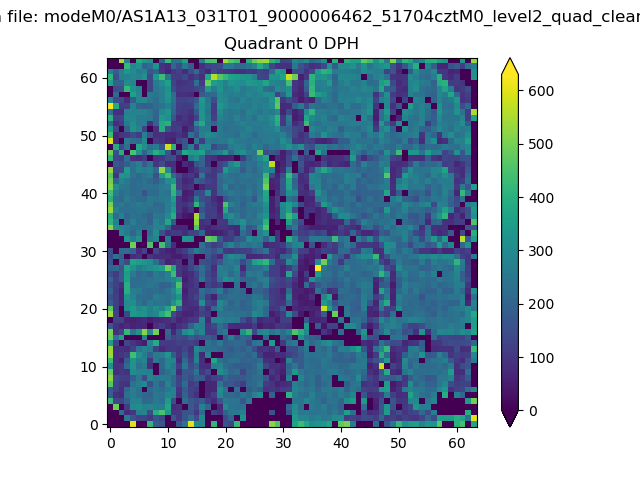 |
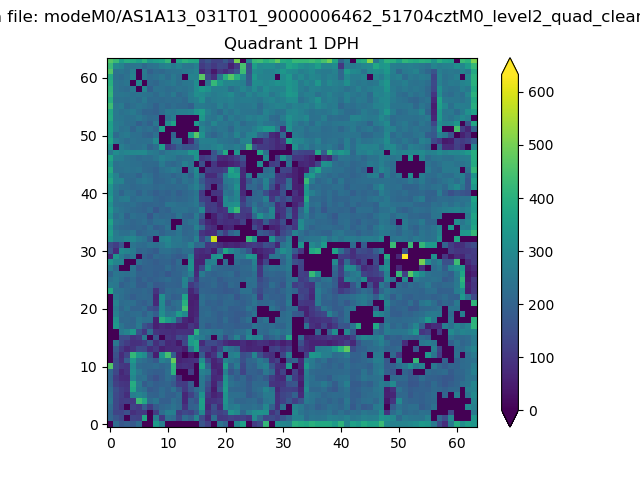 |
Quadrant B |
|---|---|---|---|
| Quadrant D | 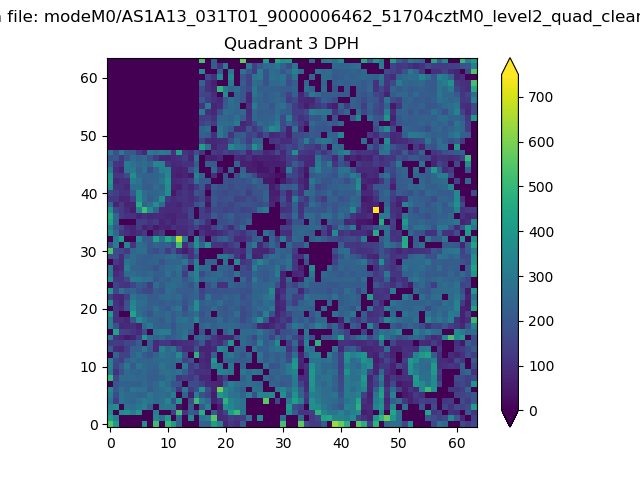 |
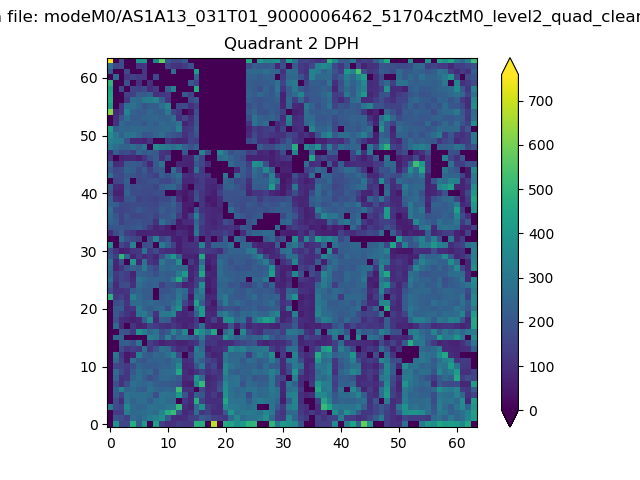 |
Quadrant C |
| Plot type | Count rate plots | Images |
|---|---|---|
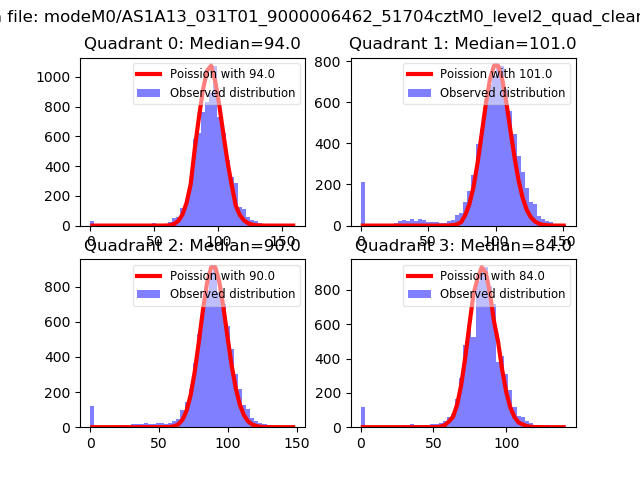
| Comparison with Poisson distribution Blue bars denote a histogram of data divided into 1 sec bins. Red curve is a Poisson curve with rate = median count rate of data. |
 |
 |
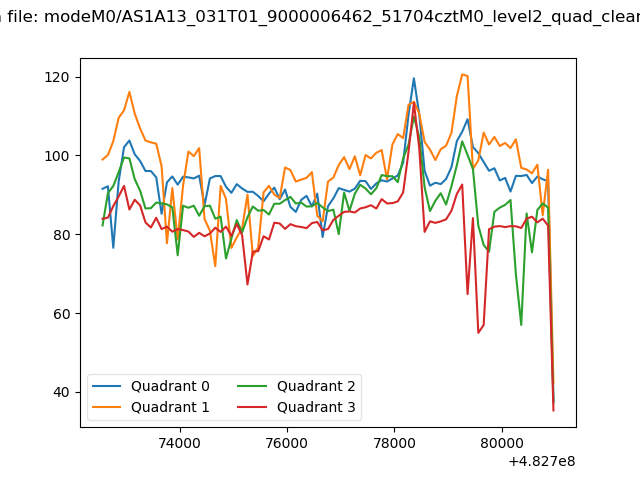
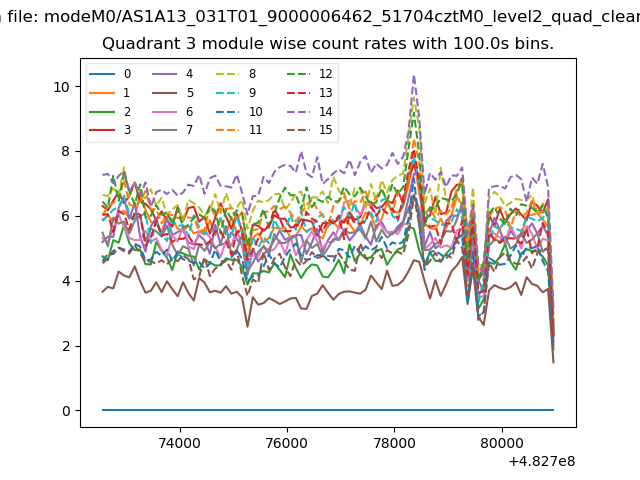
| Quadrant-wise count rates Data is divided into 100 sec bins |
 |
|
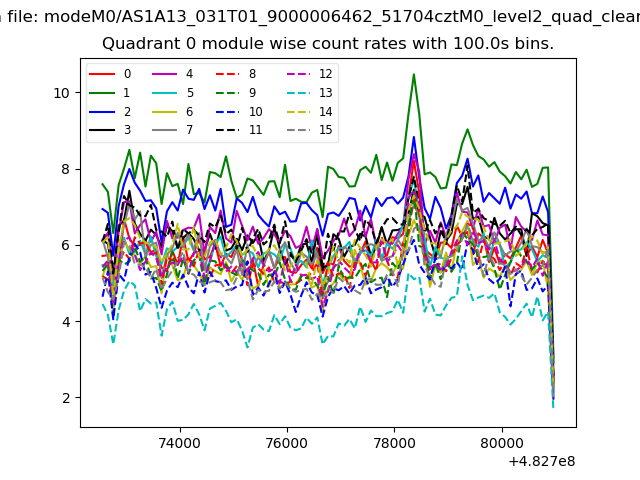
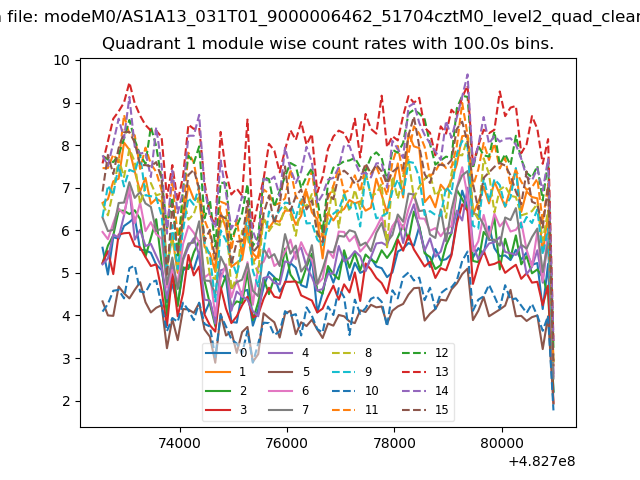
| Module-wise count rates for Quadrant A Data is divided into 100 sec bins |
 |
 |
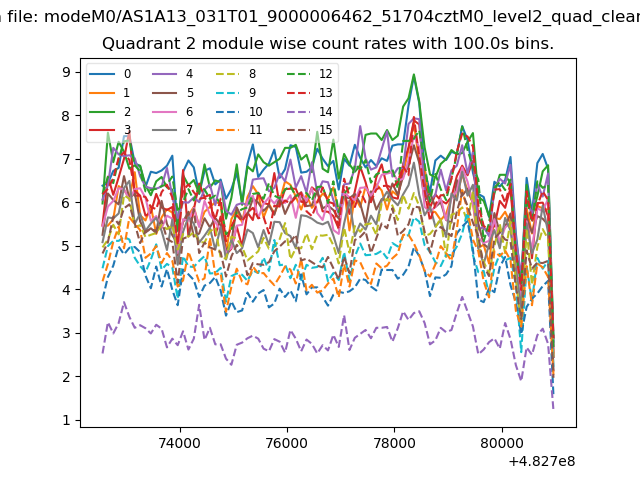
| Module-wise count rates for Quadrant B Data is divided into 100 sec bins |
 |
 |
| Module-wise count rates for Quadrant C Data is divided into 100 sec bins |
 |
 |
| Module-wise count rates for Quadrant D Data is divided into 100 sec bins |
 |
 |
| Parameter | Plot |
|---|---|
| CZT HV Monitor | 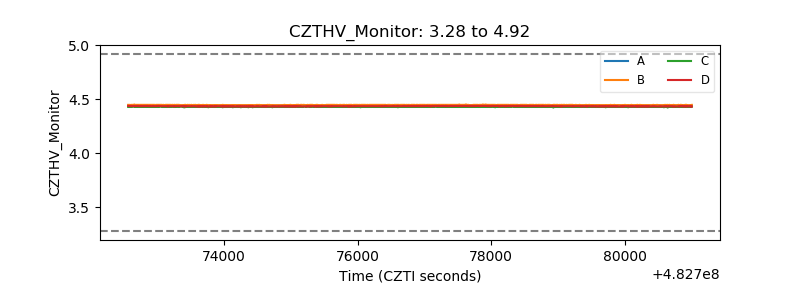 |
| D_VDD | 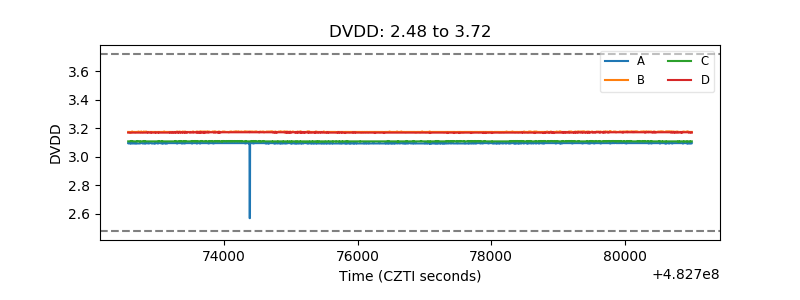 |
| Temperature 1 | 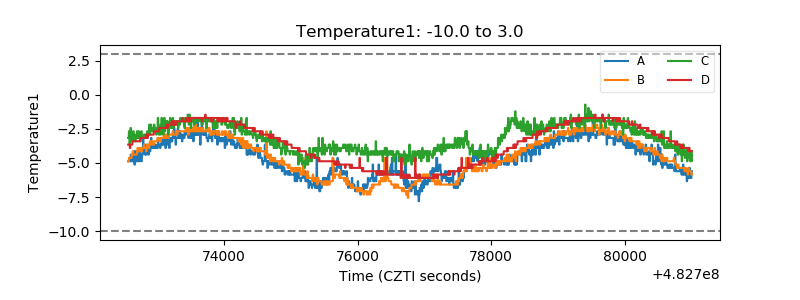 |
| Veto HV Monitor | 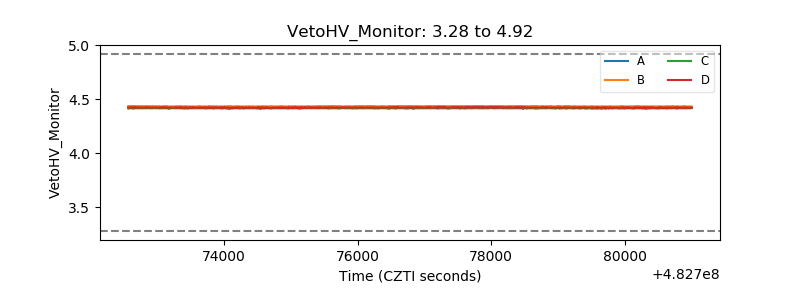 |
| Veto LLD | 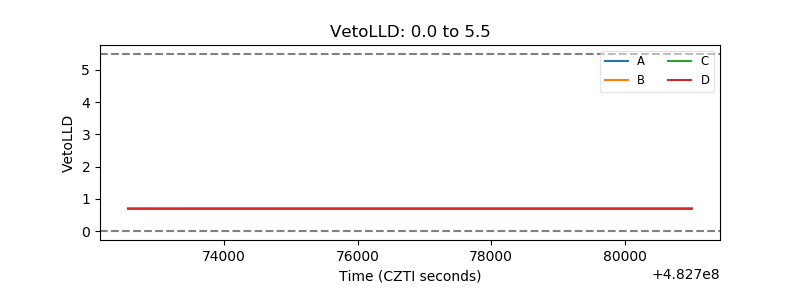 |
| Alpha Counter | 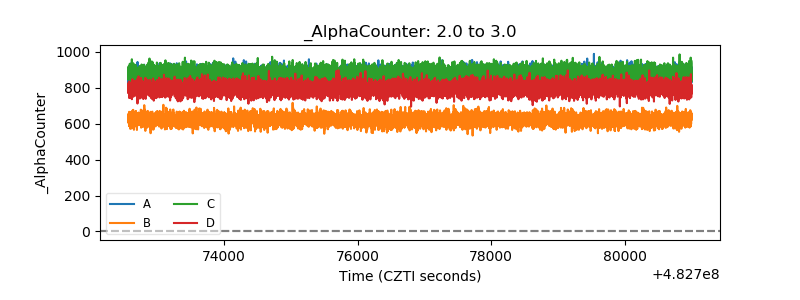 |
| _CPM_Rate | 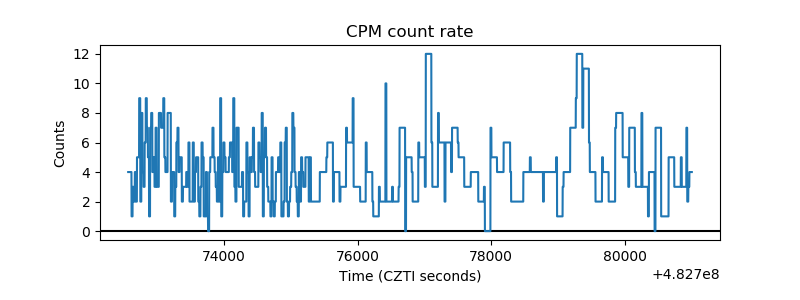 |
| CZT Counter | 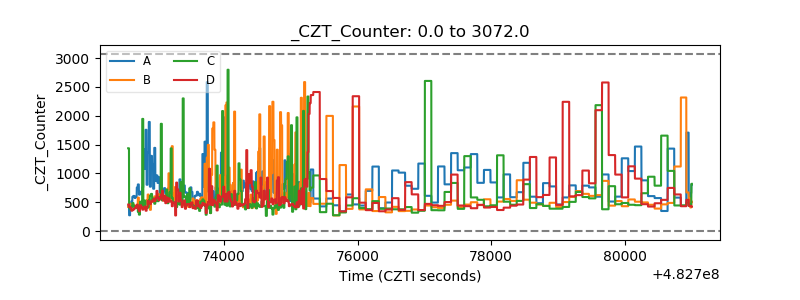 |
| +2.5 Volts monitor |  |
| +5 Volts monitor | 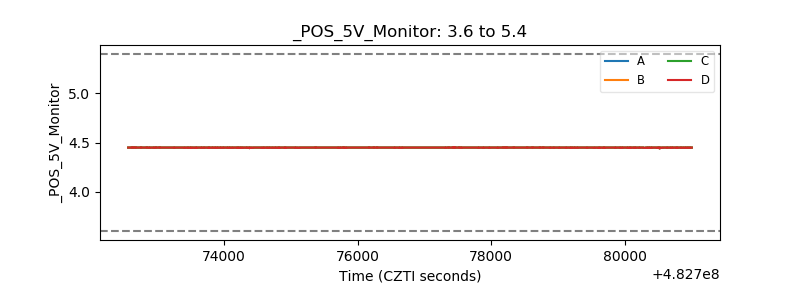 |
| _ROLL_ROT | 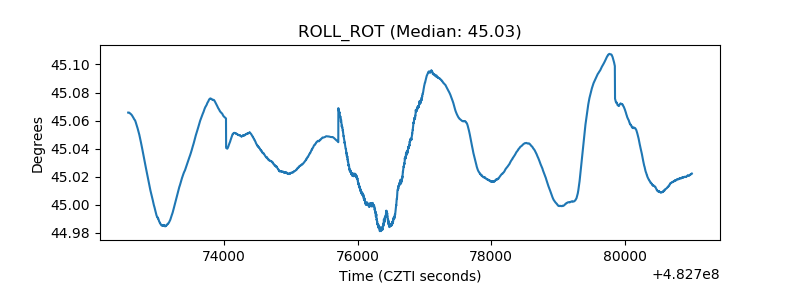 |
| _Roll_DEC | 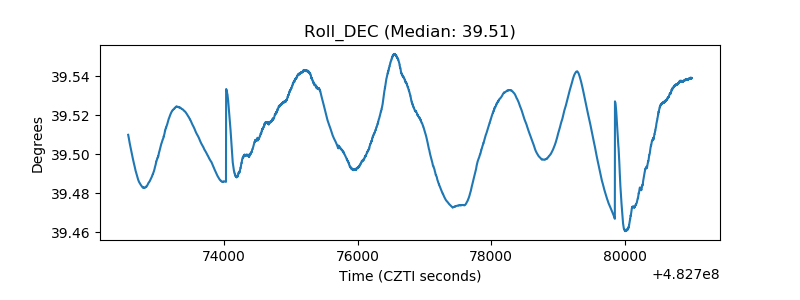 |
| _Roll_RA | 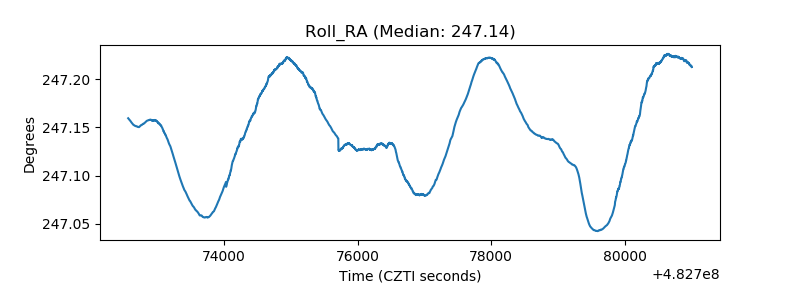 |
| Veto Counter | 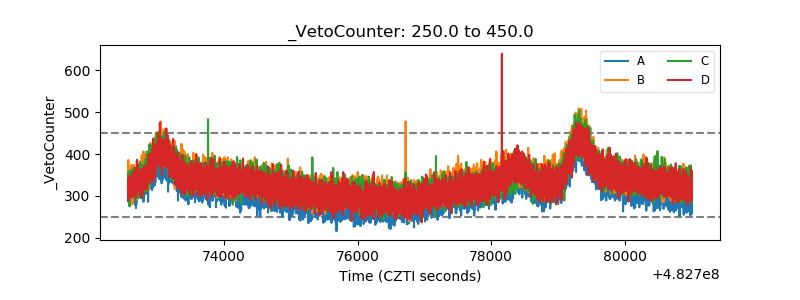 |