| Param | Original file | Final file |
|---|---|---|
| Filename | modeM0/AS1A13_090T01_9000006464_51759cztM0_level2.fits | modeM0/AS1A13_090T01_9000006464_51759cztM0_level2_quad_clean.evt |
| Size (bytes) | 831,778,560 | 88,848,000 |
| Size | 793.2 MB | 84.7 MB |
| Events in quadrant A | 4,771,164 | 666,065 |
| Events in quadrant B | 5,292,304 | 700,236 |
| Events in quadrant C | 5,334,818 | 614,934 |
| Events in quadrant D | 14,824,101 | 199,746 |
| Mode M9 | |||
|---|---|---|---|
| Quadrant | BADHDUFLAG | Total packets | Discarded packets |
| A | 0 | 6 | 0 |
| B | 0 | 6 | 0 |
| C | 0 | 6 | 0 |
| D | 0 | 6 | 0 |
| Mode SS | |||
|---|---|---|---|
| Quadrant | BADHDUFLAG | Total packets | Discarded packets |
| A | 0 | 148 | 0 |
| B | 0 | 148 | 0 |
| C | 0 | 148 | 0 |
| D | 0 | 148 | 0 |
| Mode M0 | |||
|---|---|---|---|
| Quadrant | BADHDUFLAG | Total packets | Discarded packets |
| A | 0 | 19104 | 1 |
| B | 0 | 20700 | 1 |
| C | 0 | 20980 | 1 |
| D | 0 | 49122 | 7 |
| Quadrant | Total seconds | Saturated seconds | Saturation percentage |
|---|---|---|---|
| A | 7312 | 296 | 4.048140% |
| B | 7313 | 646 | 8.833584% |
| C | 7313 | 815 | 11.144537% |
| D | 7312 | 5220 | 71.389497% |
Noise dominated data is calculated using 1-second bins in cleaned event files. If a bin has >2000 counts, and if more than 50% of those come from <1% of pixels, then it is considered to be noise-dominated and hence unusable.
| Quadrant | # 1 sec bins | Bins with >0 counts | Bins with >2000 counts | High rate bins dominated by noise | Noise dominated (total time) | Noise dominated (detector-on time) | Marked lightcurve |
|---|---|---|---|---|---|---|---|
| A | 7907 | 7313 | 26 | 26 | 0.33% | 0.36% | 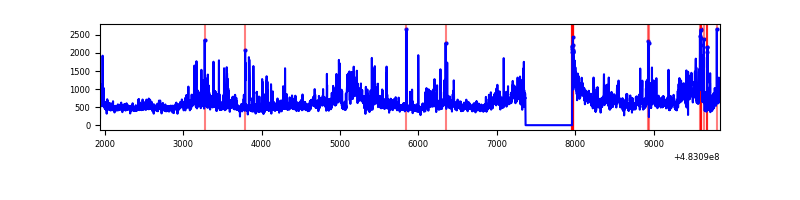 |
| B | 7908 | 7314 | 266 | 266 | 3.36% | 3.64% | 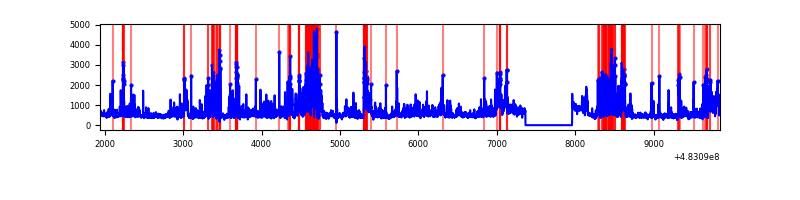 |
| C | 7908 | 7313 | 443 | 443 | 5.60% | 6.06% | 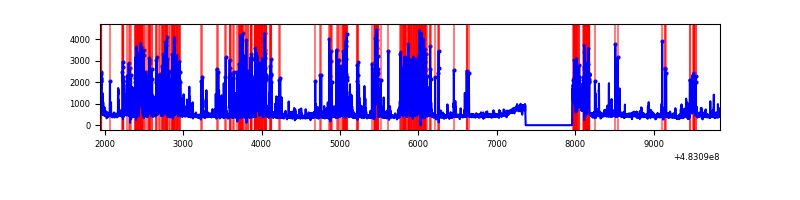 |
| D | 7907 | 7311 | 4072 | 4072 | 51.50% | 55.70% | 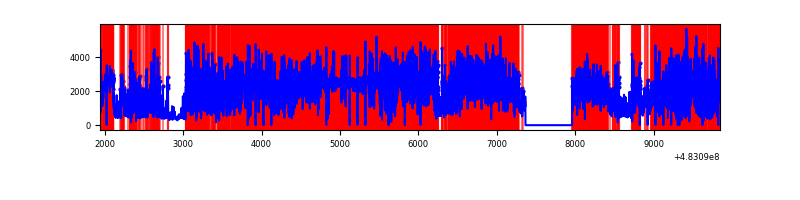 |
Top three noisy pixels from each quadrant. If the there are fewer than three noisy pixels in the level2.evt file, extra rows are filled as -1
| Pixel properties | Quadrant properties | ||||||
|---|---|---|---|---|---|---|---|
| Quadrant | DetID | PixID | Counts | Sigma | Mean | Median | Sigma |
| A | 3 | 14 | 1104841 | 5720.4 | 801 | 784 | 193.0 |
| A | 4 | 3 | 82261 | 422.15 | 801 | 784 | 193.0 |
| A | 5 | 240 | 58219 | 297.59 | 801 | 784 | 193.0 |
| B | 4 | 206 | 1124367 | 6600.77 | 787 | 757 | 170.2 |
| B | 1 | 223 | 282316 | 1654.05 | 787 | 757 | 170.2 |
| B | 7 | 252 | 126674 | 739.71 | 787 | 757 | 170.2 |
| C | 15 | 230 | 1739060 | 8496.62 | 754 | 749 | 204.6 |
| C | 13 | 3 | 109648 | 532.28 | 754 | 749 | 204.6 |
| C | 15 | 189 | 78751 | 381.26 | 754 | 749 | 204.6 |
| D | 11 | 129 | 12295115 | 100297.21 | 438 | 420 | 122.6 |
| D | 8 | 176 | 608210 | 4958.21 | 438 | 420 | 122.6 |
| D | 12 | 32 | 50374 | 407.51 | 438 | 420 | 122.6 |
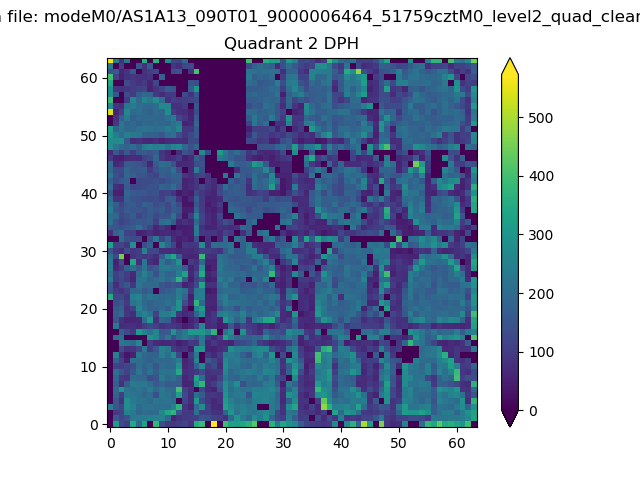
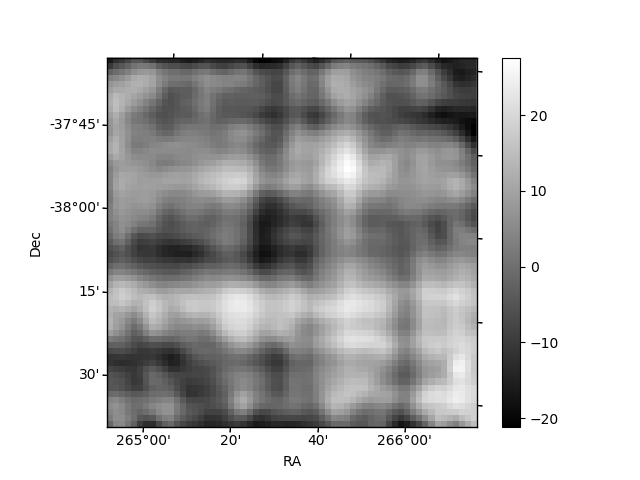
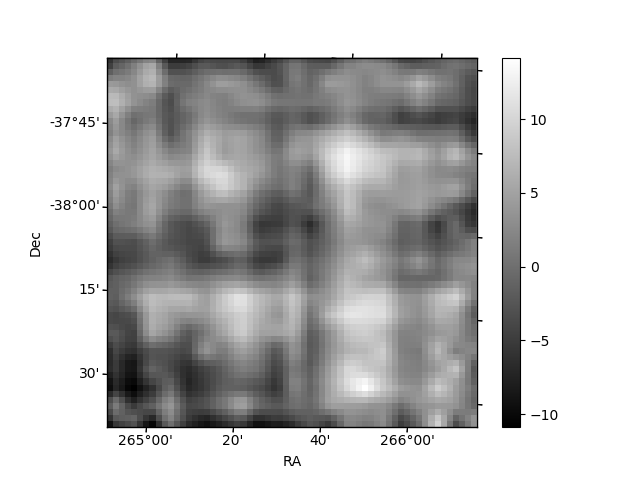
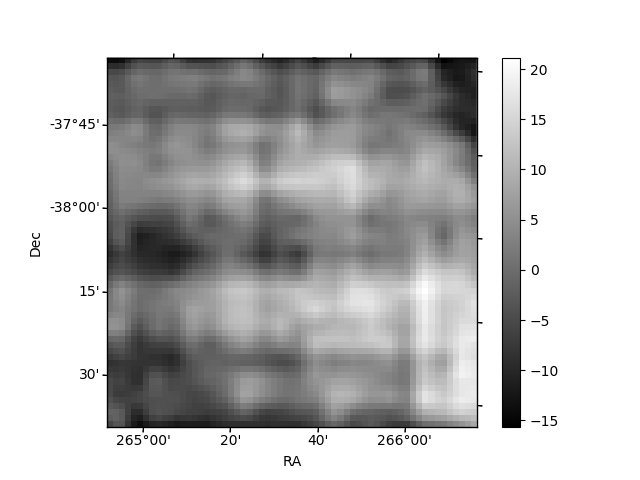
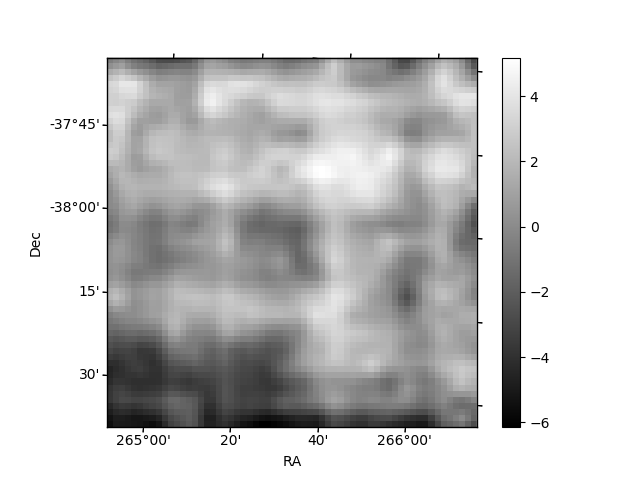
Histogram calculated using DETX and DETY for each event in the final _common_clean file
| Quadrant A | 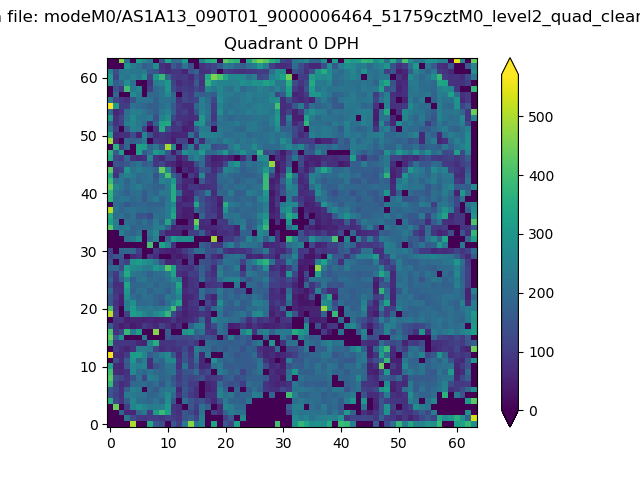 |
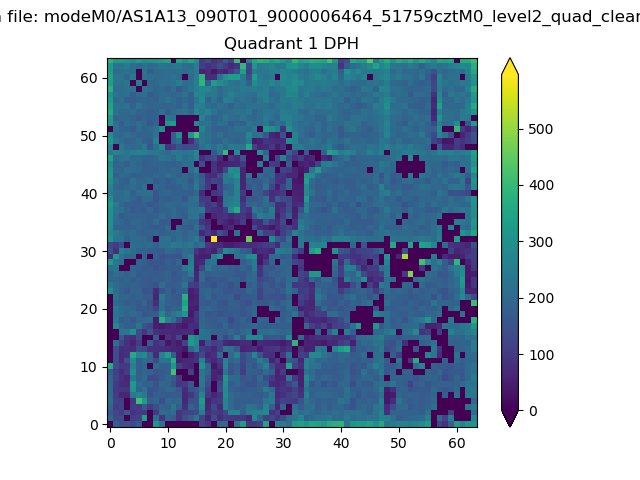 |
Quadrant B |
|---|---|---|---|
| Quadrant D | 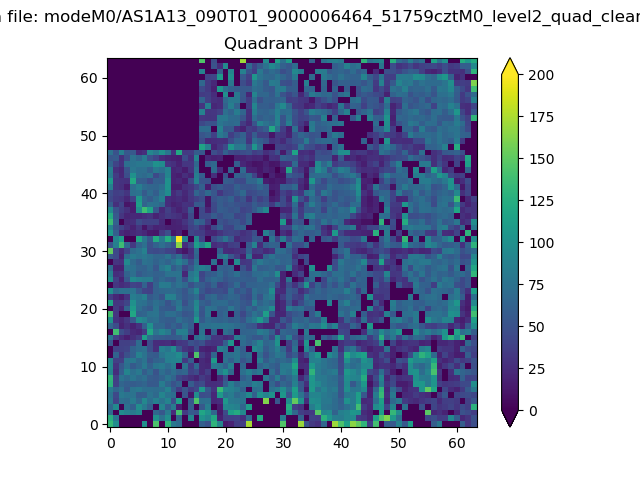 |
 |
Quadrant C |
| Plot type | Count rate plots | Images |
|---|---|---|
| Comparison with Poisson distribution Blue bars denote a histogram of data divided into 1 sec bins. Red curve is a Poisson curve with rate = median count rate of data. |
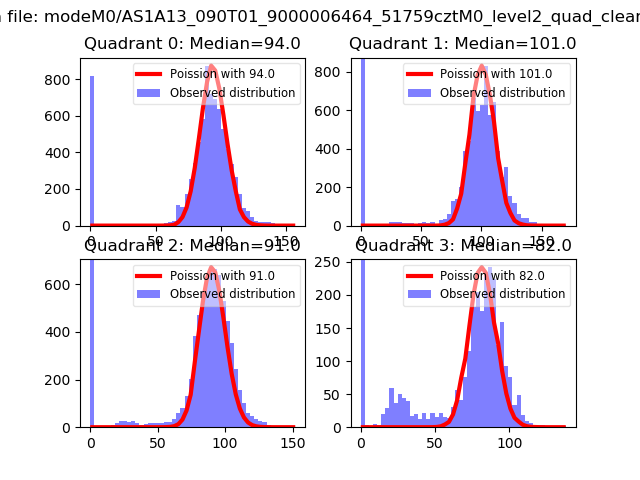 |
 |
| Quadrant-wise count rates Data is divided into 100 sec bins |
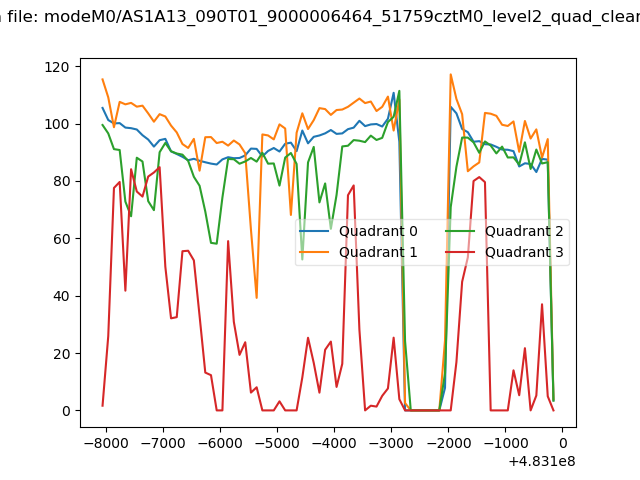 |
|
| Module-wise count rates for Quadrant A Data is divided into 100 sec bins |
 |
 |
| Module-wise count rates for Quadrant B Data is divided into 100 sec bins |
 |
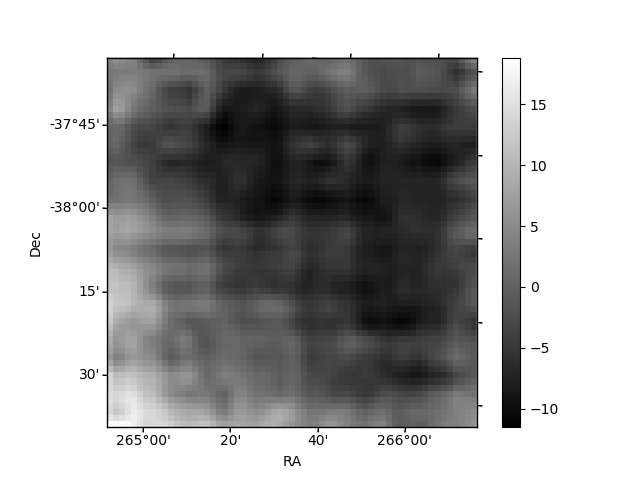 |
| Module-wise count rates for Quadrant C Data is divided into 100 sec bins |
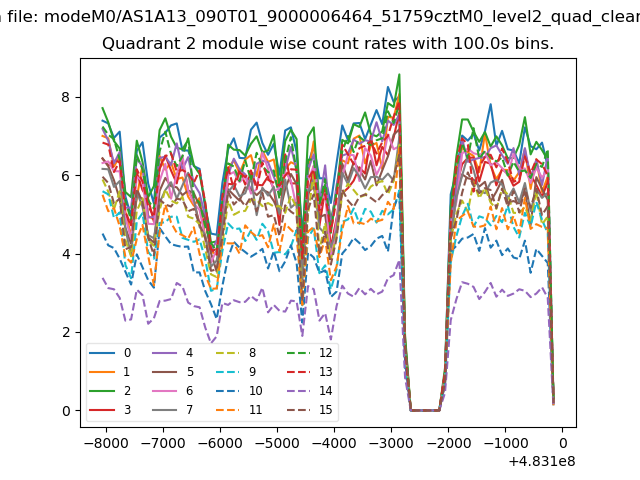 |
 |
| Module-wise count rates for Quadrant D Data is divided into 100 sec bins |
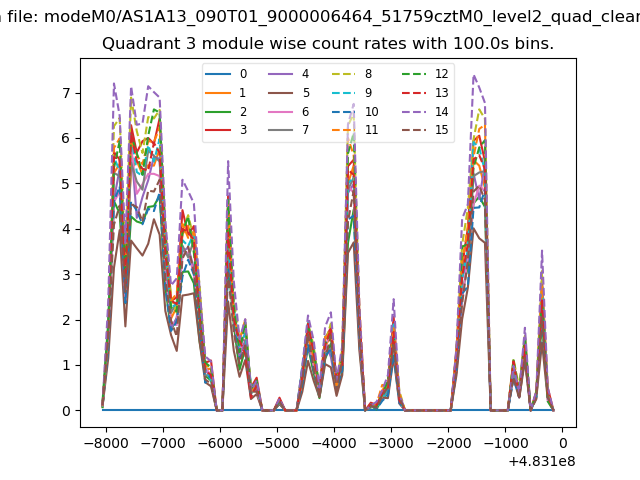 |
 |
| Parameter | Plot |
|---|---|
| CZT HV Monitor |  |
| D_VDD | 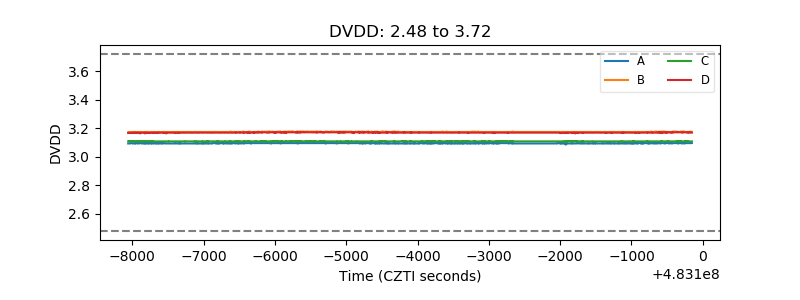 |
| Temperature 1 | 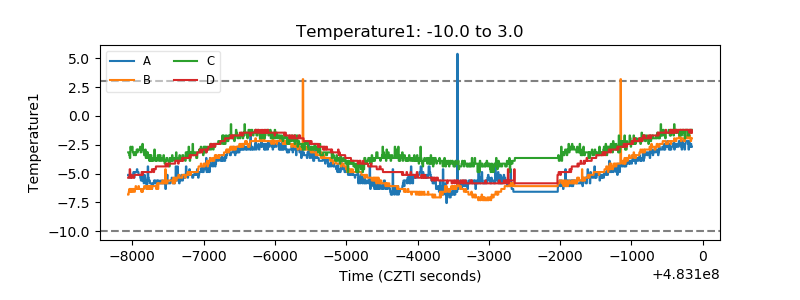 |
| Veto HV Monitor | 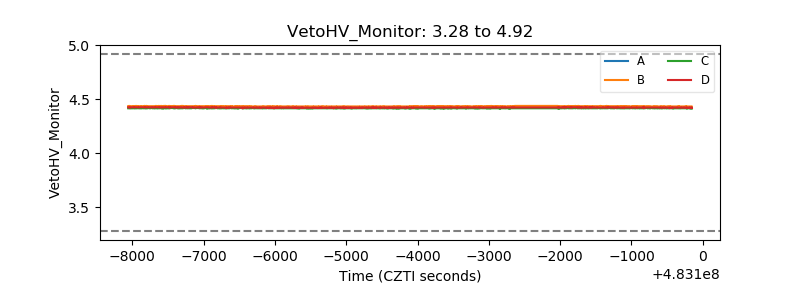 |
| Veto LLD | 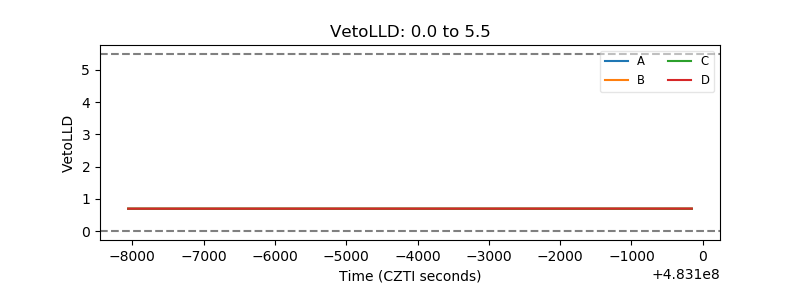 |
| Alpha Counter | 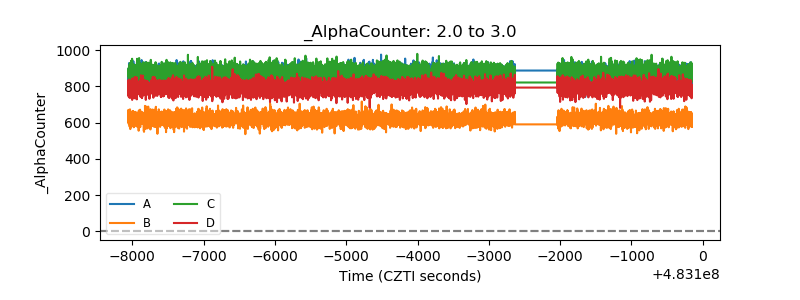 |
| _CPM_Rate |  |
| CZT Counter | 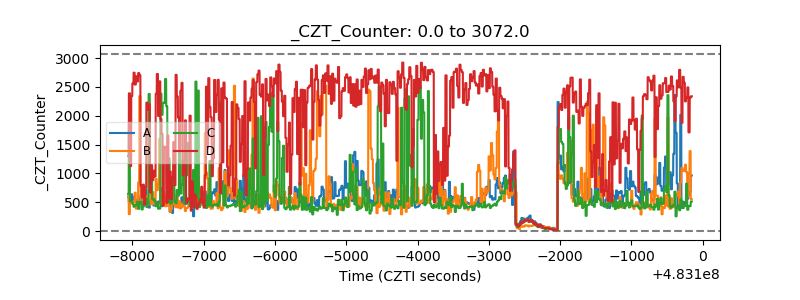 |
| +2.5 Volts monitor |  |
| +5 Volts monitor | 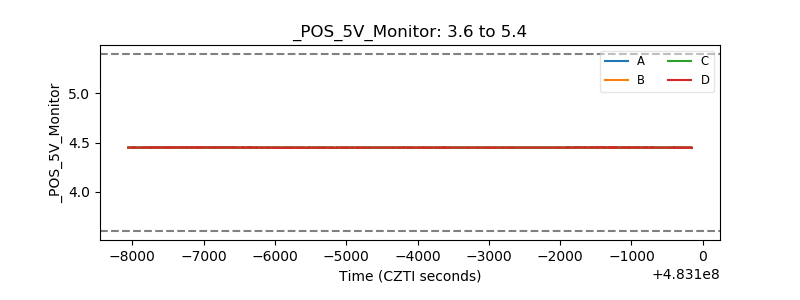 |
| _ROLL_ROT | 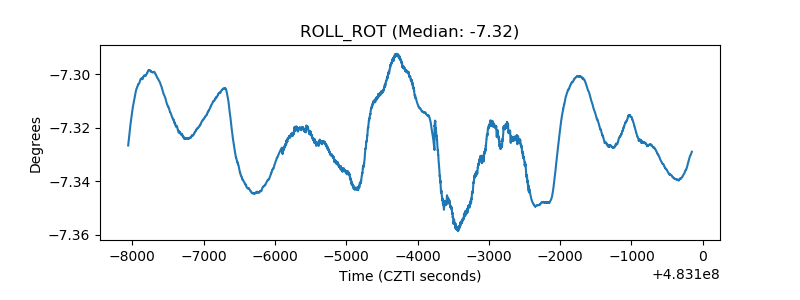 |
| _Roll_DEC | 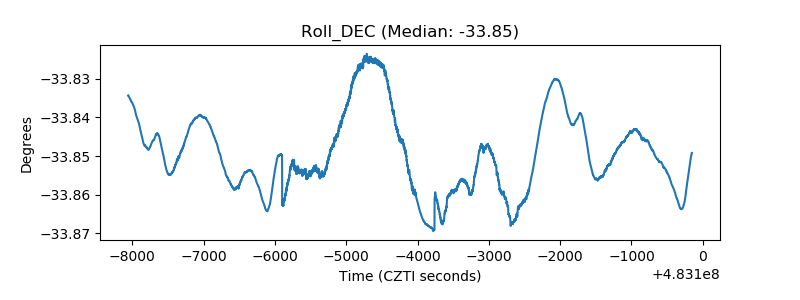 |
| _Roll_RA | 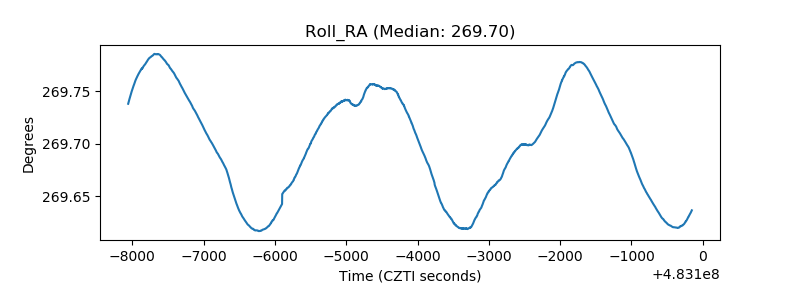 |
| Veto Counter | 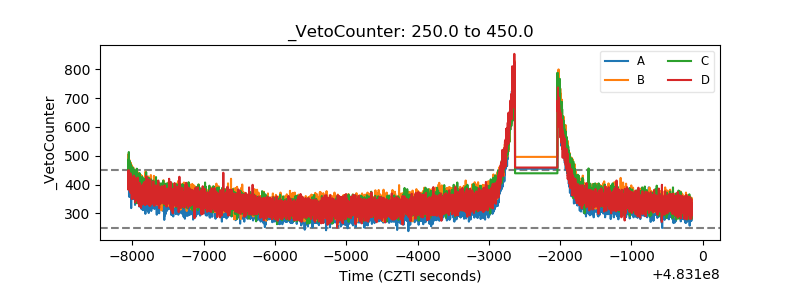 |