| Param | Original file | Final file |
|---|---|---|
| Filename | modeM0/AS1A13_090T01_9000006464_51762cztM0_level2.fits | modeM0/AS1A13_090T01_9000006464_51762cztM0_level2_quad_clean.evt |
| Size (bytes) | 837,334,080 | 99,887,040 |
| Size | 798.5 MB | 95.3 MB |
| Events in quadrant A | 5,356,970 | 736,502 |
| Events in quadrant B | 5,504,275 | 781,152 |
| Events in quadrant C | 5,031,267 | 696,786 |
| Events in quadrant D | 14,482,995 | 254,319 |
| Mode SS | |||
|---|---|---|---|
| Quadrant | BADHDUFLAG | Total packets | Discarded packets |
| A | 0 | 160 | 0 |
| B | 0 | 160 | 0 |
| C | 0 | 160 | 0 |
| D | 0 | 160 | 0 |
| Mode M0 | |||
|---|---|---|---|
| Quadrant | BADHDUFLAG | Total packets | Discarded packets |
| A | 0 | 21541 | 0 |
| B | 0 | 21916 | 0 |
| C | 0 | 20618 | 0 |
| D | 0 | 48532 | 0 |
| Quadrant | Total seconds | Saturated seconds | Saturation percentage |
|---|---|---|---|
| A | 7987 | 140 | 1.752848% |
| B | 7987 | 411 | 5.145862% |
| C | 7988 | 323 | 4.043565% |
| D | 7988 | 5270 | 65.973961% |
Noise dominated data is calculated using 1-second bins in cleaned event files. If a bin has >2000 counts, and if more than 50% of those come from <1% of pixels, then it is considered to be noise-dominated and hence unusable.
| Quadrant | # 1 sec bins | Bins with >0 counts | Bins with >2000 counts | High rate bins dominated by noise | Noise dominated (total time) | Noise dominated (detector-on time) | Marked lightcurve |
|---|---|---|---|---|---|---|---|
| A | 7987 | 7987 | 81 | 81 | 1.01% | 1.01% | 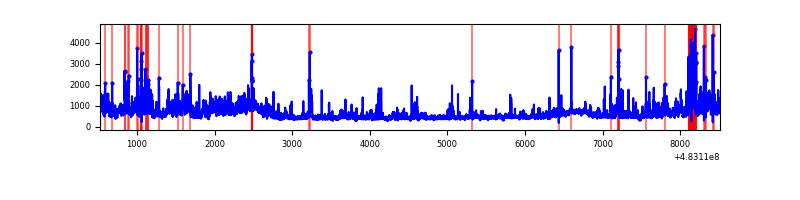 |
| B | 7987 | 7987 | 256 | 256 | 3.21% | 3.21% | 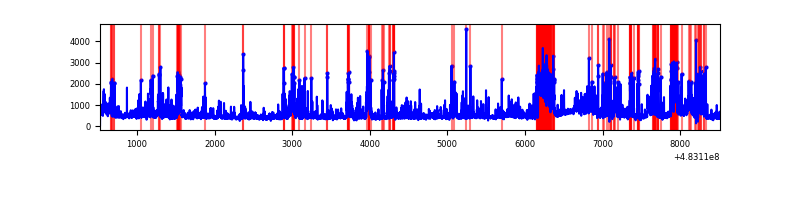 |
| C | 7988 | 7988 | 241 | 241 | 3.02% | 3.02% | 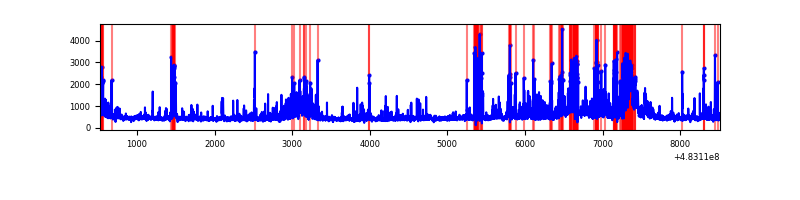 |
| D | 7987 | 7983 | 3731 | 3731 | 46.71% | 46.74% | 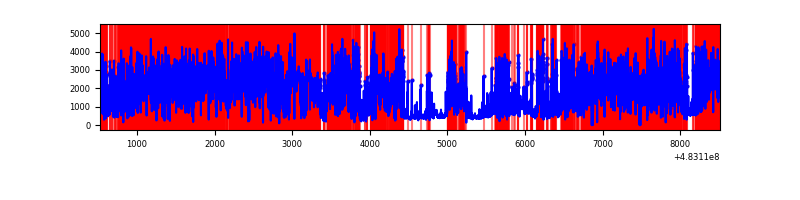 |
Top three noisy pixels from each quadrant. If the there are fewer than three noisy pixels in the level2.evt file, extra rows are filled as -1
| Pixel properties | Quadrant properties | ||||||
|---|---|---|---|---|---|---|---|
| Quadrant | DetID | PixID | Counts | Sigma | Mean | Median | Sigma |
| A | 12 | 3 | 940418 | 4407.38 | 864 | 842 | 213.2 |
| A | 11 | 3 | 286204 | 1338.58 | 864 | 842 | 213.2 |
| A | 12 | 194 | 116377 | 541.95 | 864 | 842 | 213.2 |
| B | 4 | 206 | 1162743 | 6212.98 | 855 | 824 | 187.0 |
| B | 10 | 247 | 197163 | 1049.86 | 855 | 824 | 187.0 |
| B | 0 | 216 | 105601 | 560.26 | 855 | 824 | 187.0 |
| C | 0 | 209 | 497609 | 2155.95 | 831 | 825 | 230.4 |
| C | 15 | 218 | 481945 | 2087.97 | 831 | 825 | 230.4 |
| C | 15 | 192 | 102573 | 441.57 | 831 | 825 | 230.4 |
| D | 11 | 129 | 8536196 | 66496.85 | 460 | 443 | 128.4 |
| D | 8 | 176 | 3312889 | 25805.25 | 460 | 443 | 128.4 |
| D | 3 | 12 | 114421 | 887.93 | 460 | 443 | 128.4 |
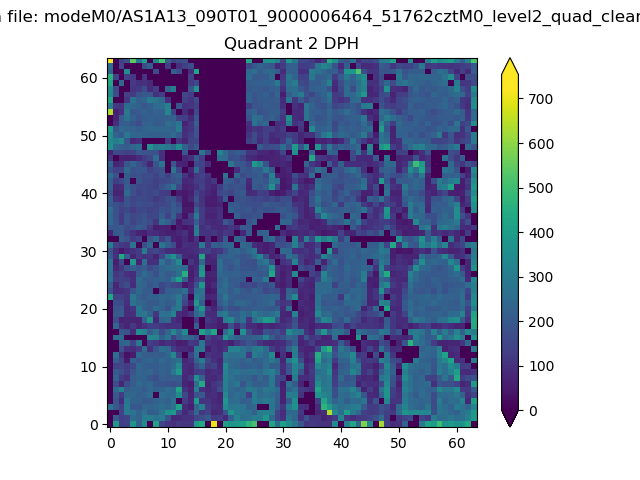
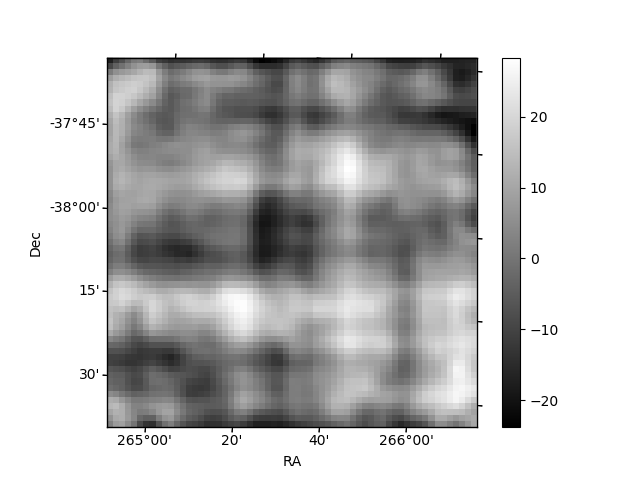
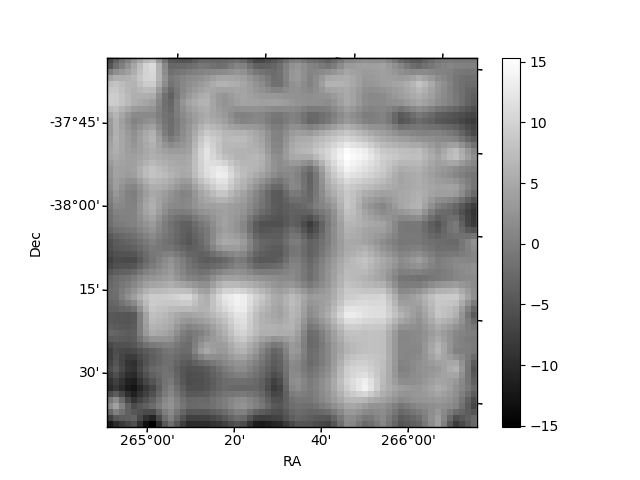
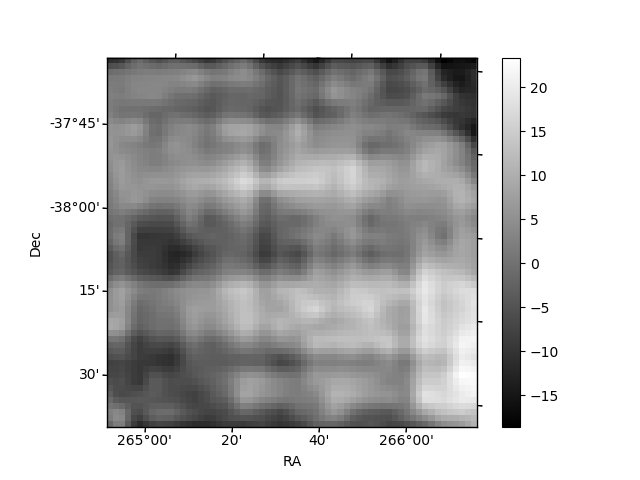
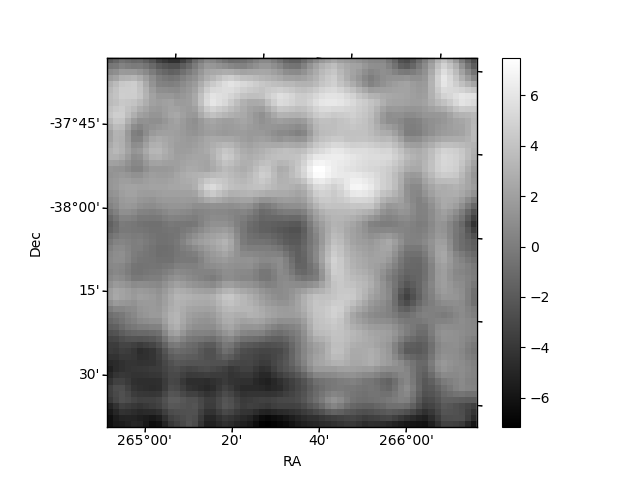
Histogram calculated using DETX and DETY for each event in the final _common_clean file
| Quadrant A | 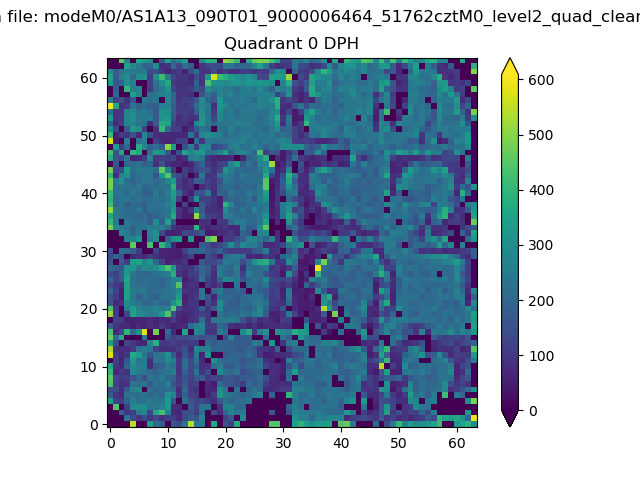 |
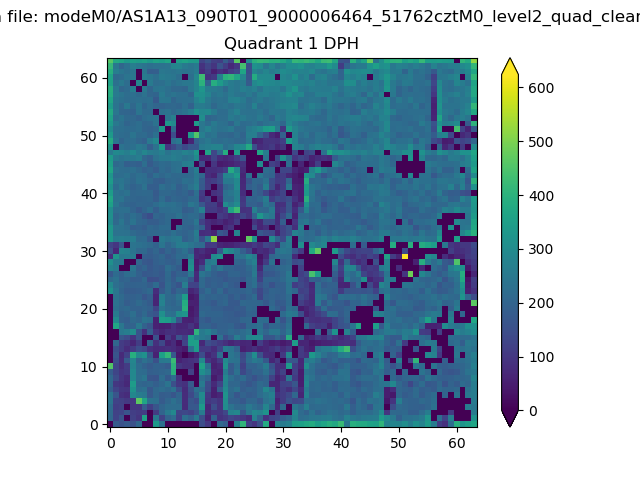 |
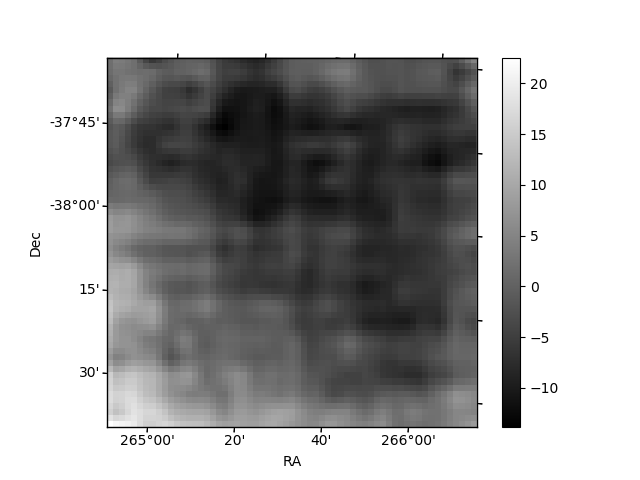
Quadrant B |
|---|---|---|---|
| Quadrant D | 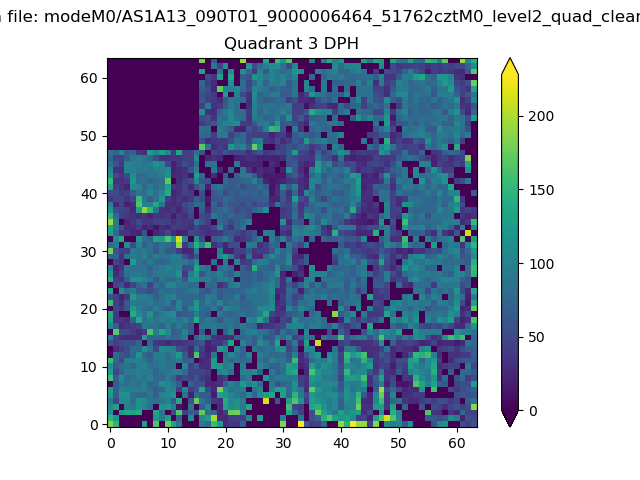 |
 |
Quadrant C |
| Plot type | Count rate plots | Images |
|---|---|---|
| Comparison with Poisson distribution Blue bars denote a histogram of data divided into 1 sec bins. Red curve is a Poisson curve with rate = median count rate of data. |
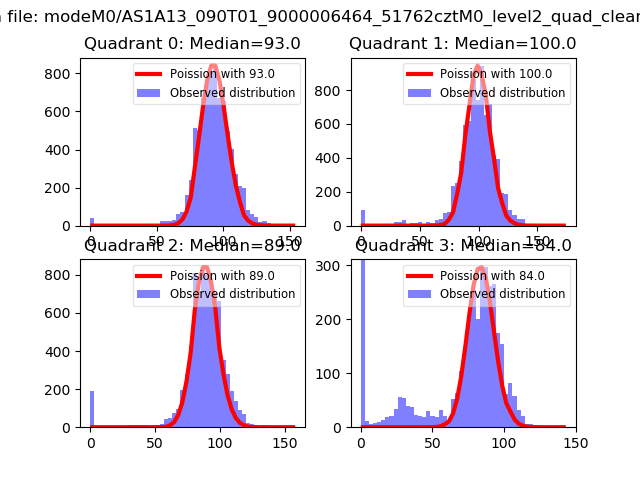 |
 |
| Quadrant-wise count rates Data is divided into 100 sec bins |
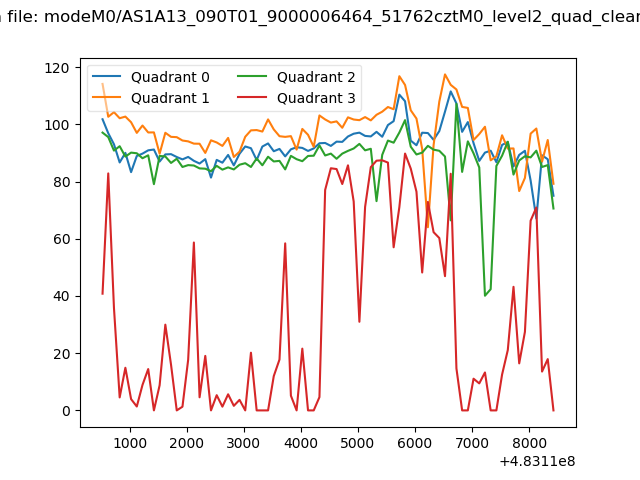 |
|
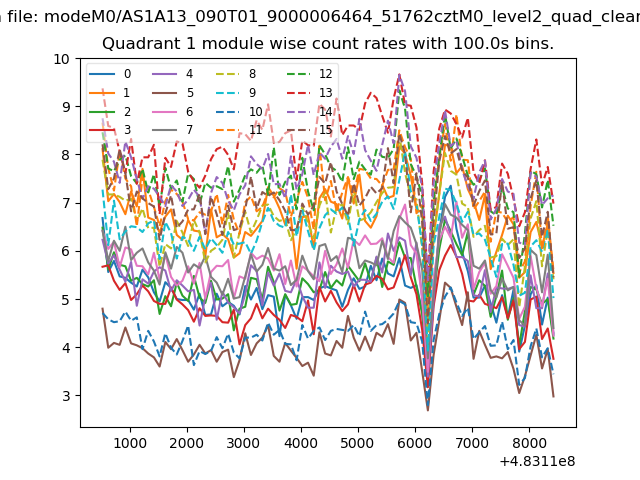
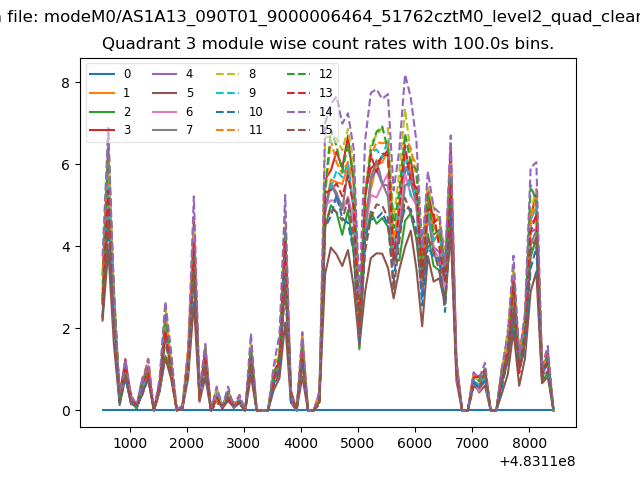
| Module-wise count rates for Quadrant A Data is divided into 100 sec bins |
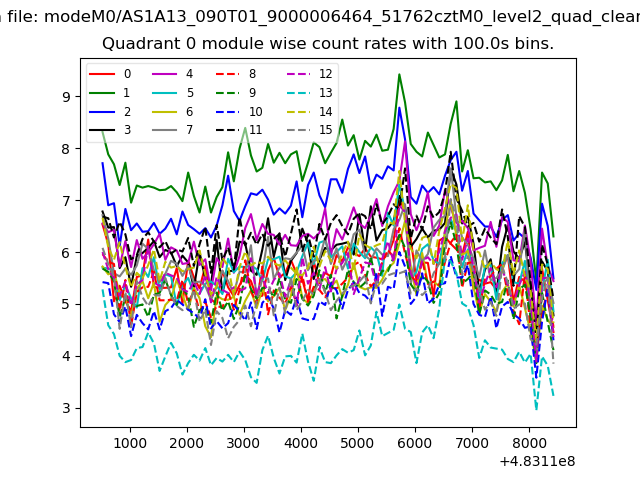 |
 |
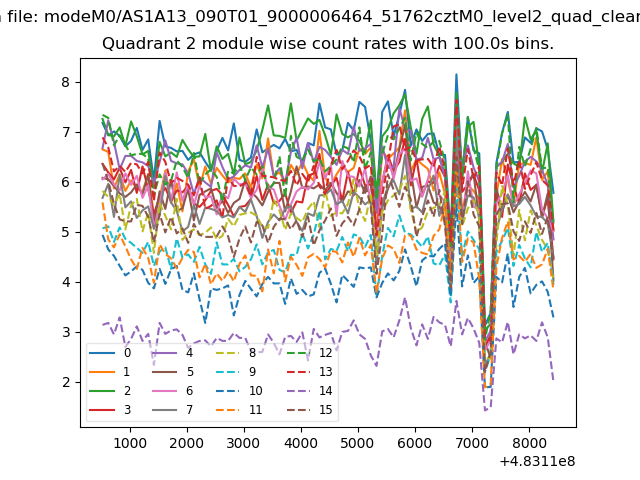
| Module-wise count rates for Quadrant B Data is divided into 100 sec bins |
 |
 |
| Module-wise count rates for Quadrant C Data is divided into 100 sec bins |
 |
 |
| Module-wise count rates for Quadrant D Data is divided into 100 sec bins |
 |
 |
| Parameter | Plot |
|---|---|
| CZT HV Monitor | 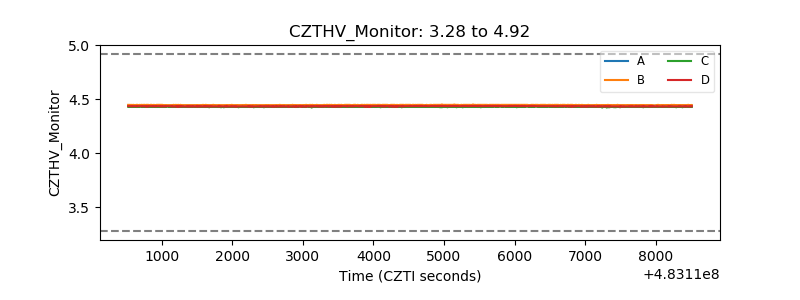 |
| D_VDD | 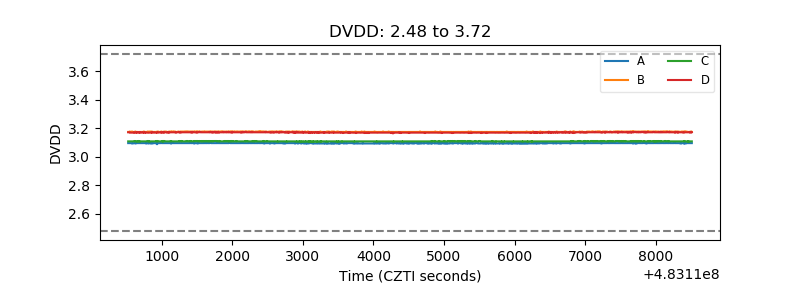 |
| Temperature 1 | 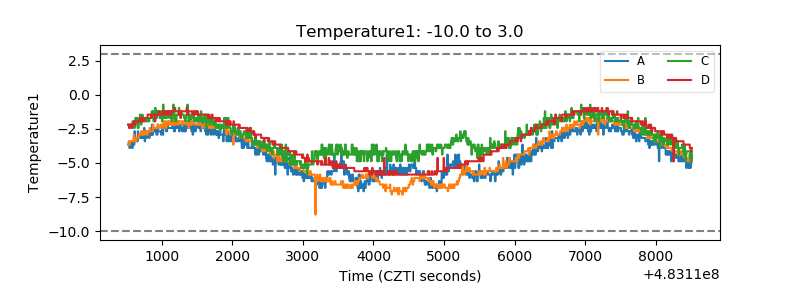 |
| Veto HV Monitor |  |
| Veto LLD | 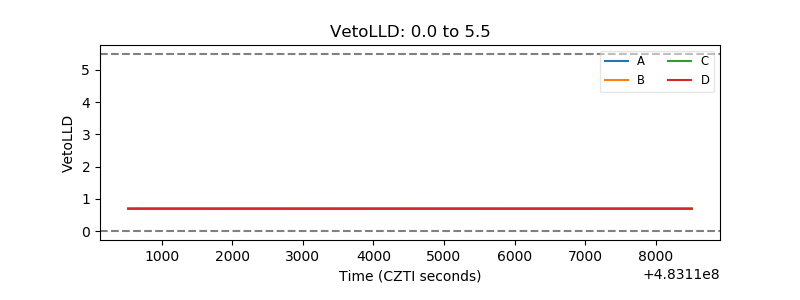 |
| Alpha Counter | 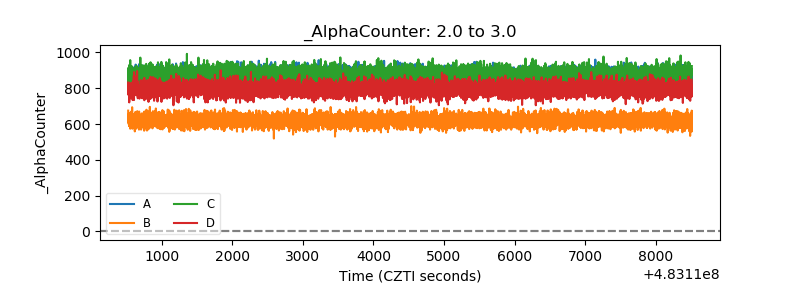 |
| _CPM_Rate | 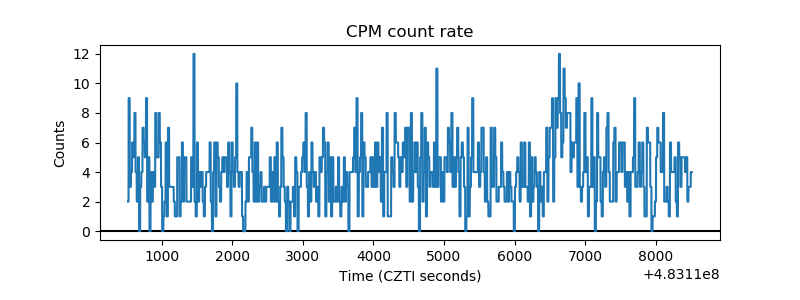 |
| CZT Counter | 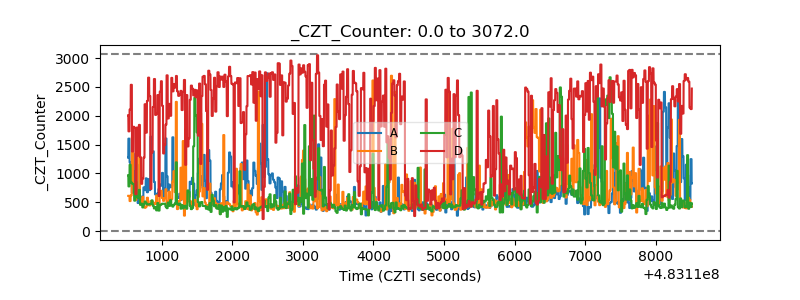 |
| +2.5 Volts monitor | 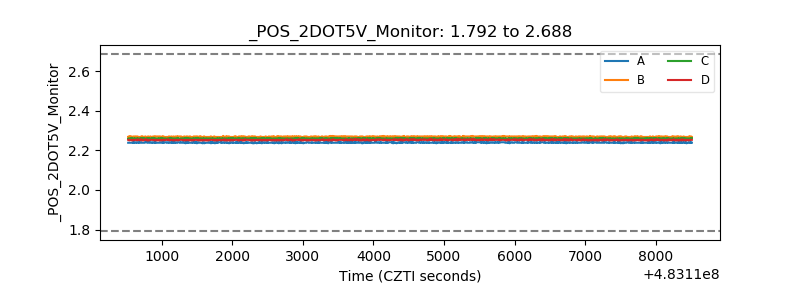 |
| +5 Volts monitor | 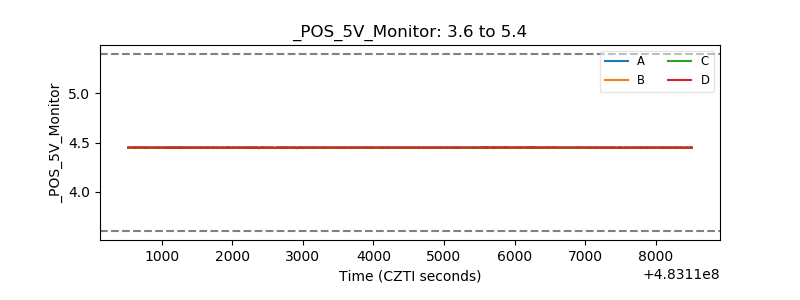 |
| _ROLL_ROT | 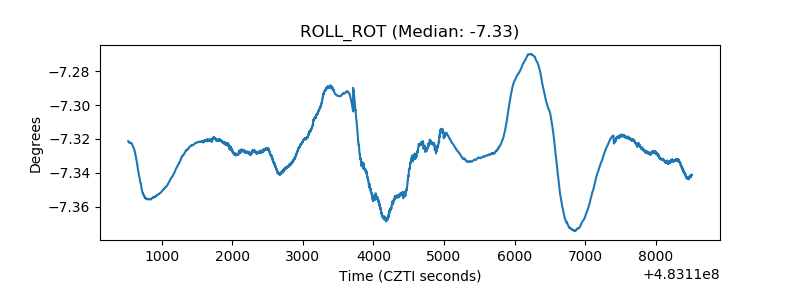 |
| _Roll_DEC | 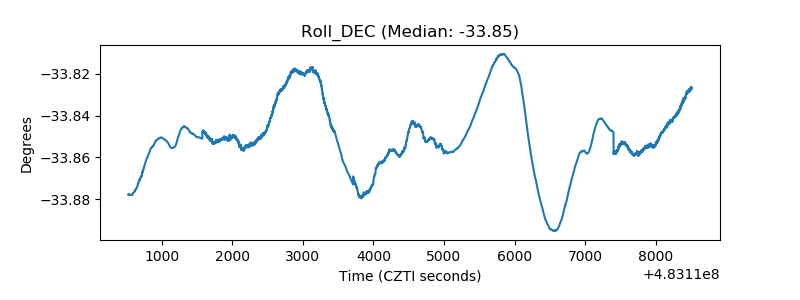 |
| _Roll_RA | 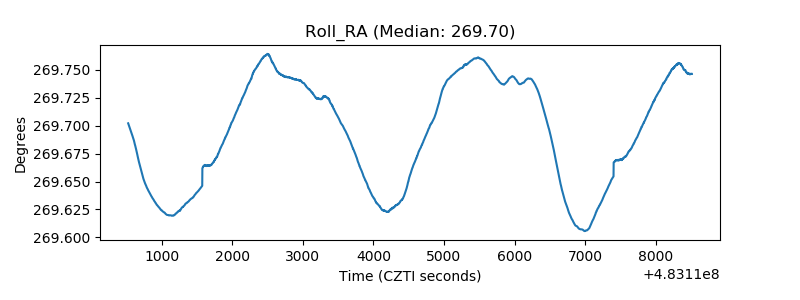 |
| Veto Counter | 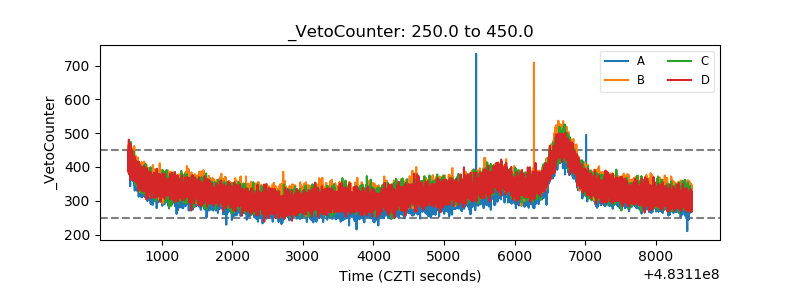 |