| Param | Original file | Final file |
|---|---|---|
| Filename | modeM0/AS1C09_011T05_9000006466_51834cztM0_level2.fits | modeM0/AS1C09_011T05_9000006466_51834cztM0_level2_quad_clean.evt |
| Size (bytes) | 882,642,240 | 95,135,040 |
| Size | 841.8 MB | 90.7 MB |
| Events in quadrant A | 9,706,970 | 520,788 |
| Events in quadrant B | 6,109,370 | 730,344 |
| Events in quadrant C | 7,540,494 | 594,449 |
| Events in quadrant D | 8,732,277 | 508,999 |
| Mode SS | |||
|---|---|---|---|
| Quadrant | BADHDUFLAG | Total packets | Discarded packets |
| A | 0 | 150 | 0 |
| B | 0 | 150 | 0 |
| C | 0 | 150 | 0 |
| D | 0 | 150 | 0 |
| Mode M0 | |||
|---|---|---|---|
| Quadrant | BADHDUFLAG | Total packets | Discarded packets |
| A | 0 | 34015 | 0 |
| B | 0 | 23367 | 0 |
| C | 0 | 27621 | 0 |
| D | 0 | 31218 | 6 |
| Quadrant | Total seconds | Saturated seconds | Saturation percentage |
|---|---|---|---|
| A | 7555 | 2017 | 26.697551% |
| B | 7556 | 440 | 5.823187% |
| C | 7556 | 1003 | 13.274219% |
| D | 7555 | 1517 | 20.079418% |
Noise dominated data is calculated using 1-second bins in cleaned event files. If a bin has >2000 counts, and if more than 50% of those come from <1% of pixels, then it is considered to be noise-dominated and hence unusable.
| Quadrant | # 1 sec bins | Bins with >0 counts | Bins with >2000 counts | High rate bins dominated by noise | Noise dominated (total time) | Noise dominated (detector-on time) | Marked lightcurve |
|---|---|---|---|---|---|---|---|
| A | 7555 | 7555 | 1663 | 1663 | 22.01% | 22.01% | 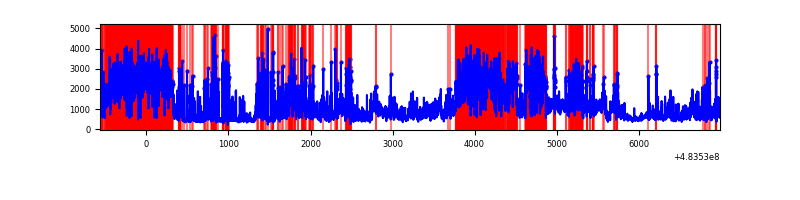 |
| B | 7556 | 7556 | 269 | 269 | 3.56% | 3.56% | 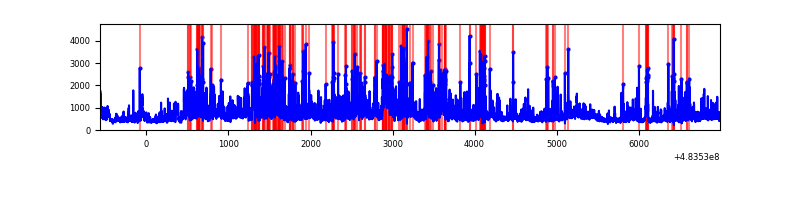 |
| C | 7556 | 7556 | 868 | 868 | 11.49% | 11.49% |  |
| D | 7555 | 7555 | 1304 | 1304 | 17.26% | 17.26% | 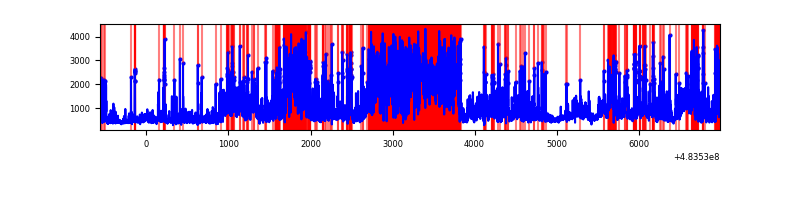 |
Top three noisy pixels from each quadrant. If the there are fewer than three noisy pixels in the level2.evt file, extra rows are filled as -1
| Pixel properties | Quadrant properties | ||||||
|---|---|---|---|---|---|---|---|
| Quadrant | DetID | PixID | Counts | Sigma | Mean | Median | Sigma |
| A | 13 | 248 | 3452685 | 20191.15 | 684 | 666 | 171.0 |
| A | 12 | 3 | 1105469 | 6462.08 | 684 | 666 | 171.0 |
| A | 11 | 3 | 800500 | 4678.3 | 684 | 666 | 171.0 |
| B | 5 | 32 | 611411 | 3763.23 | 763 | 737 | 162.3 |
| B | 5 | 185 | 547228 | 3367.7 | 763 | 737 | 162.3 |
| B | 1 | 223 | 408280 | 2511.45 | 763 | 737 | 162.3 |
| C | 0 | 193 | 1342691 | 6858.22 | 714 | 706 | 195.7 |
| C | 15 | 192 | 611572 | 3121.83 | 714 | 706 | 195.7 |
| C | 12 | 254 | 391076 | 1994.98 | 714 | 706 | 195.7 |
| D | 11 | 129 | 2898736 | 15418.99 | 674 | 650 | 188.0 |
| D | 12 | 6 | 932356 | 4957.05 | 674 | 650 | 188.0 |
| D | 0 | 18 | 666438 | 3542.26 | 674 | 650 | 188.0 |
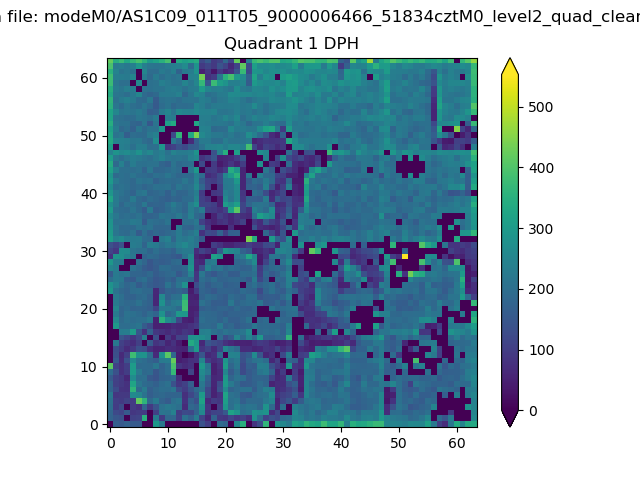
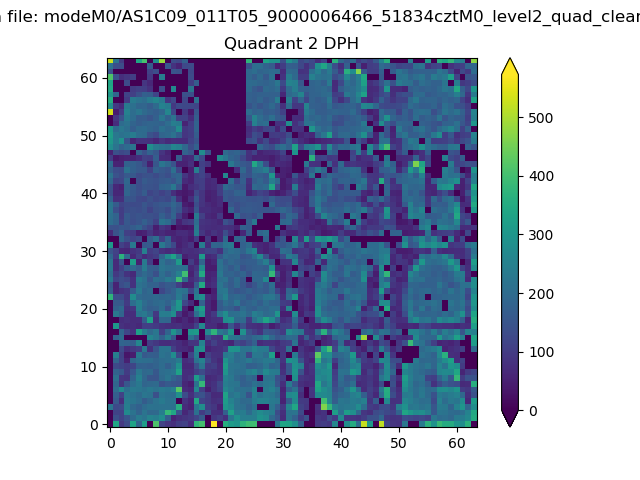
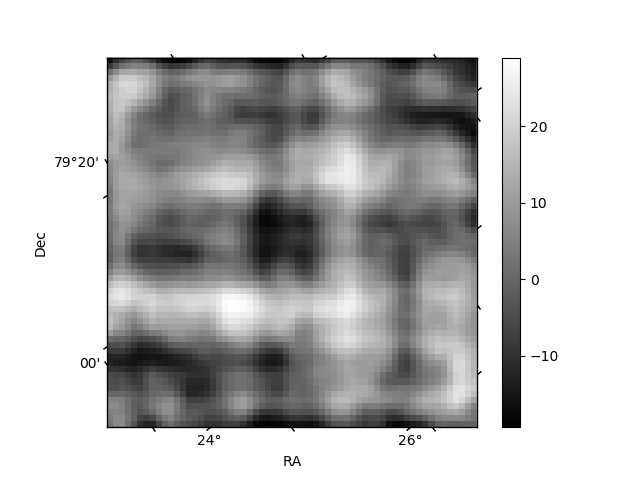
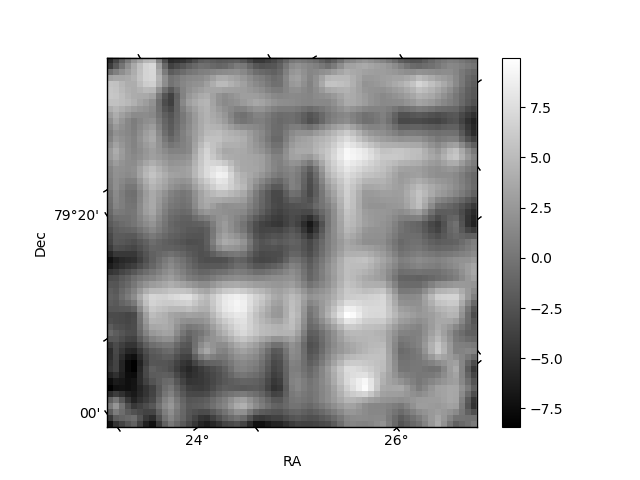
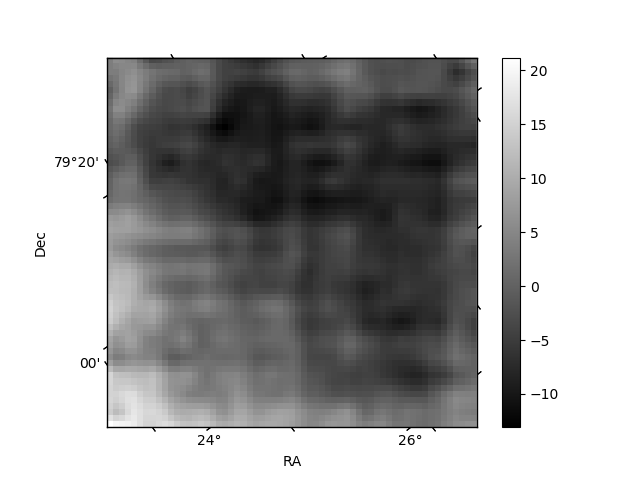
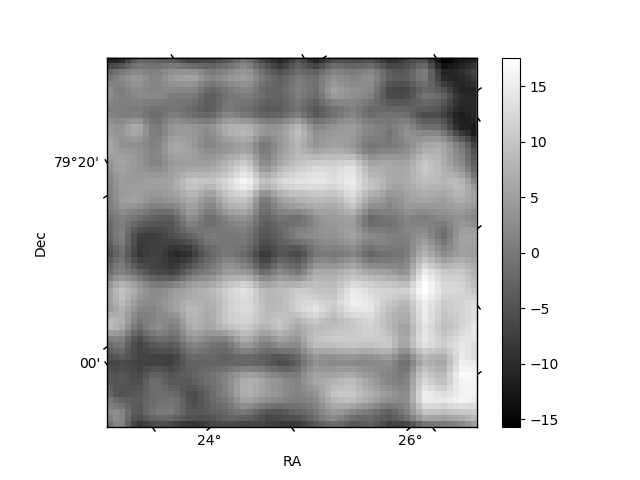
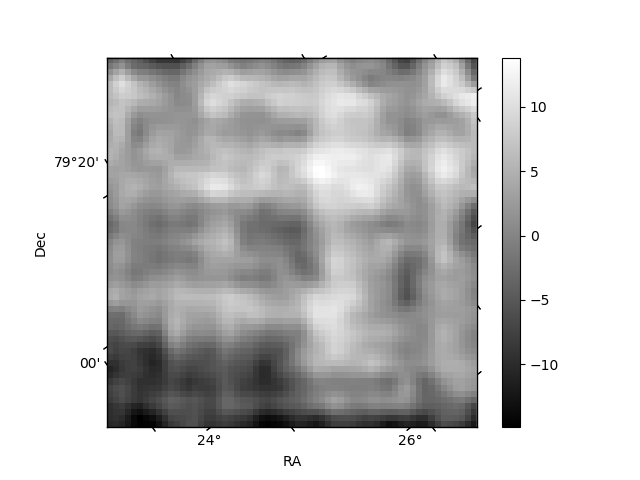
Histogram calculated using DETX and DETY for each event in the final _common_clean file
| Quadrant A | 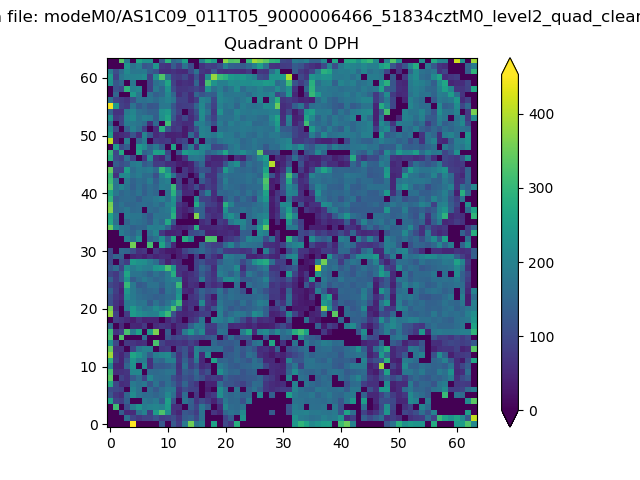 |
 |
Quadrant B |
|---|---|---|---|
| Quadrant D | 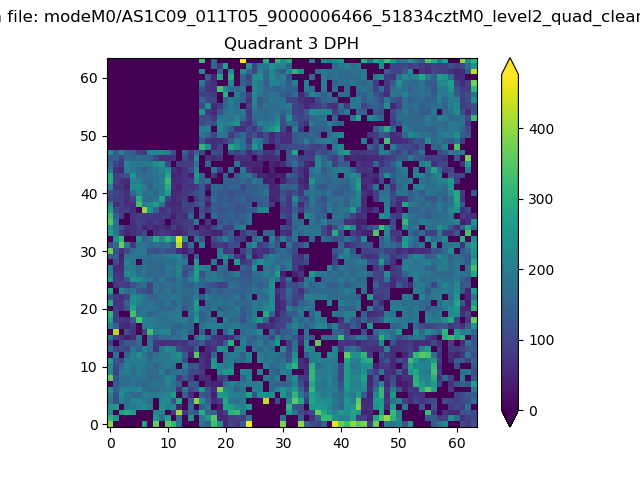 |
 |
Quadrant C |
| Plot type | Count rate plots | Images |
|---|---|---|
| Comparison with Poisson distribution Blue bars denote a histogram of data divided into 1 sec bins. Red curve is a Poisson curve with rate = median count rate of data. |
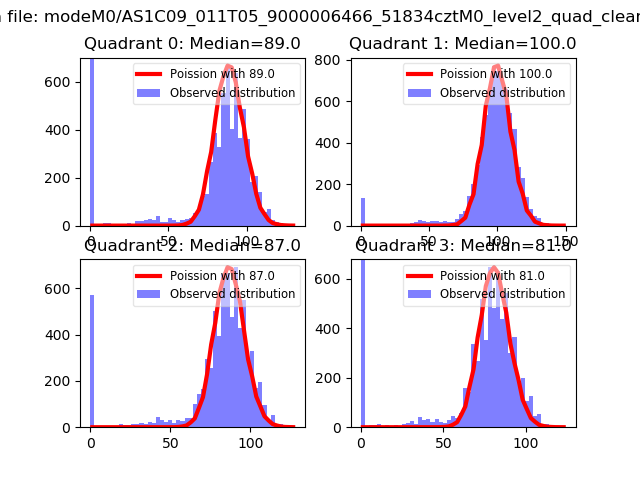 |
 |
| Quadrant-wise count rates Data is divided into 100 sec bins |
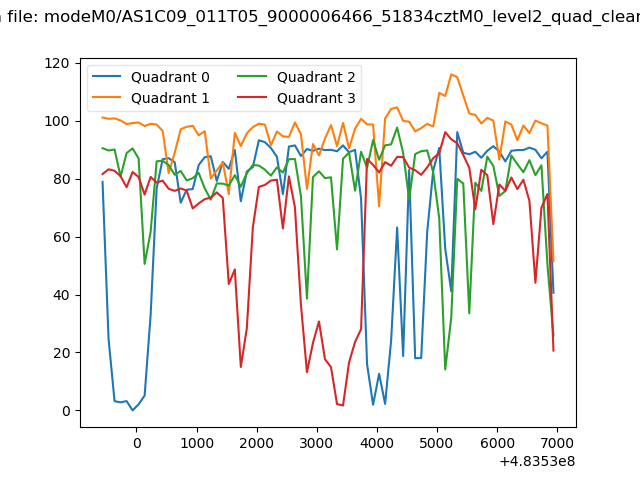 |
|
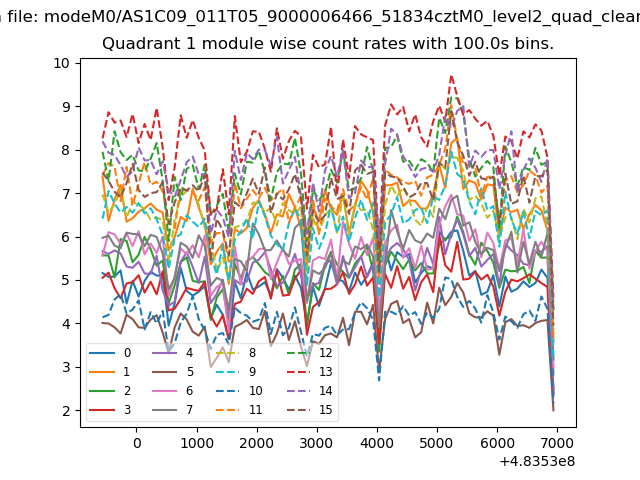
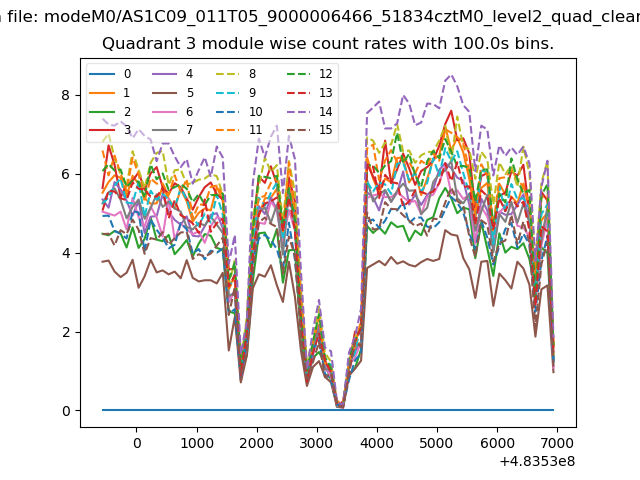
| Module-wise count rates for Quadrant A Data is divided into 100 sec bins |
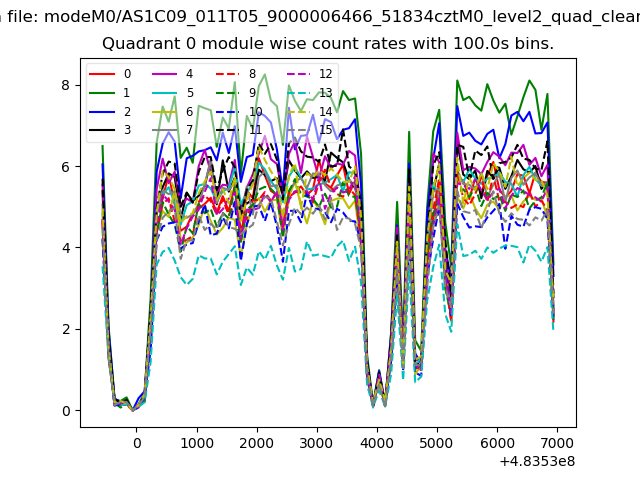 |
 |
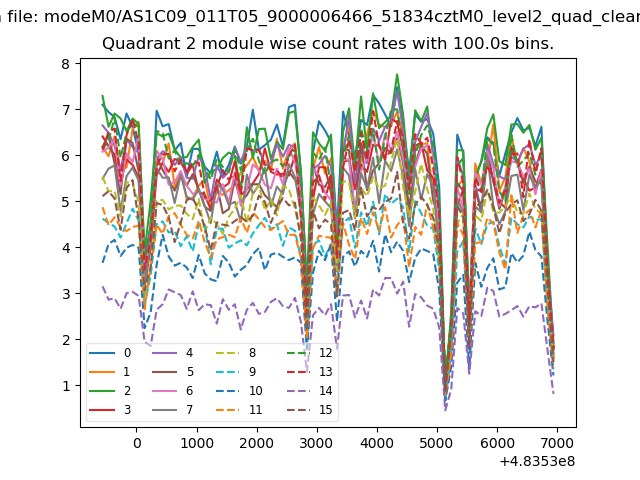
| Module-wise count rates for Quadrant B Data is divided into 100 sec bins |
 |
 |
| Module-wise count rates for Quadrant C Data is divided into 100 sec bins |
 |
 |
| Module-wise count rates for Quadrant D Data is divided into 100 sec bins |
 |
 |
| Parameter | Plot |
|---|---|
| CZT HV Monitor | 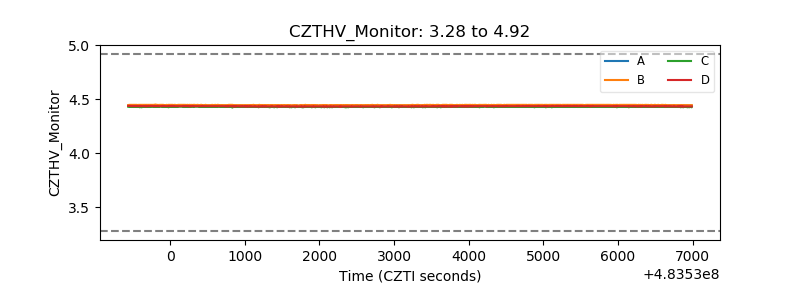 |
| D_VDD | 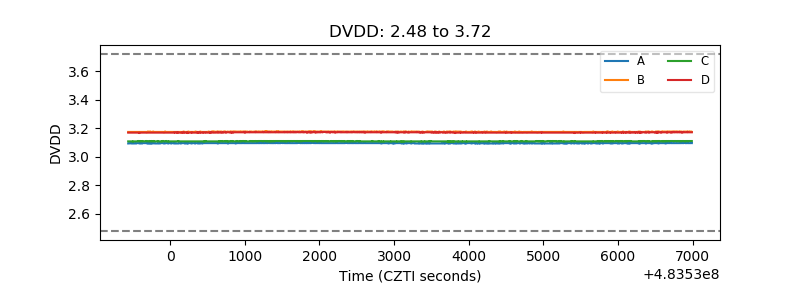 |
| Temperature 1 | 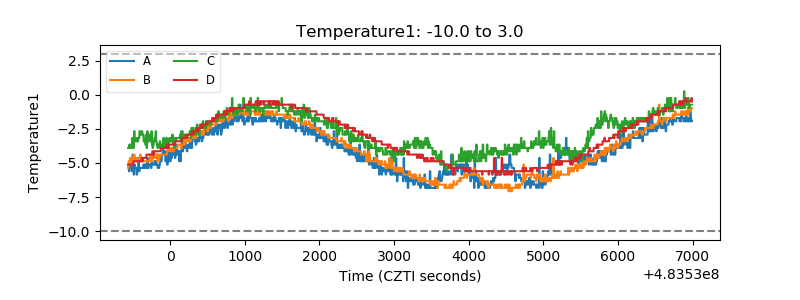 |
| Veto HV Monitor | 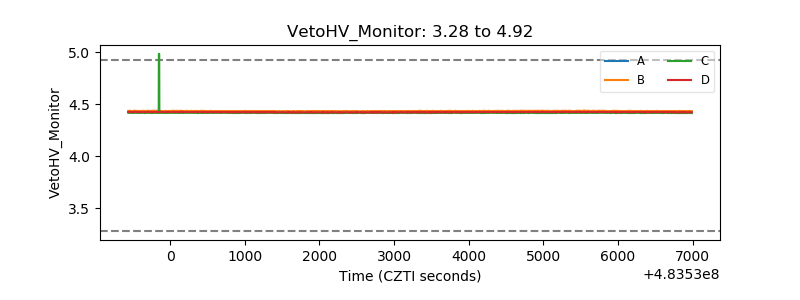 |
| Veto LLD | 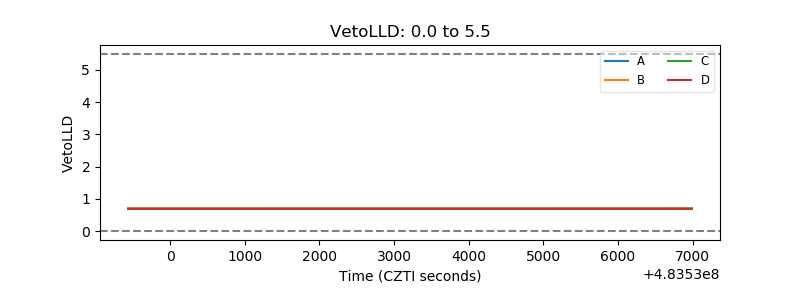 |
| Alpha Counter | 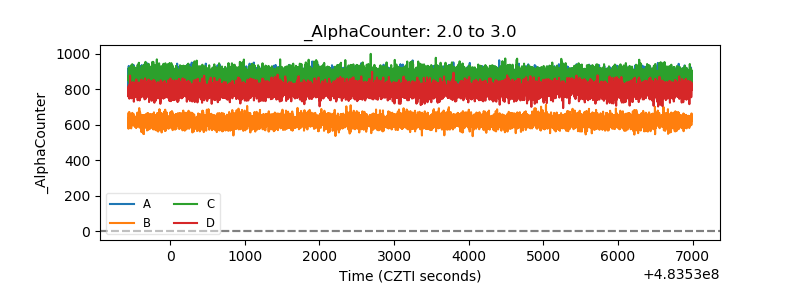 |
| _CPM_Rate | 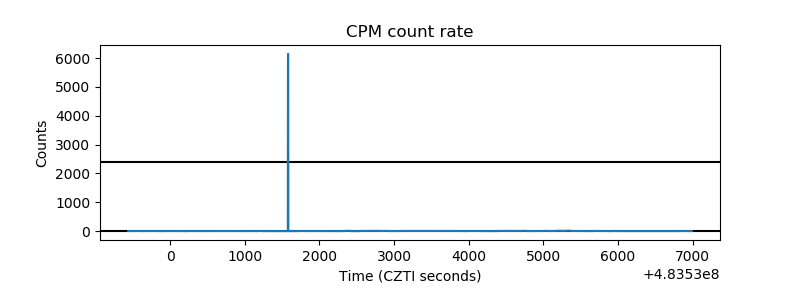 |
| CZT Counter | 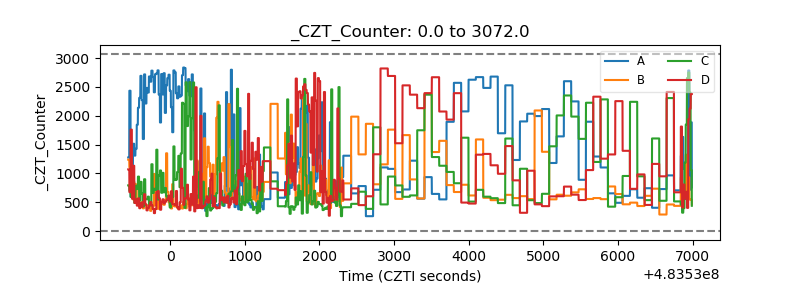 |
| +2.5 Volts monitor | 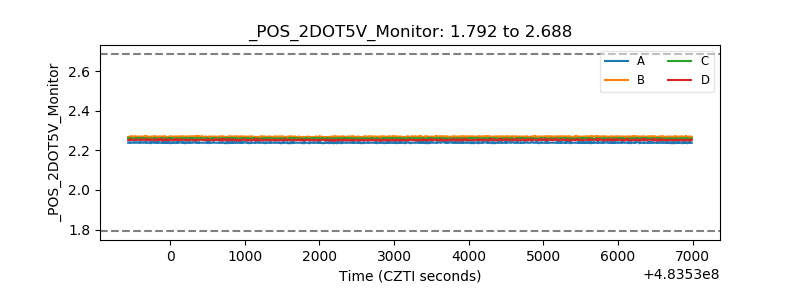 |
| +5 Volts monitor | 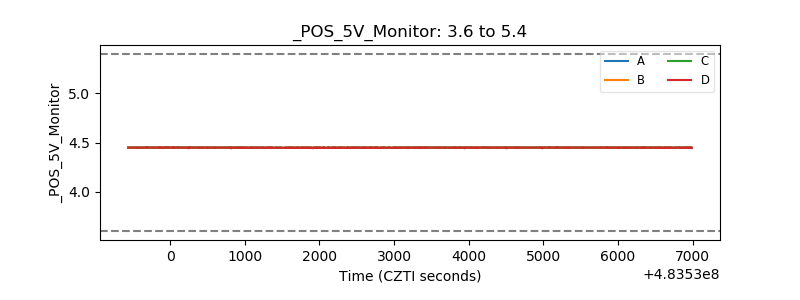 |
| _ROLL_ROT | 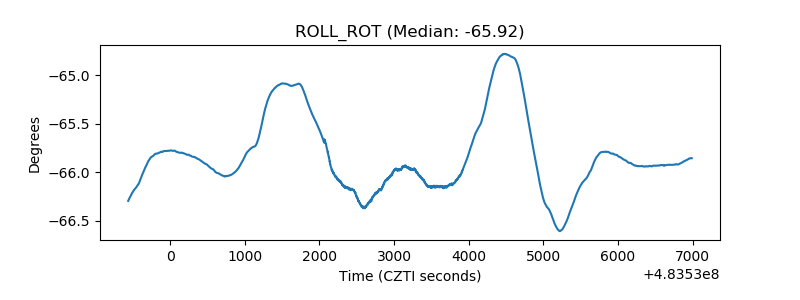 |
| _Roll_DEC | 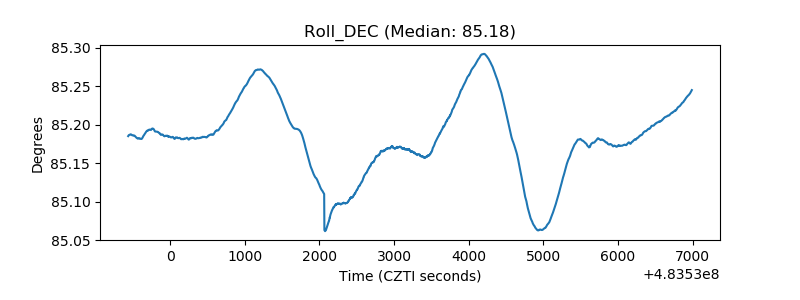 |
| _Roll_RA | 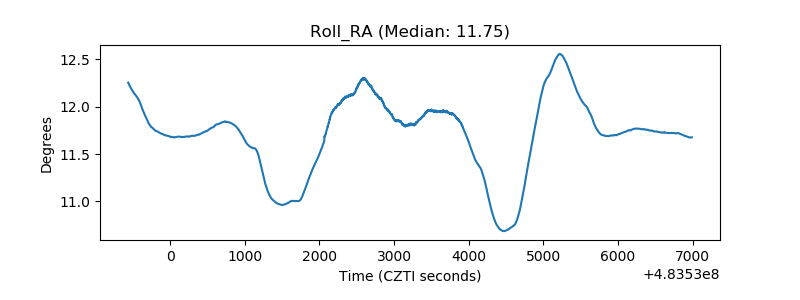 |
| Veto Counter | 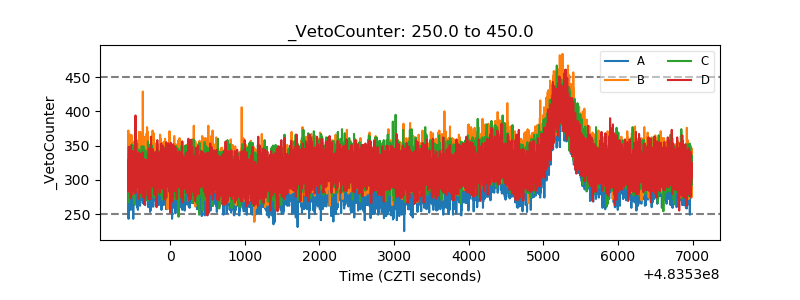 |