| Param | Original file | Final file |
|---|---|---|
| Filename | modeM0/AS1C09_011T05_9000006466_51849cztM0_level2.fits | modeM0/AS1C09_011T05_9000006466_51849cztM0_level2_quad_clean.evt |
| Size (bytes) | 845,184,960 | 92,568,960 |
| Size | 806.0 MB | 88.3 MB |
| Events in quadrant A | 4,885,311 | 667,437 |
| Events in quadrant B | 6,483,306 | 700,452 |
| Events in quadrant C | 4,935,015 | 644,055 |
| Events in quadrant D | 14,407,699 | 273,732 |
| Mode SS | |||
|---|---|---|---|
| Quadrant | BADHDUFLAG | Total packets | Discarded packets |
| A | 0 | 148 | 0 |
| B | 0 | 148 | 0 |
| C | 0 | 148 | 0 |
| D | 0 | 148 | 0 |
| Mode M0 | |||
|---|---|---|---|
| Quadrant | BADHDUFLAG | Total packets | Discarded packets |
| A | 0 | 19532 | 0 |
| B | 0 | 24389 | 0 |
| C | 0 | 19838 | 1 |
| D | 0 | 47879 | 0 |
| Quadrant | Total seconds | Saturated seconds | Saturation percentage |
|---|---|---|---|
| A | 7427 | 230 | 3.096809% |
| B | 7428 | 612 | 8.239095% |
| C | 7427 | 225 | 3.029487% |
| D | 7427 | 4449 | 59.903056% |
Noise dominated data is calculated using 1-second bins in cleaned event files. If a bin has >2000 counts, and if more than 50% of those come from <1% of pixels, then it is considered to be noise-dominated and hence unusable.
| Quadrant | # 1 sec bins | Bins with >0 counts | Bins with >2000 counts | High rate bins dominated by noise | Noise dominated (total time) | Noise dominated (detector-on time) | Marked lightcurve |
|---|---|---|---|---|---|---|---|
| A | 7427 | 7427 | 195 | 195 | 2.63% | 2.63% |  |
| B | 7428 | 7428 | 477 | 477 | 6.42% | 6.42% |  |
| C | 7427 | 7427 | 213 | 213 | 2.87% | 2.87% | 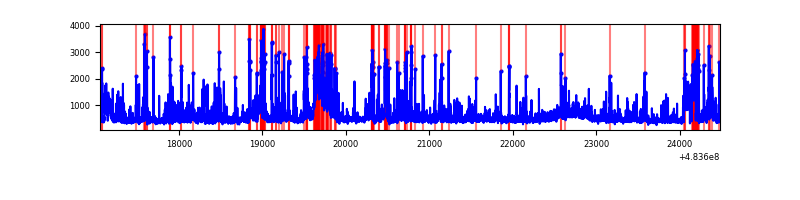 |
| D | 7427 | 7427 | 4194 | 4194 | 56.47% | 56.47% | 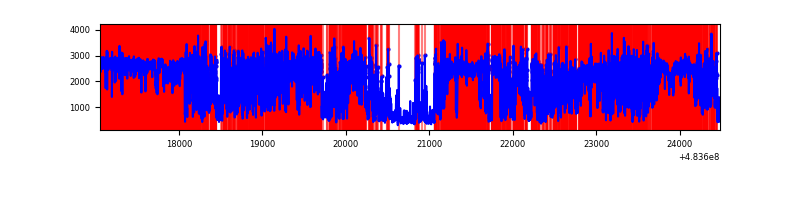 |
Top three noisy pixels from each quadrant. If the there are fewer than three noisy pixels in the level2.evt file, extra rows are filled as -1
| Pixel properties | Quadrant properties | ||||||
|---|---|---|---|---|---|---|---|
| Quadrant | DetID | PixID | Counts | Sigma | Mean | Median | Sigma |
| A | 8 | 62 | 407797 | 2124.19 | 766 | 747 | 191.6 |
| A | 12 | 3 | 312768 | 1628.28 | 766 | 747 | 191.6 |
| A | 8 | 246 | 176574 | 917.55 | 766 | 747 | 191.6 |
| B | 10 | 44 | 966144 | 6097.24 | 739 | 714 | 158.3 |
| B | 5 | 185 | 742497 | 4684.78 | 739 | 714 | 158.3 |
| B | 5 | 32 | 583389 | 3679.93 | 739 | 714 | 158.3 |
| C | 14 | 80 | 495320 | 2436.35 | 739 | 733 | 203.0 |
| C | 0 | 193 | 324888 | 1596.8 | 739 | 733 | 203.0 |
| C | 13 | 3 | 247406 | 1215.12 | 739 | 733 | 203.0 |
| D | 11 | 129 | 8522645 | 60772.1 | 494 | 476 | 140.2 |
| D | 7 | 60 | 2080352 | 14831.72 | 494 | 476 | 140.2 |
| D | 0 | 18 | 575198 | 4098.38 | 494 | 476 | 140.2 |
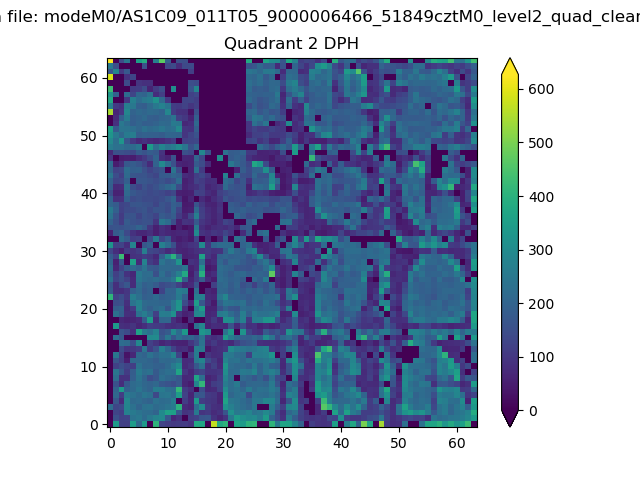
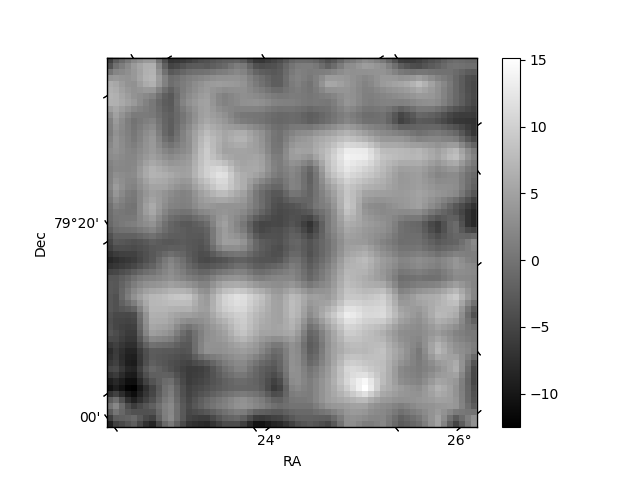
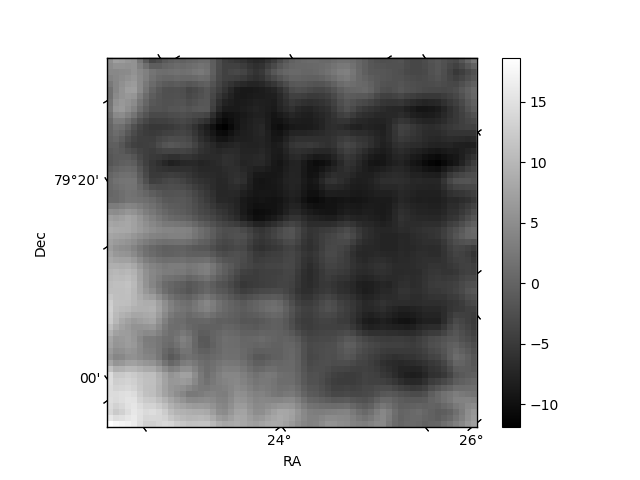
Histogram calculated using DETX and DETY for each event in the final _common_clean file
| Quadrant A | 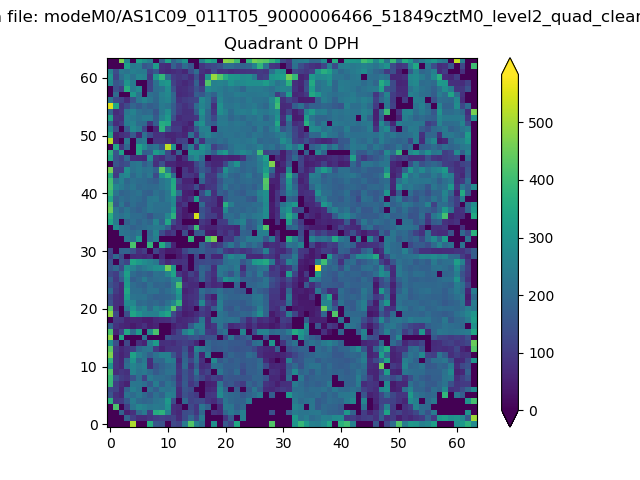 |
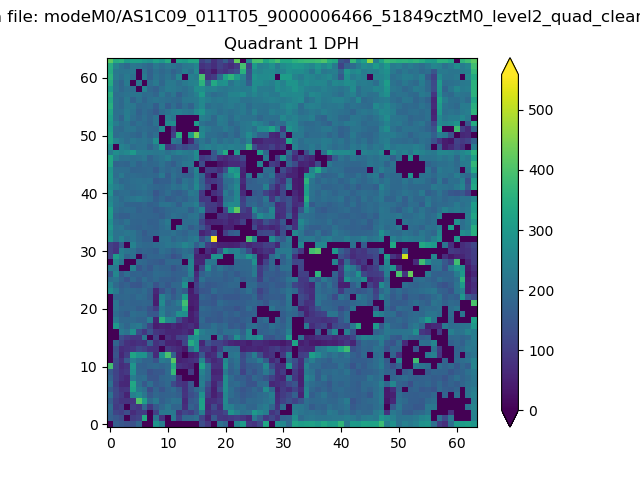 |
Quadrant B |
|---|---|---|---|
| Quadrant D | 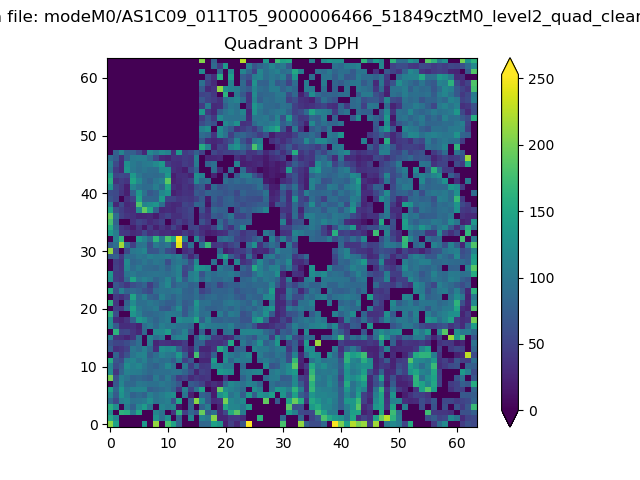 |
 |
Quadrant C |
| Plot type | Count rate plots | Images |
|---|---|---|
| Comparison with Poisson distribution Blue bars denote a histogram of data divided into 1 sec bins. Red curve is a Poisson curve with rate = median count rate of data. |
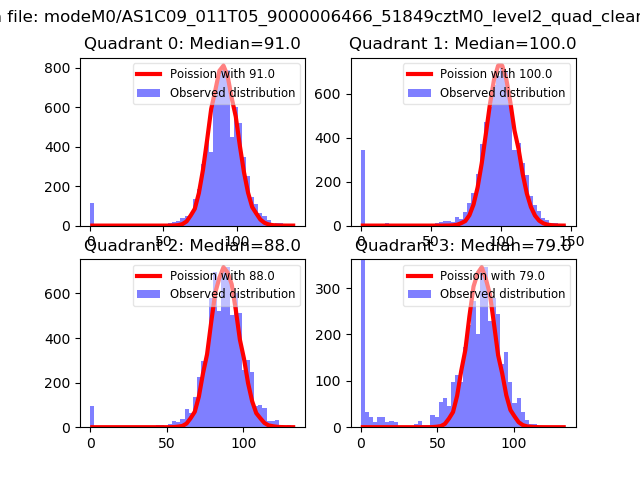 |
 |
| Quadrant-wise count rates Data is divided into 100 sec bins |
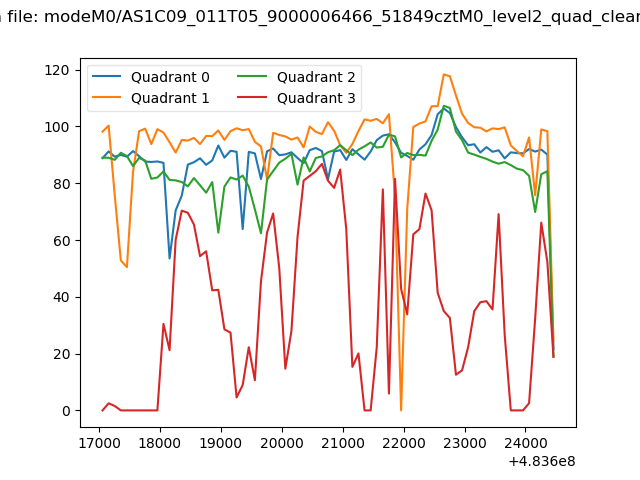 |
|
| Module-wise count rates for Quadrant A Data is divided into 100 sec bins |
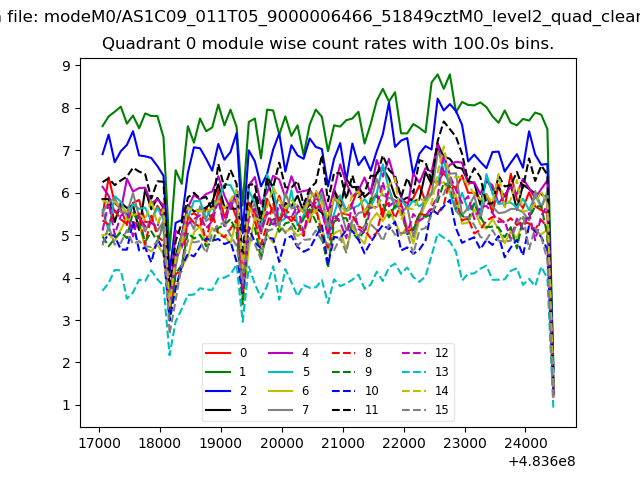 |
 |
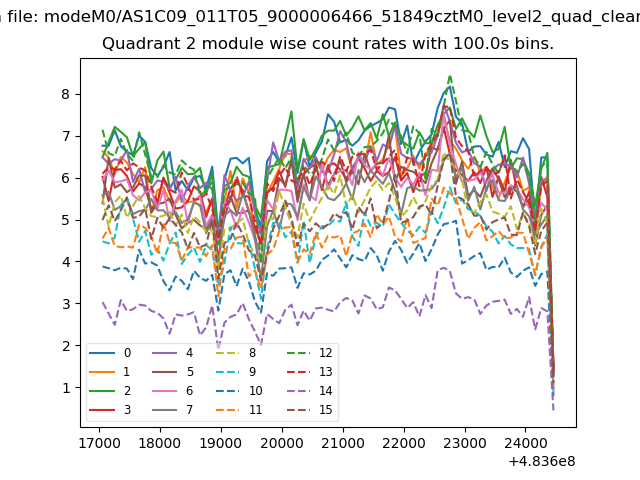
| Module-wise count rates for Quadrant B Data is divided into 100 sec bins |
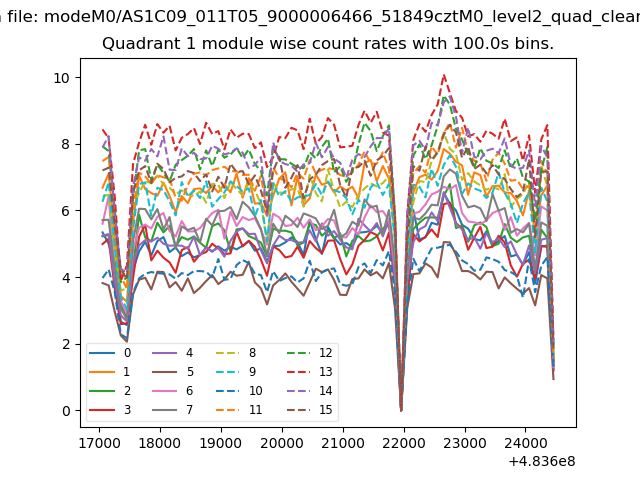 |
 |
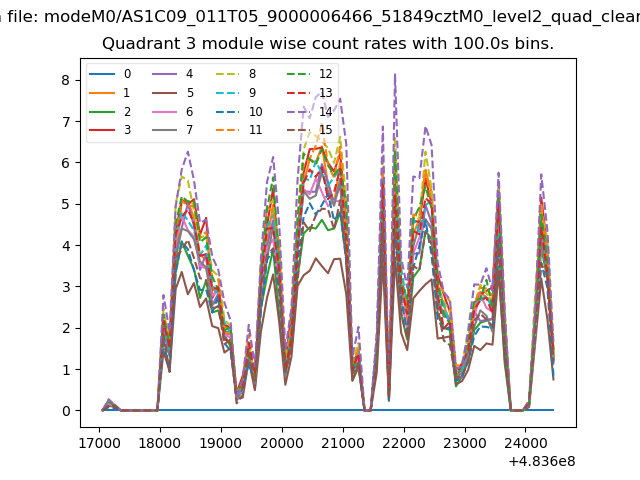
| Module-wise count rates for Quadrant C Data is divided into 100 sec bins |
 |
 |
| Module-wise count rates for Quadrant D Data is divided into 100 sec bins |
 |
 |
| Parameter | Plot |
|---|---|
| CZT HV Monitor | 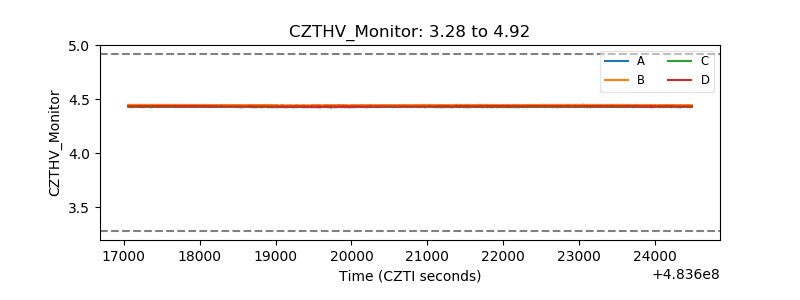 |
| D_VDD | 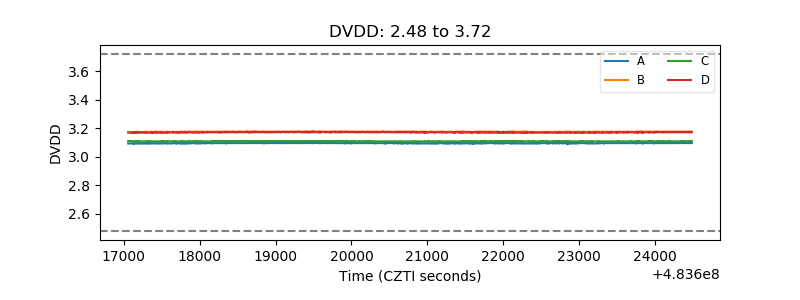 |
| Temperature 1 | 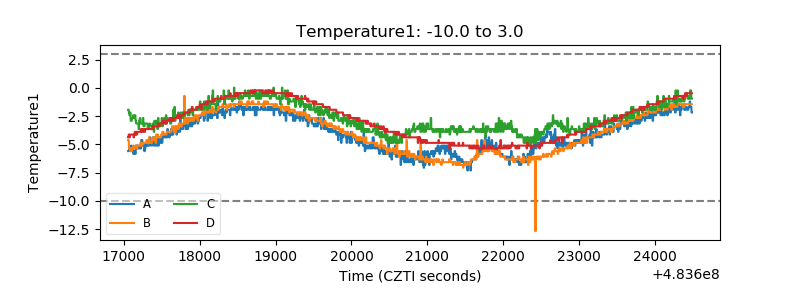 |
| Veto HV Monitor | 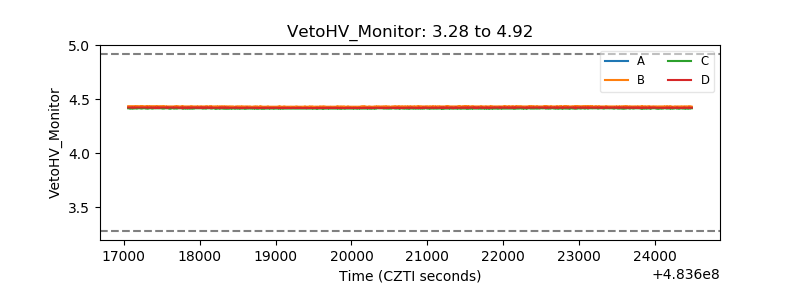 |
| Veto LLD | 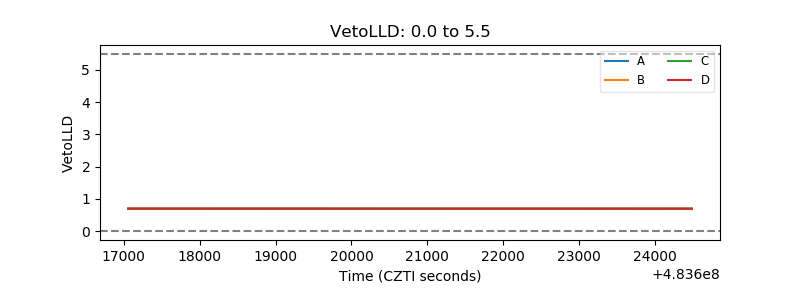 |
| Alpha Counter | 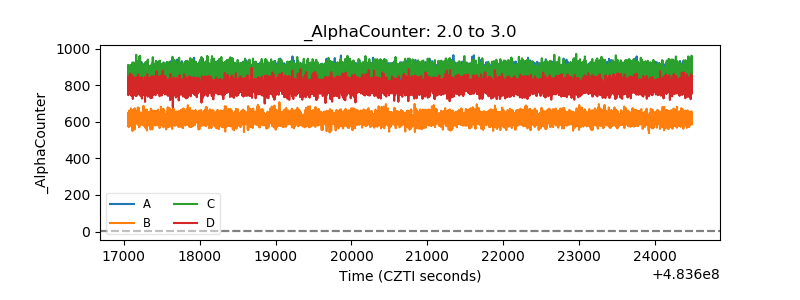 |
| _CPM_Rate | 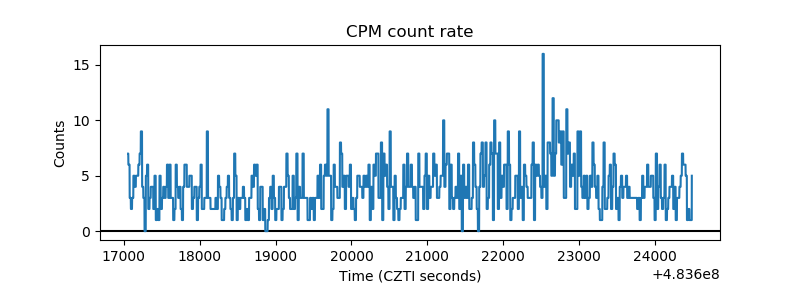 |
| CZT Counter | 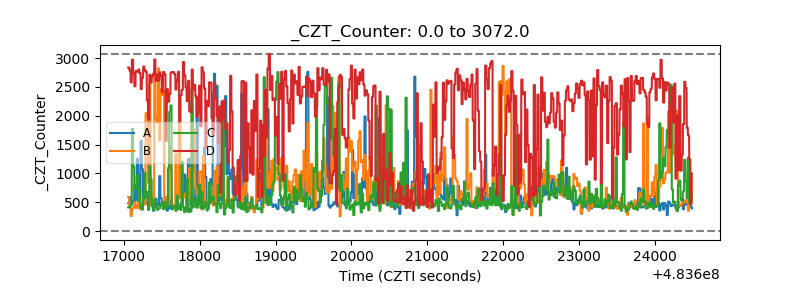 |
| +2.5 Volts monitor | 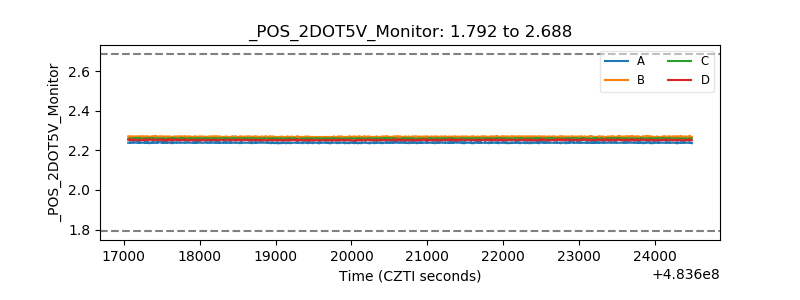 |
| +5 Volts monitor |  |
| _ROLL_ROT | 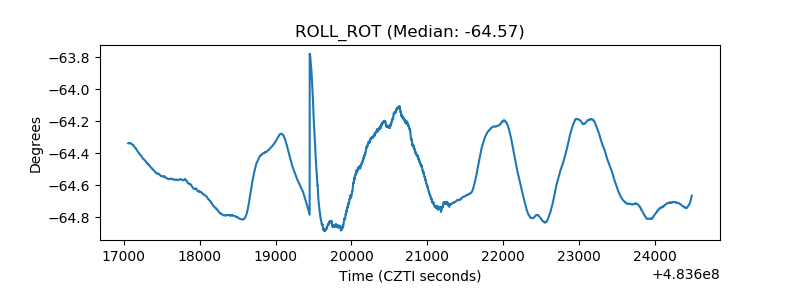 |
| _Roll_DEC | 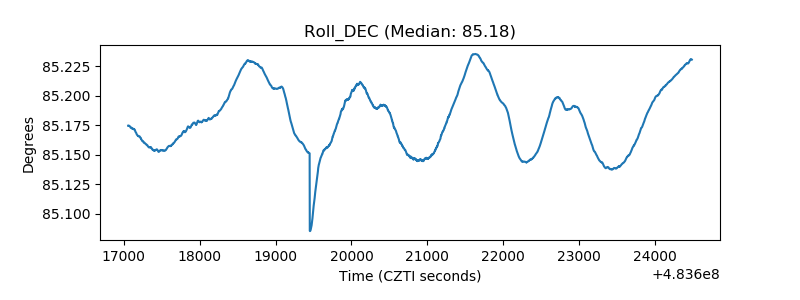 |
| _Roll_RA | 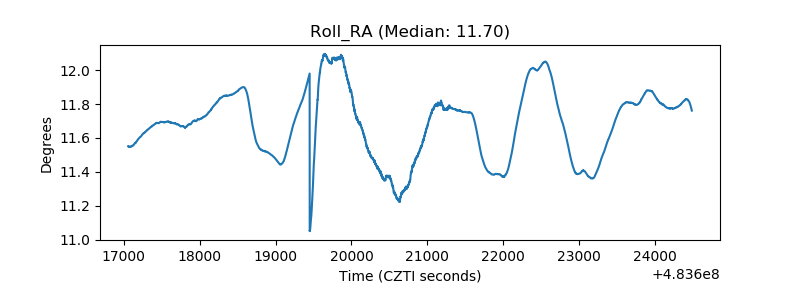 |
| Veto Counter | 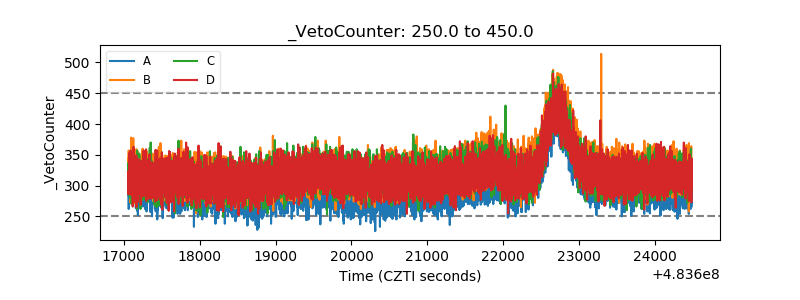 |