| Param | Original file | Final file |
|---|---|---|
| Filename | modeM0/AS1C09_011T05_9000006466_51892cztM0_level2.fits | modeM0/AS1C09_011T05_9000006466_51892cztM0_level2_quad_clean.evt |
| Size (bytes) | 893,033,280 | 87,730,560 |
| Size | 851.7 MB | 83.7 MB |
| Events in quadrant A | 6,020,390 | 644,571 |
| Events in quadrant B | 7,631,408 | 607,011 |
| Events in quadrant C | 4,978,529 | 627,881 |
| Events in quadrant D | 13,866,939 | 272,419 |
| Mode SS | |||
|---|---|---|---|
| Quadrant | BADHDUFLAG | Total packets | Discarded packets |
| A | 0 | 144 | 0 |
| B | 0 | 144 | 0 |
| C | 0 | 144 | 0 |
| D | 0 | 144 | 0 |
| Mode M0 | |||
|---|---|---|---|
| Quadrant | BADHDUFLAG | Total packets | Discarded packets |
| A | 0 | 22961 | 0 |
| B | 0 | 27658 | 0 |
| C | 0 | 19740 | 0 |
| D | 0 | 46207 | 0 |
| Quadrant | Total seconds | Saturated seconds | Saturation percentage |
|---|---|---|---|
| A | 7241 | 232 | 3.203977% |
| B | 7242 | 1394 | 19.248826% |
| C | 7242 | 253 | 3.493510% |
| D | 7242 | 4304 | 59.431096% |
Noise dominated data is calculated using 1-second bins in cleaned event files. If a bin has >2000 counts, and if more than 50% of those come from <1% of pixels, then it is considered to be noise-dominated and hence unusable.
| Quadrant | # 1 sec bins | Bins with >0 counts | Bins with >2000 counts | High rate bins dominated by noise | Noise dominated (total time) | Noise dominated (detector-on time) | Marked lightcurve |
|---|---|---|---|---|---|---|---|
| A | 7241 | 7241 | 182 | 182 | 2.51% | 2.51% | 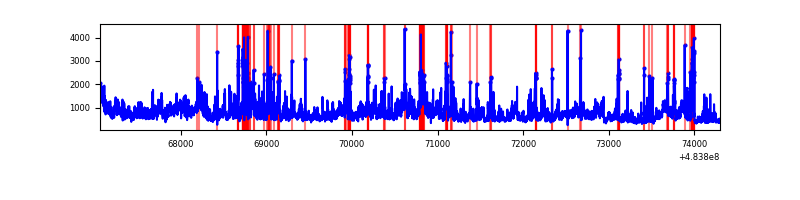 |
| B | 7242 | 7242 | 960 | 960 | 13.26% | 13.26% | 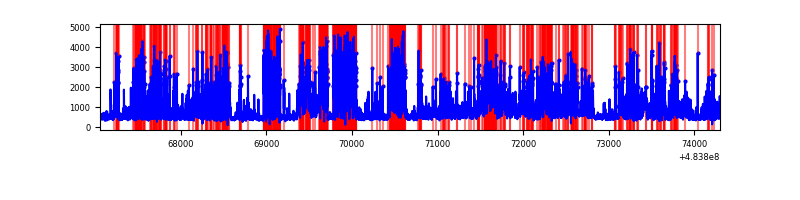 |
| C | 7242 | 7242 | 200 | 200 | 2.76% | 2.76% | 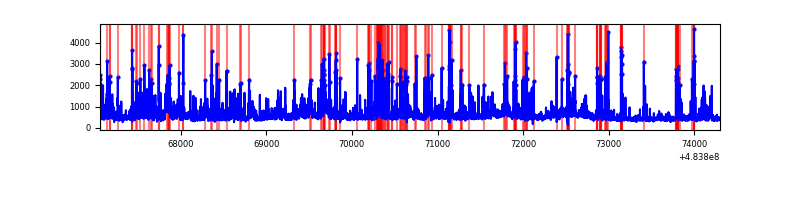 |
| D | 7242 | 7242 | 3442 | 3442 | 47.53% | 47.53% | 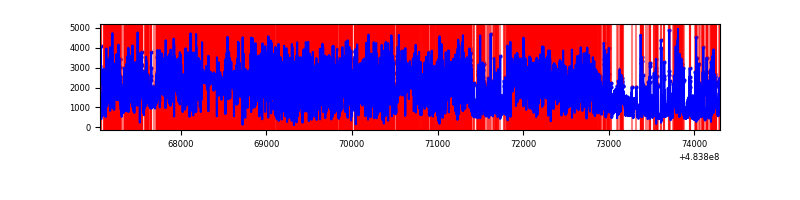 |
Top three noisy pixels from each quadrant. If the there are fewer than three noisy pixels in the level2.evt file, extra rows are filled as -1
| Pixel properties | Quadrant properties | ||||||
|---|---|---|---|---|---|---|---|
| Quadrant | DetID | PixID | Counts | Sigma | Mean | Median | Sigma |
| A | 12 | 3 | 1495784 | 8166.29 | 737 | 717 | 183.1 |
| A | 15 | 174 | 499021 | 2721.81 | 737 | 717 | 183.1 |
| A | 12 | 194 | 178074 | 968.75 | 737 | 717 | 183.1 |
| B | 4 | 170 | 2252530 | 15493.78 | 684 | 661 | 145.3 |
| B | 12 | 32 | 1389821 | 9557.99 | 684 | 661 | 145.3 |
| B | 4 | 171 | 228596 | 1568.29 | 684 | 661 | 145.3 |
| C | 13 | 3 | 688277 | 3513.29 | 712 | 705 | 195.7 |
| C | 15 | 192 | 332045 | 1693.05 | 712 | 705 | 195.7 |
| C | 14 | 245 | 145573 | 740.23 | 712 | 705 | 195.7 |
| D | 11 | 129 | 8029051 | 60905.03 | 472 | 456 | 131.8 |
| D | 6 | 42 | 1302741 | 9879.15 | 472 | 456 | 131.8 |
| D | 12 | 17 | 690131 | 5231.88 | 472 | 456 | 131.8 |
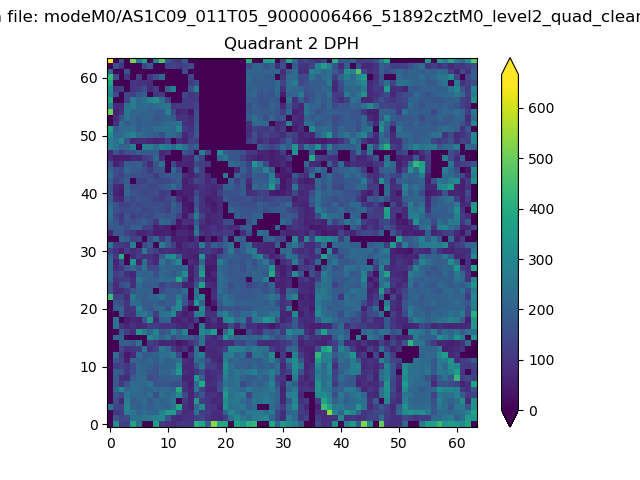
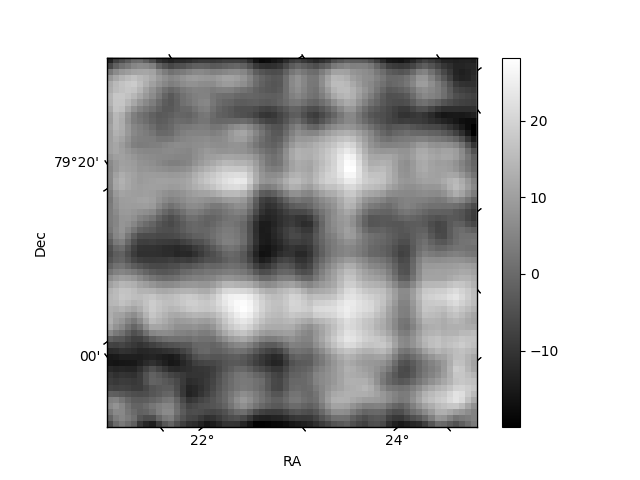
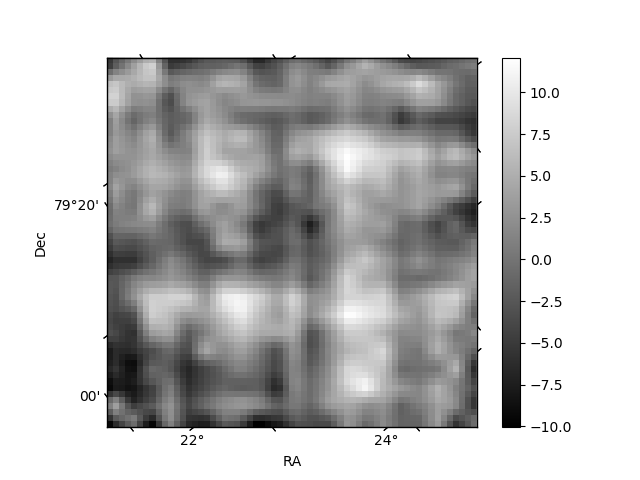
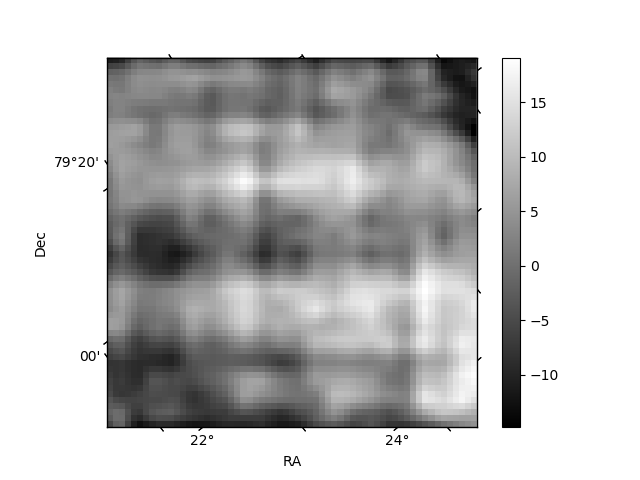
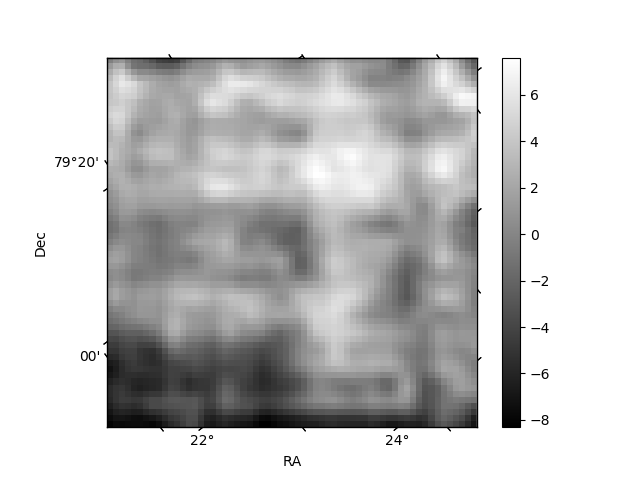
Histogram calculated using DETX and DETY for each event in the final _common_clean file
| Quadrant A | 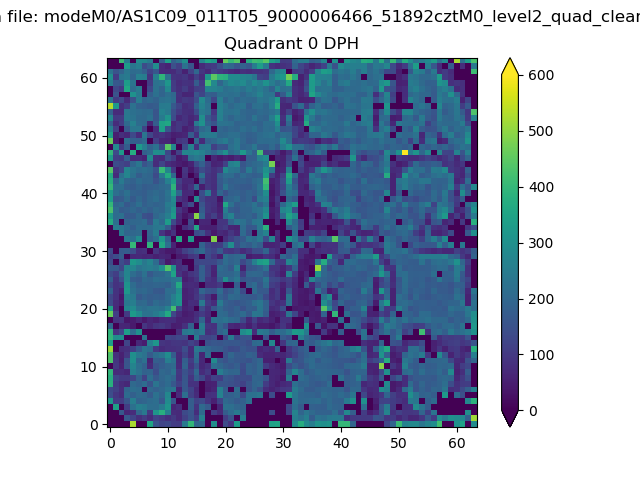 |
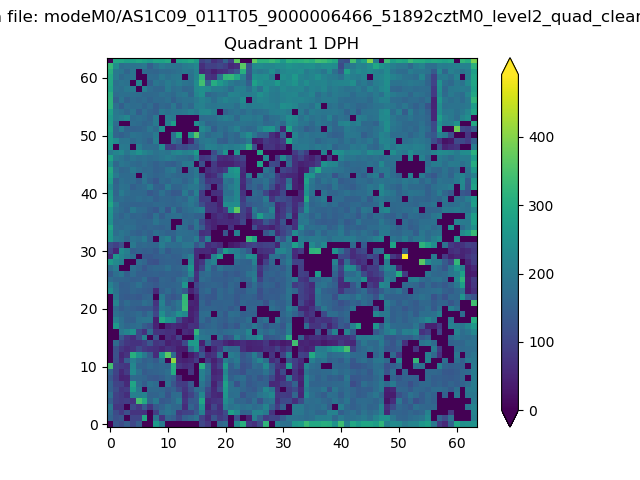 |
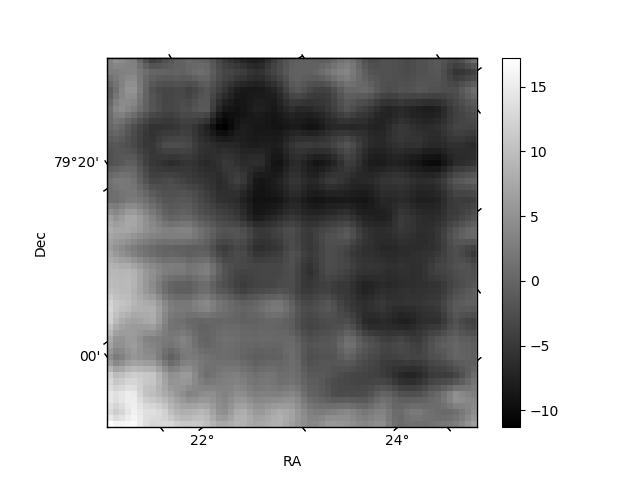
Quadrant B |
|---|---|---|---|
| Quadrant D | 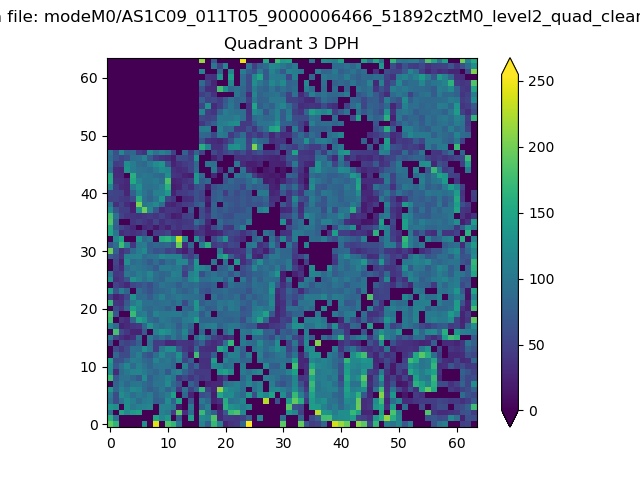 |
 |
Quadrant C |
| Plot type | Count rate plots | Images |
|---|---|---|
| Comparison with Poisson distribution Blue bars denote a histogram of data divided into 1 sec bins. Red curve is a Poisson curve with rate = median count rate of data. |
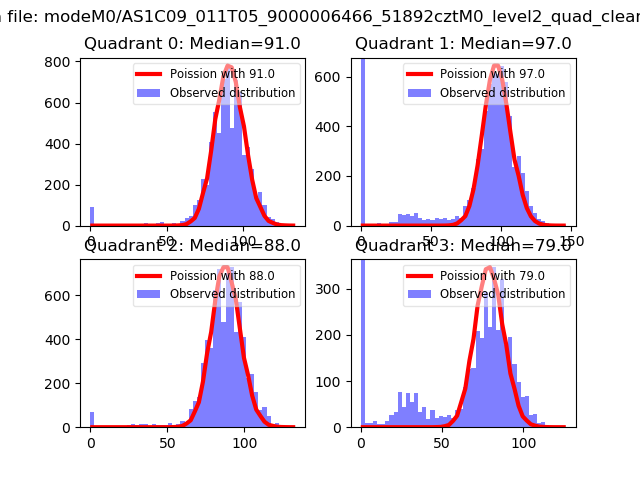 |
 |
| Quadrant-wise count rates Data is divided into 100 sec bins |
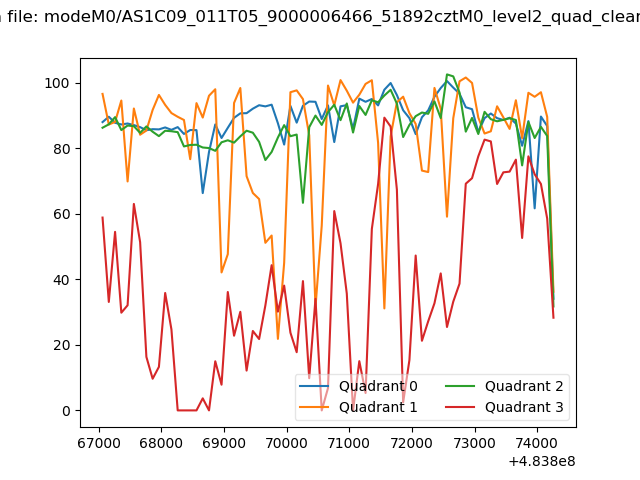 |
|
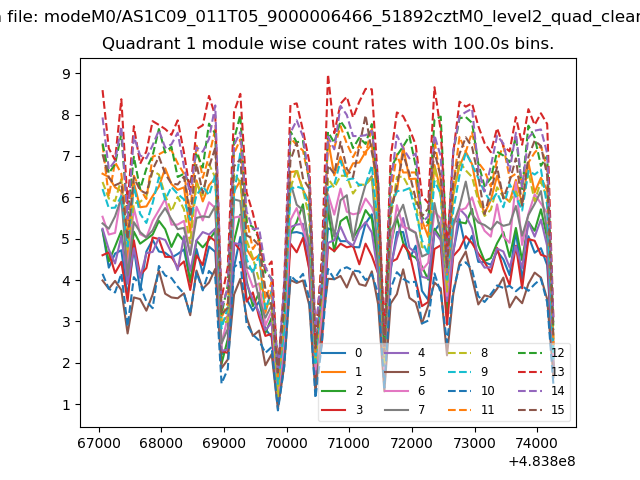
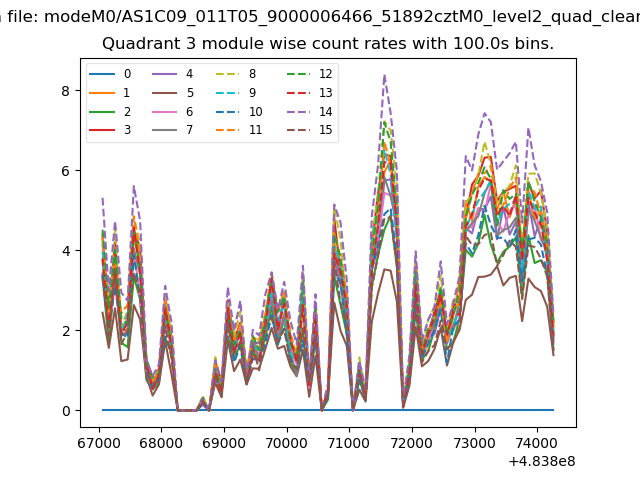
| Module-wise count rates for Quadrant A Data is divided into 100 sec bins |
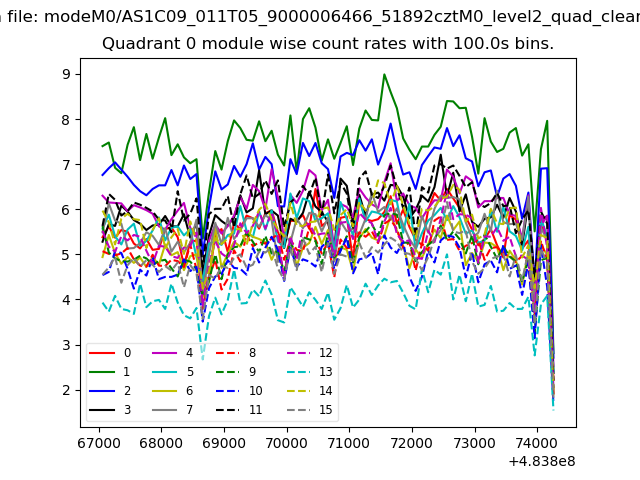 |
 |
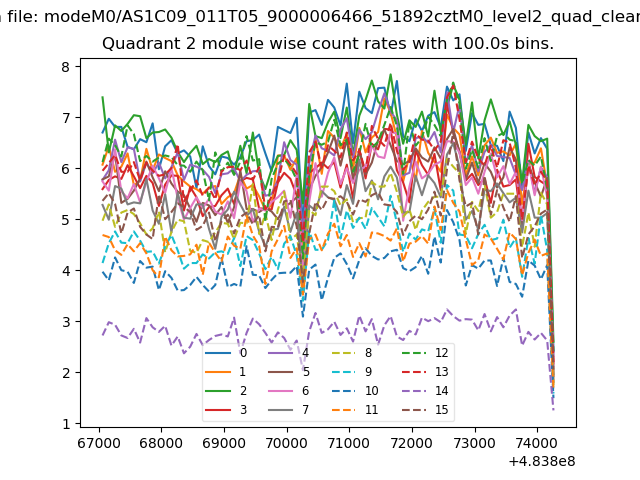
| Module-wise count rates for Quadrant B Data is divided into 100 sec bins |
 |
 |
| Module-wise count rates for Quadrant C Data is divided into 100 sec bins |
 |
 |
| Module-wise count rates for Quadrant D Data is divided into 100 sec bins |
 |
 |
| Parameter | Plot |
|---|---|
| CZT HV Monitor | 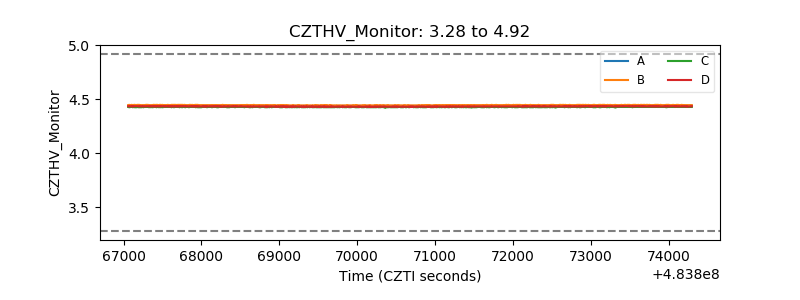 |
| D_VDD | 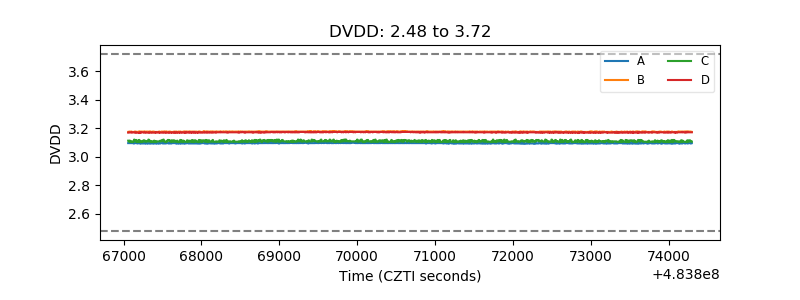 |
| Temperature 1 | 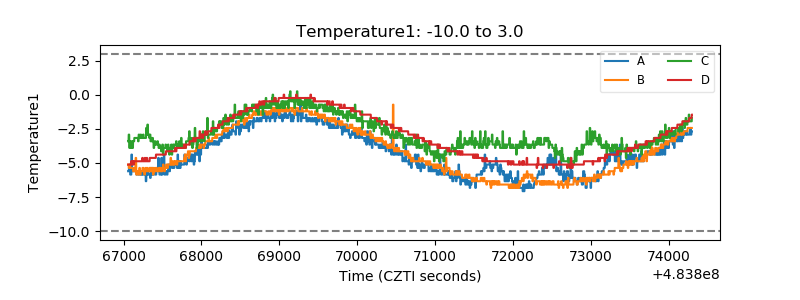 |
| Veto HV Monitor | 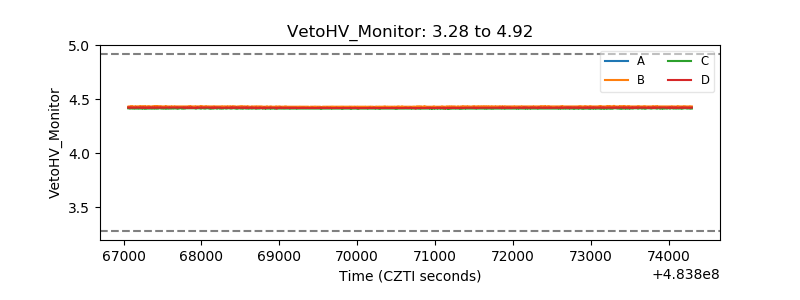 |
| Veto LLD | 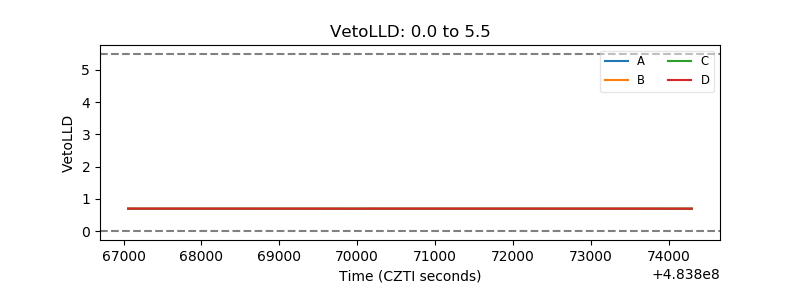 |
| Alpha Counter | 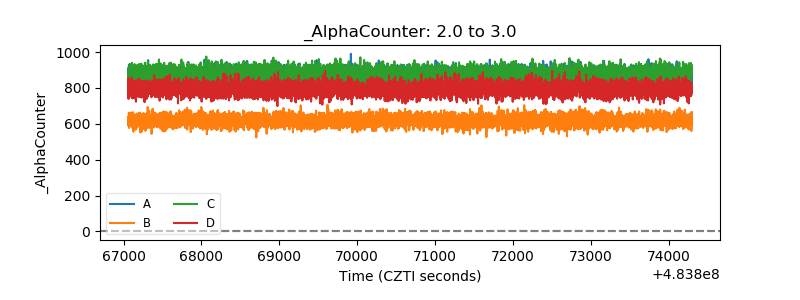 |
| _CPM_Rate | 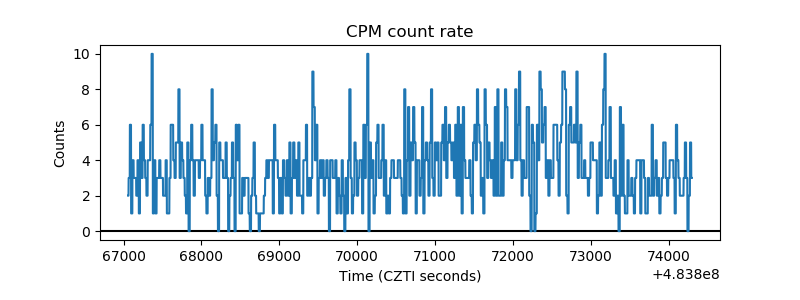 |
| CZT Counter | 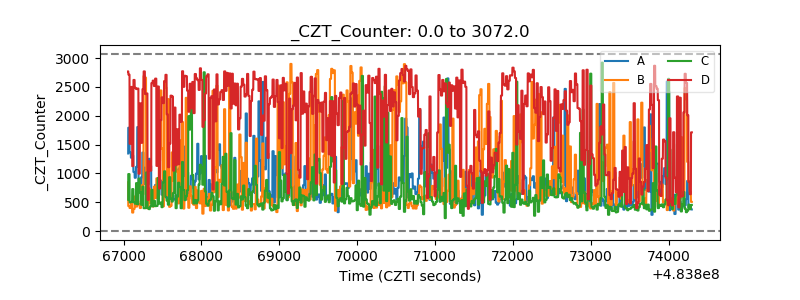 |
| +2.5 Volts monitor | 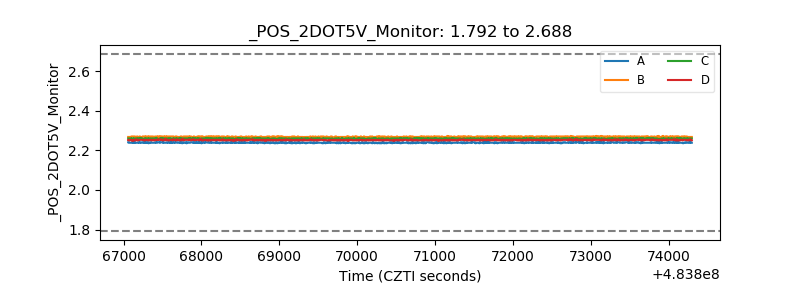 |
| +5 Volts monitor |  |
| _ROLL_ROT | 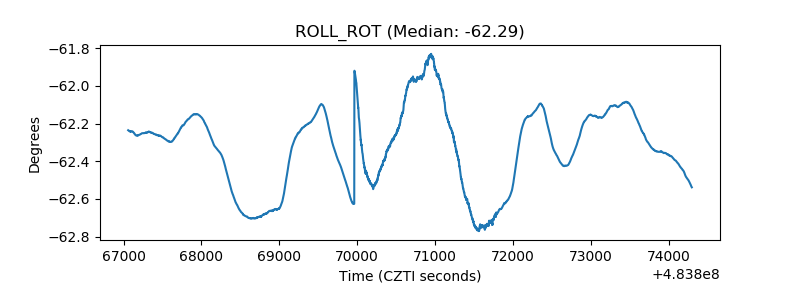 |
| _Roll_DEC | 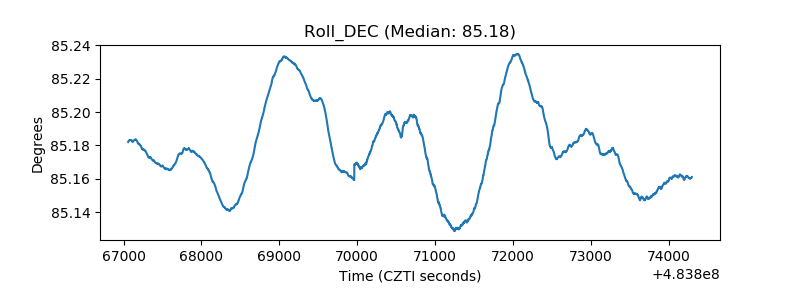 |
| _Roll_RA | 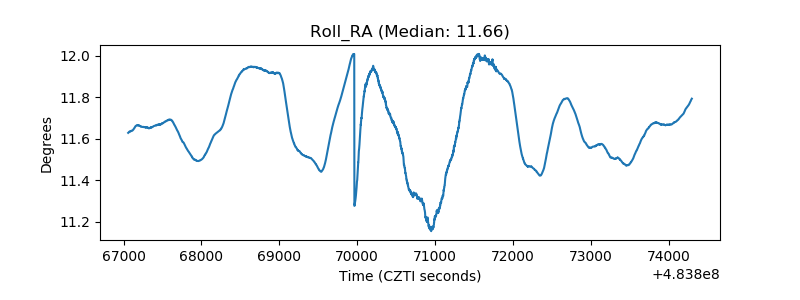 |
| Veto Counter | 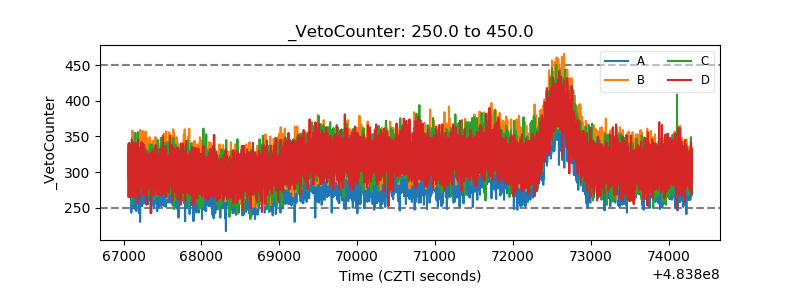 |