| Param | Original file | Final file |
|---|---|---|
| Filename | modeM0/AS1C09_011T05_9000006466_51920cztM0_level2.fits | modeM0/AS1C09_011T05_9000006466_51920cztM0_level2_quad_clean.evt |
| Size (bytes) | 999,388,800 | 81,982,080 |
| Size | 953.1 MB | 78.2 MB |
| Events in quadrant A | 7,732,650 | 595,110 |
| Events in quadrant B | 6,196,742 | 647,284 |
| Events in quadrant C | 8,318,186 | 506,677 |
| Events in quadrant D | 14,186,977 | 228,642 |
| Mode SS | |||
|---|---|---|---|
| Quadrant | BADHDUFLAG | Total packets | Discarded packets |
| A | 0 | 144 | 0 |
| B | 0 | 144 | 0 |
| C | 0 | 144 | 0 |
| D | 0 | 144 | 0 |
| Mode M0 | |||
|---|---|---|---|
| Quadrant | BADHDUFLAG | Total packets | Discarded packets |
| A | 0 | 27959 | 0 |
| B | 0 | 23541 | 0 |
| C | 0 | 29852 | 0 |
| D | 0 | 47169 | 0 |
| Quadrant | Total seconds | Saturated seconds | Saturation percentage |
|---|---|---|---|
| A | 7241 | 1028 | 14.196934% |
| B | 7241 | 966 | 13.340699% |
| C | 7241 | 1832 | 25.300373% |
| D | 7242 | 4769 | 65.851975% |
Noise dominated data is calculated using 1-second bins in cleaned event files. If a bin has >2000 counts, and if more than 50% of those come from <1% of pixels, then it is considered to be noise-dominated and hence unusable.
| Quadrant | # 1 sec bins | Bins with >0 counts | Bins with >2000 counts | High rate bins dominated by noise | Noise dominated (total time) | Noise dominated (detector-on time) | Marked lightcurve |
|---|---|---|---|---|---|---|---|
| A | 7240 | 7240 | 948 | 948 | 13.09% | 13.09% | 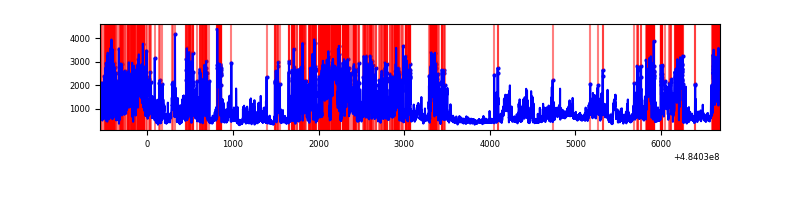 |
| B | 7241 | 7241 | 691 | 691 | 9.54% | 9.54% | 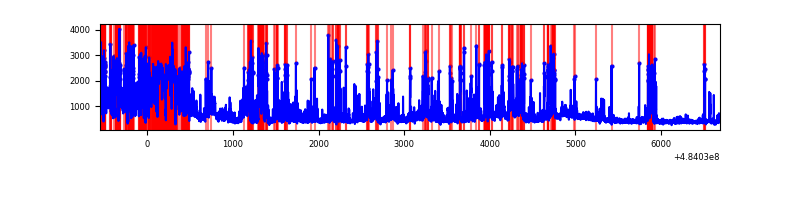 |
| C | 7241 | 7241 | 1542 | 1542 | 21.30% | 21.30% | 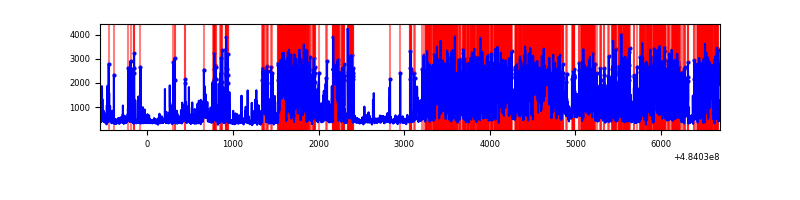 |
| D | 7242 | 7242 | 4017 | 4017 | 55.47% | 55.47% | 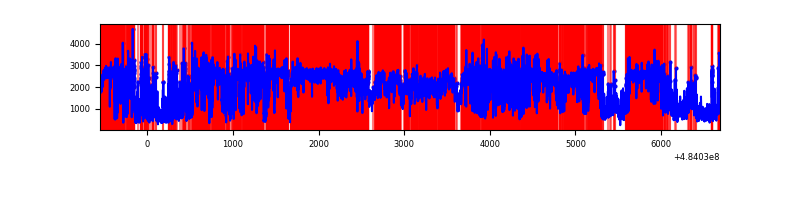 |
Top three noisy pixels from each quadrant. If the there are fewer than three noisy pixels in the level2.evt file, extra rows are filled as -1
| Pixel properties | Quadrant properties | ||||||
|---|---|---|---|---|---|---|---|
| Quadrant | DetID | PixID | Counts | Sigma | Mean | Median | Sigma |
| A | 7 | 64 | 2461393 | 14232.6 | 703 | 685 | 172.9 |
| A | 12 | 3 | 825981 | 4773.47 | 703 | 685 | 172.9 |
| A | 15 | 174 | 513460 | 2965.86 | 703 | 685 | 172.9 |
| B | 4 | 206 | 2385523 | 15829.5 | 697 | 673 | 150.7 |
| B | 5 | 185 | 212996 | 1409.3 | 697 | 673 | 150.7 |
| B | 10 | 254 | 122648 | 809.61 | 697 | 673 | 150.7 |
| C | 15 | 224 | 4359915 | 25001.54 | 632 | 627 | 174.4 |
| C | 15 | 158 | 413291 | 2366.73 | 632 | 627 | 174.4 |
| C | 13 | 3 | 324408 | 1856.96 | 632 | 627 | 174.4 |
| D | 15 | 94 | 7702224 | 62406.37 | 390 | 375 | 123.4 |
| D | 6 | 42 | 2327996 | 18860.19 | 390 | 375 | 123.4 |
| D | 3 | 12 | 628763 | 5091.69 | 390 | 375 | 123.4 |
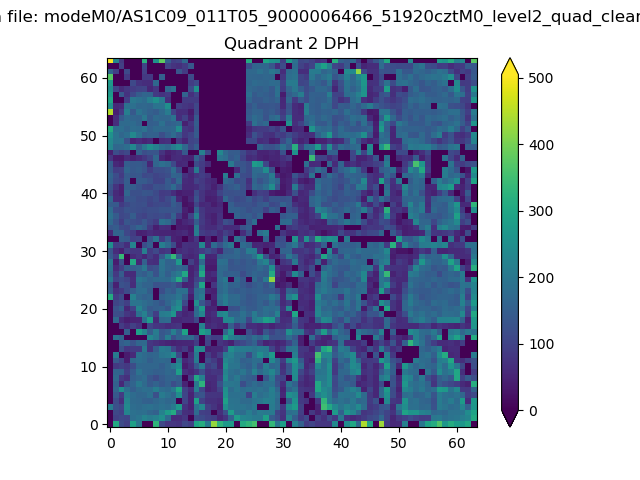
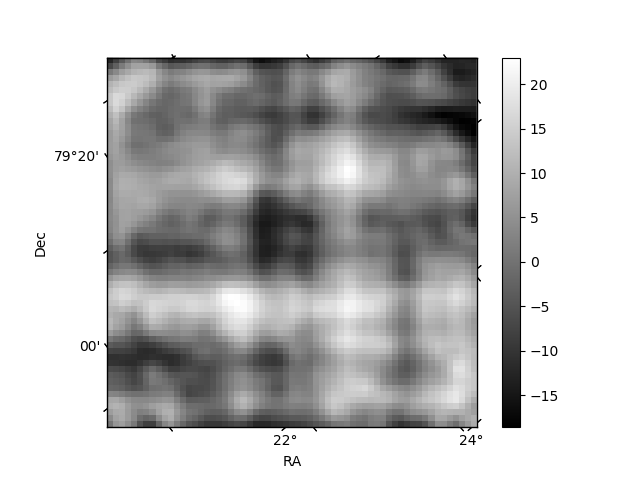
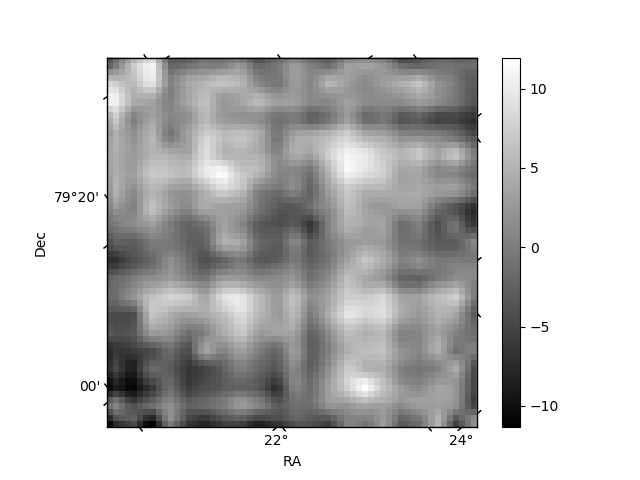
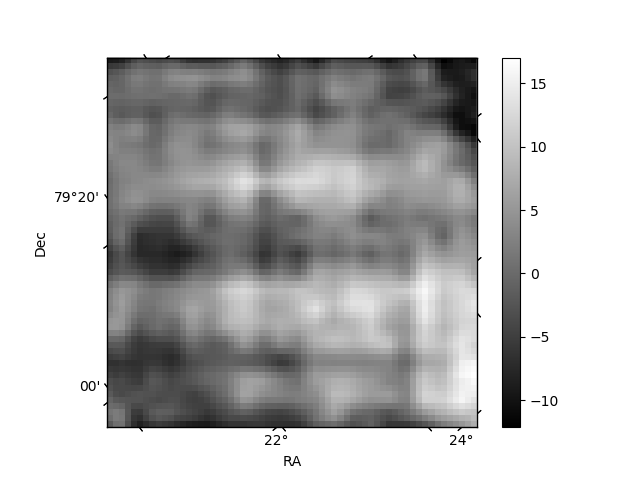
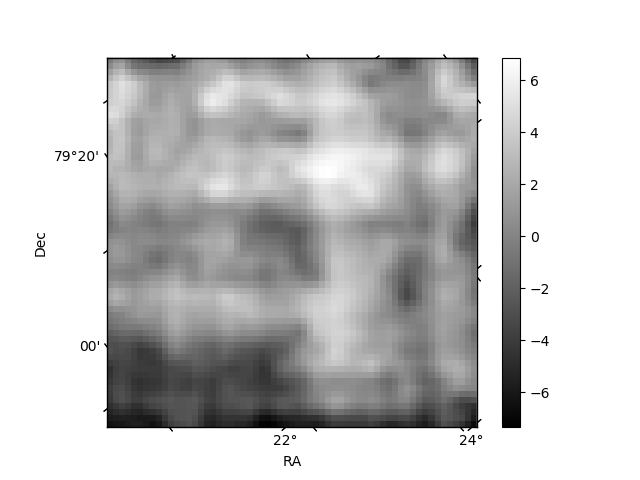
Histogram calculated using DETX and DETY for each event in the final _common_clean file
| Quadrant A | 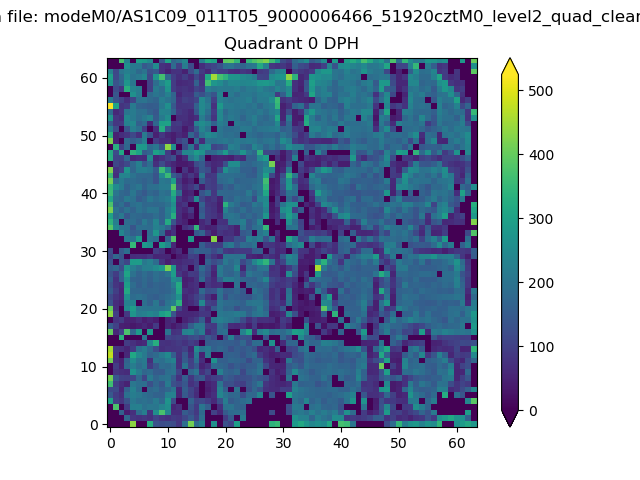 |
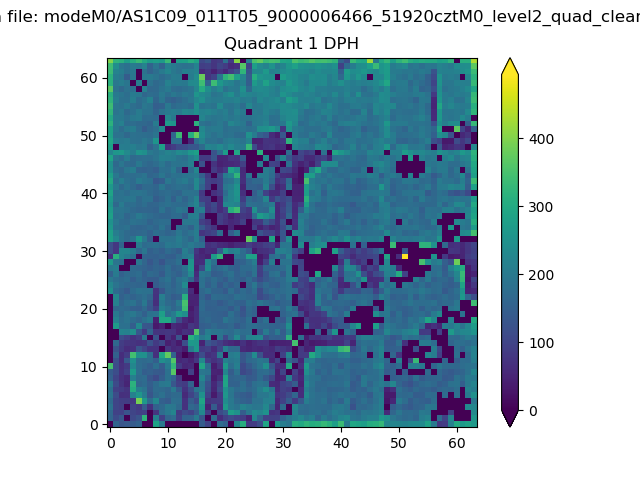 |
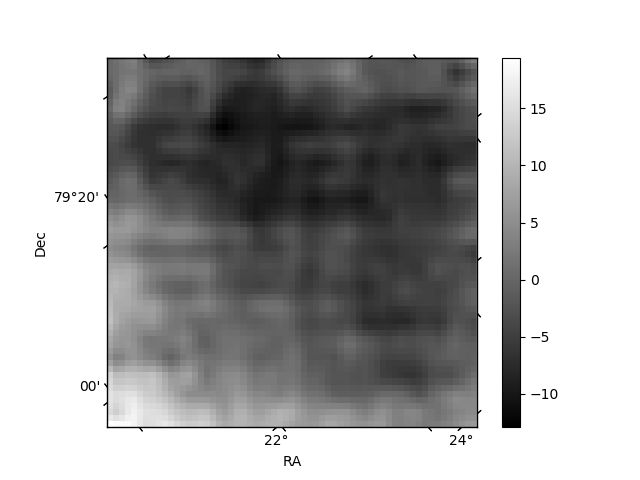
Quadrant B |
|---|---|---|---|
| Quadrant D | 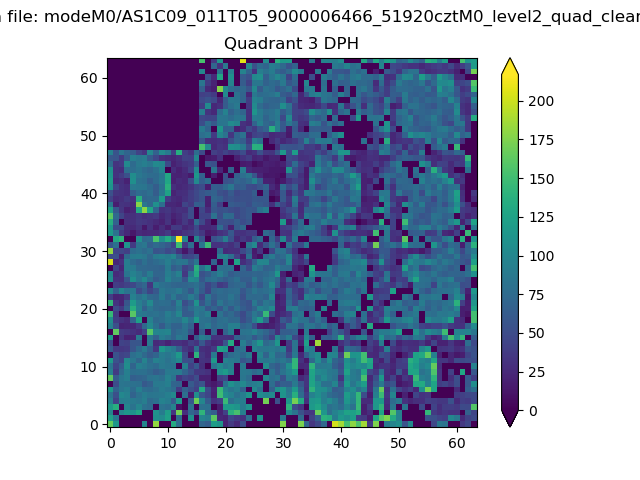 |
 |
Quadrant C |
| Plot type | Count rate plots | Images |
|---|---|---|
| Comparison with Poisson distribution Blue bars denote a histogram of data divided into 1 sec bins. Red curve is a Poisson curve with rate = median count rate of data. |
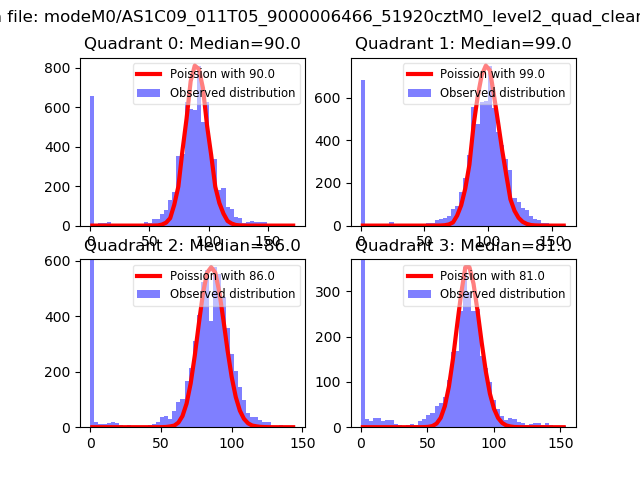 |
 |
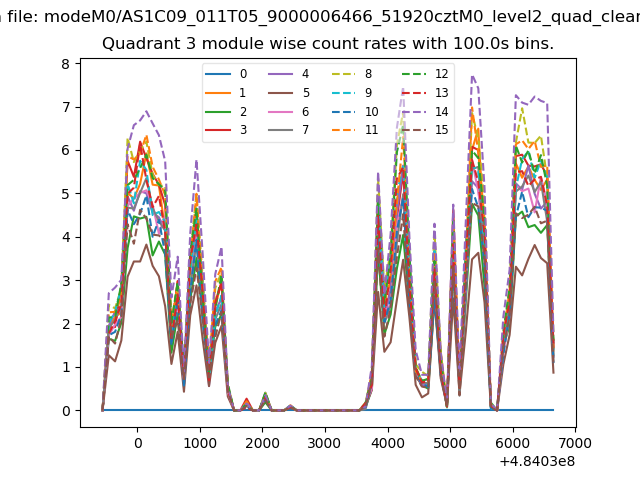
| Quadrant-wise count rates Data is divided into 100 sec bins |
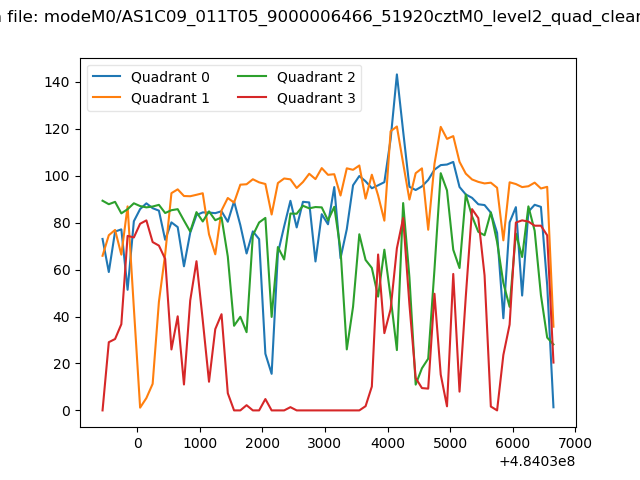 |
|
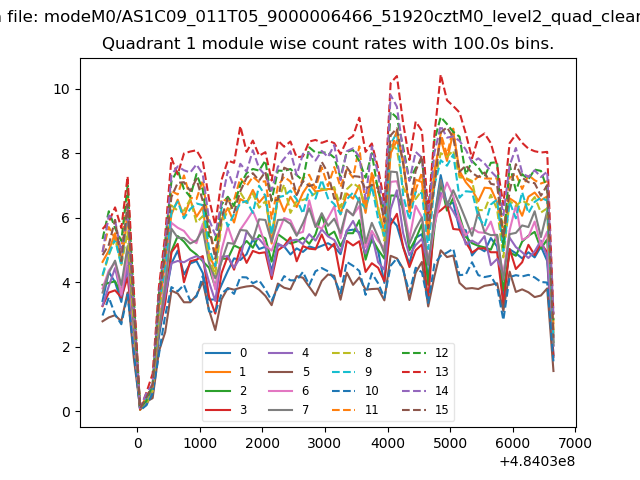
| Module-wise count rates for Quadrant A Data is divided into 100 sec bins |
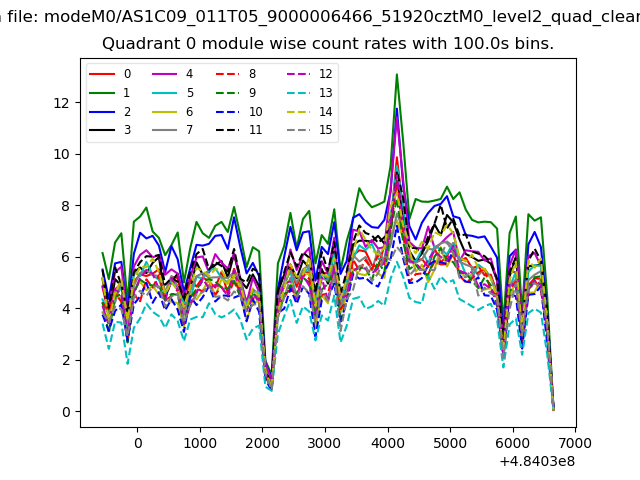 |
 |
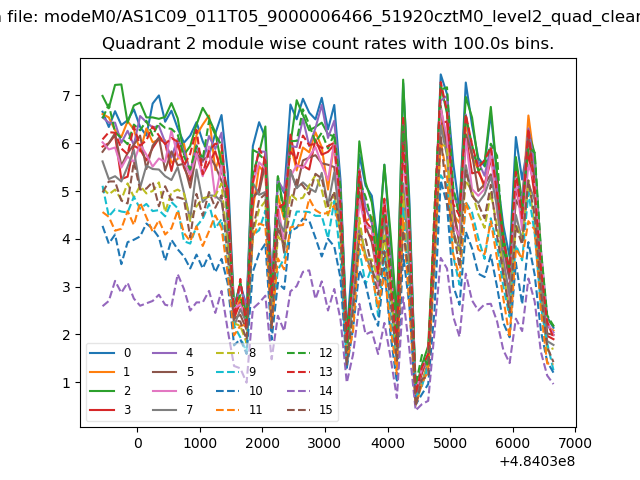
| Module-wise count rates for Quadrant B Data is divided into 100 sec bins |
 |
 |
| Module-wise count rates for Quadrant C Data is divided into 100 sec bins |
 |
 |
| Module-wise count rates for Quadrant D Data is divided into 100 sec bins |
 |
 |
| Parameter | Plot |
|---|---|
| CZT HV Monitor | 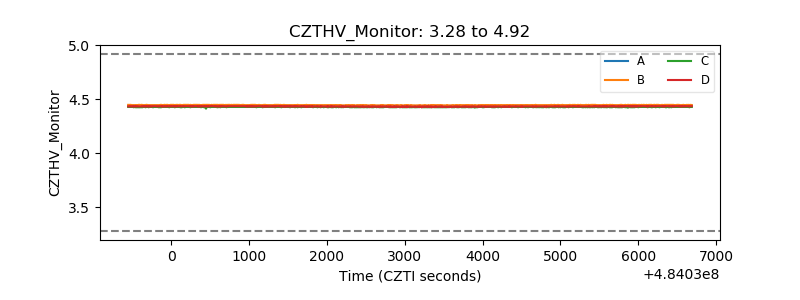 |
| D_VDD |  |
| Temperature 1 | 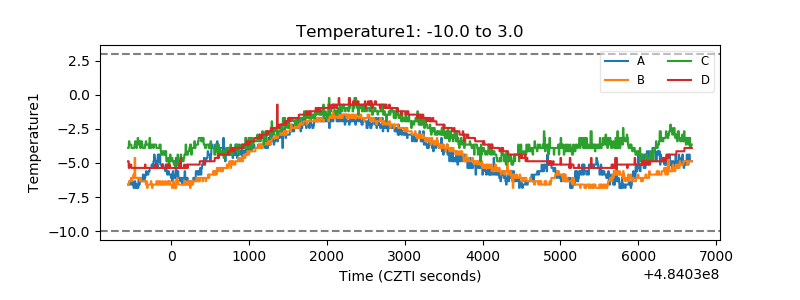 |
| Veto HV Monitor | 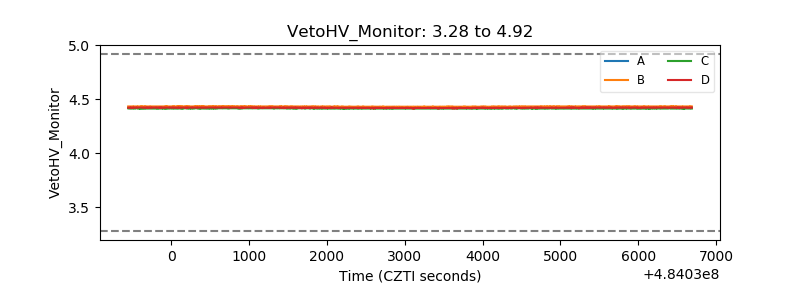 |
| Veto LLD | 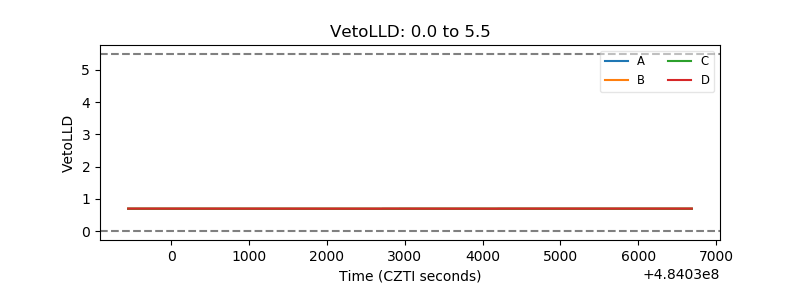 |
| Alpha Counter | 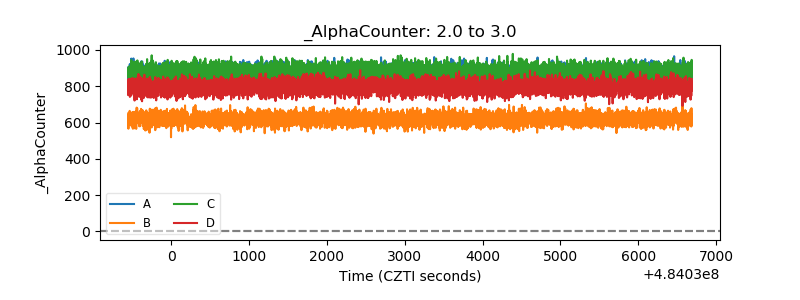 |
| _CPM_Rate | 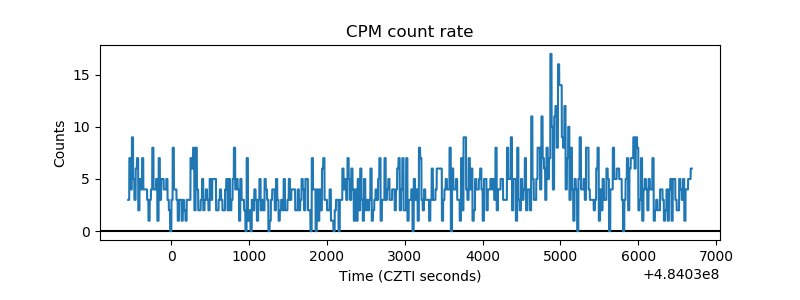 |
| CZT Counter | 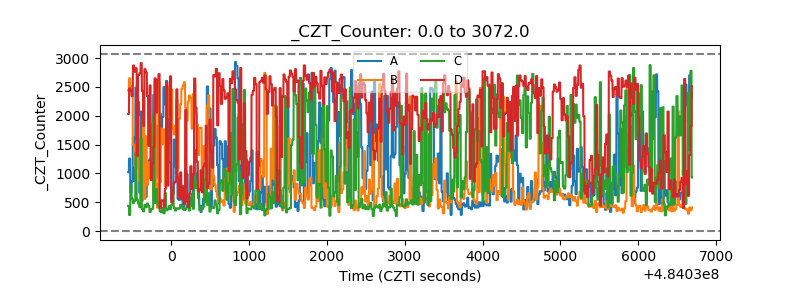 |
| +2.5 Volts monitor | 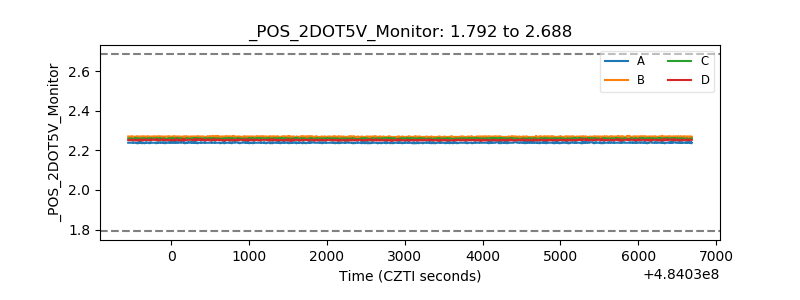 |
| +5 Volts monitor |  |
| _ROLL_ROT | 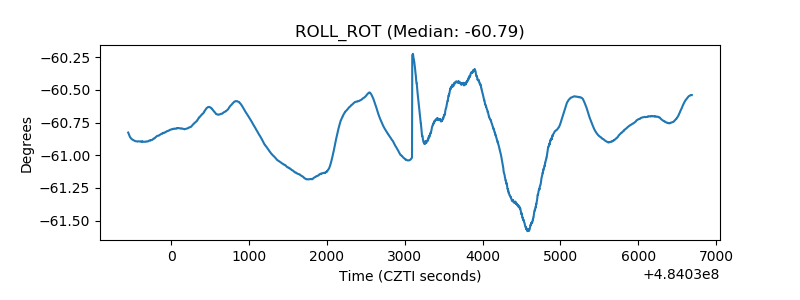 |
| _Roll_DEC | 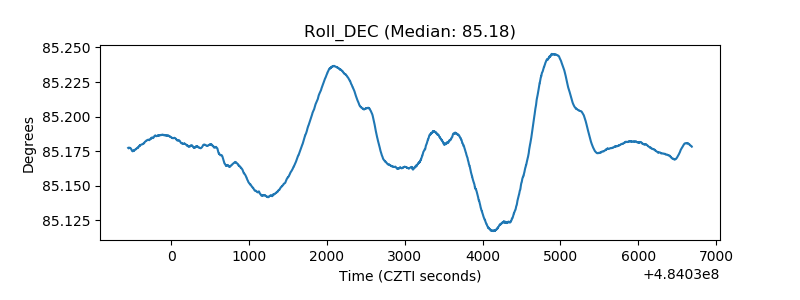 |
| _Roll_RA | 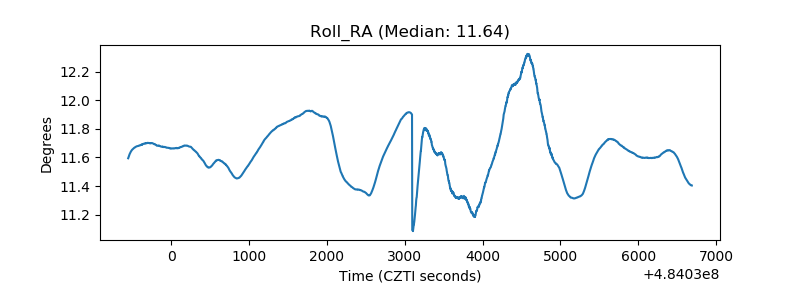 |
| Veto Counter | 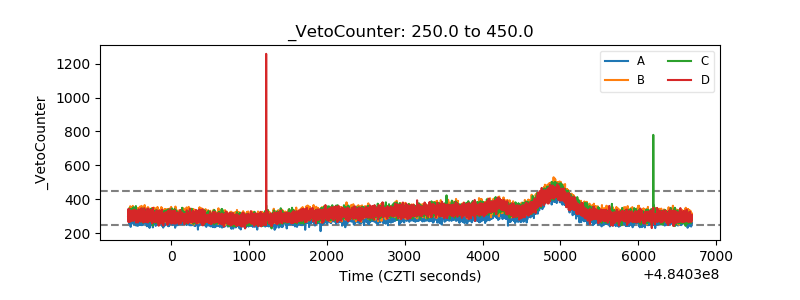 |