| Param | Original file | Final file |
|---|---|---|
| Filename | modeM0/AS1C09_011T06_9000006468_51968cztM0_level2.fits | modeM0/AS1C09_011T06_9000006468_51968cztM0_level2_quad_clean.evt |
| Size (bytes) | 1,293,030,720 | 75,790,080 |
| Size | 1.2 GB | 72.3 MB |
| Events in quadrant A | 5,592,332 | 671,756 |
| Events in quadrant B | 13,335,168 | 367,265 |
| Events in quadrant C | 12,559,193 | 413,498 |
| Events in quadrant D | 15,784,007 | 305,590 |
| Mode M0 | |||
|---|---|---|---|
| Quadrant | BADHDUFLAG | Total packets | Discarded packets |
| A | 0 | 21921 | 0 |
| B | 0 | 44962 | 0 |
| C | 0 | 42563 | 0 |
| D | 0 | 52108 | 0 |
| Mode SS | |||
|---|---|---|---|
| Quadrant | BADHDUFLAG | Total packets | Discarded packets |
| A | 0 | 154 | 0 |
| B | 0 | 154 | 0 |
| C | 0 | 154 | 0 |
| D | 0 | 154 | 0 |
| Quadrant | Total seconds | Saturated seconds | Saturation percentage |
|---|---|---|---|
| A | 7701 | 527 | 6.843267% |
| B | 7702 | 4258 | 55.284342% |
| C | 7702 | 3481 | 45.196053% |
| D | 7702 | 4491 | 58.309530% |
Noise dominated data is calculated using 1-second bins in cleaned event files. If a bin has >2000 counts, and if more than 50% of those come from <1% of pixels, then it is considered to be noise-dominated and hence unusable.
| Quadrant | # 1 sec bins | Bins with >0 counts | Bins with >2000 counts | High rate bins dominated by noise | Noise dominated (total time) | Noise dominated (detector-on time) | Marked lightcurve |
|---|---|---|---|---|---|---|---|
| A | 7701 | 7701 | 324 | 324 | 4.21% | 4.21% | 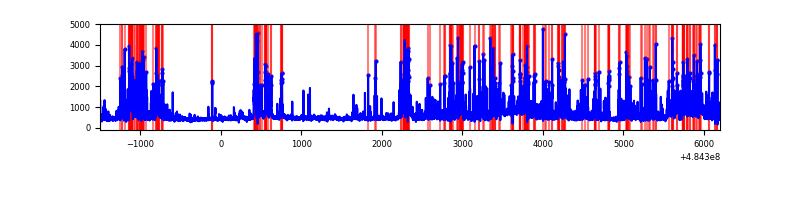 |
| B | 7702 | 7702 | 3362 | 3362 | 43.65% | 43.65% | 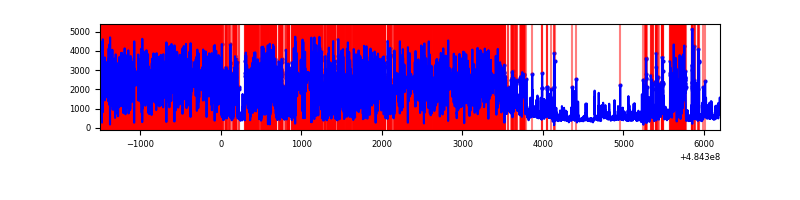 |
| C | 7701 | 7701 | 2610 | 2610 | 33.89% | 33.89% | 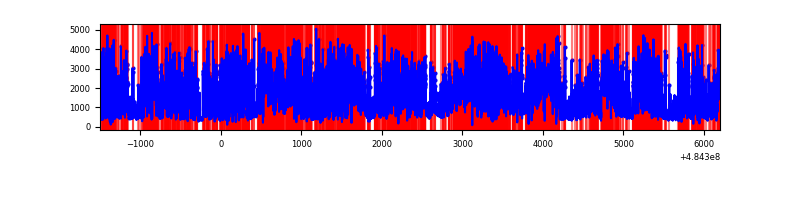 |
| D | 7702 | 7702 | 4155 | 4155 | 53.95% | 53.95% | 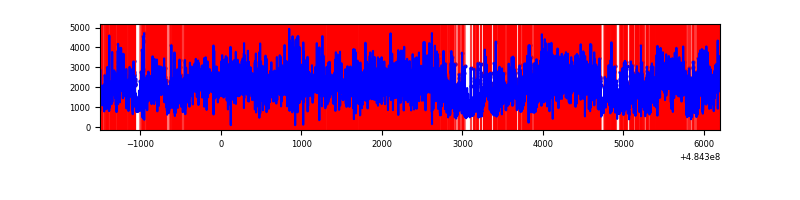 |
Top three noisy pixels from each quadrant. If the there are fewer than three noisy pixels in the level2.evt file, extra rows are filled as -1
| Pixel properties | Quadrant properties | ||||||
|---|---|---|---|---|---|---|---|
| Quadrant | DetID | PixID | Counts | Sigma | Mean | Median | Sigma |
| A | 7 | 64 | 1230804 | 6255.83 | 789 | 768 | 196.6 |
| A | 4 | 159 | 426466 | 2165.05 | 789 | 768 | 196.6 |
| A | 8 | 62 | 170552 | 863.5 | 789 | 768 | 196.6 |
| B | 12 | 32 | 9313995 | 80886.96 | 540 | 522 | 115.1 |
| B | 4 | 249 | 743198 | 6450.1 | 540 | 522 | 115.1 |
| B | 5 | 185 | 371352 | 3220.64 | 540 | 522 | 115.1 |
| C | 15 | 224 | 7235644 | 42142.14 | 613 | 606 | 171.7 |
| C | 15 | 132 | 1103708 | 6425.27 | 613 | 606 | 171.7 |
| C | 0 | 193 | 954768 | 5557.74 | 613 | 606 | 171.7 |
| D | 6 | 42 | 3189390 | 18604.1 | 605 | 578 | 171.4 |
| D | 7 | 126 | 2757292 | 16083.16 | 605 | 578 | 171.4 |
| D | 12 | 17 | 2264041 | 13205.45 | 605 | 578 | 171.4 |
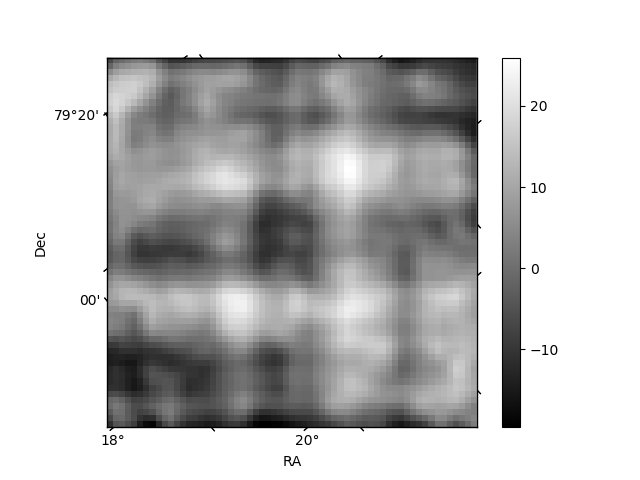
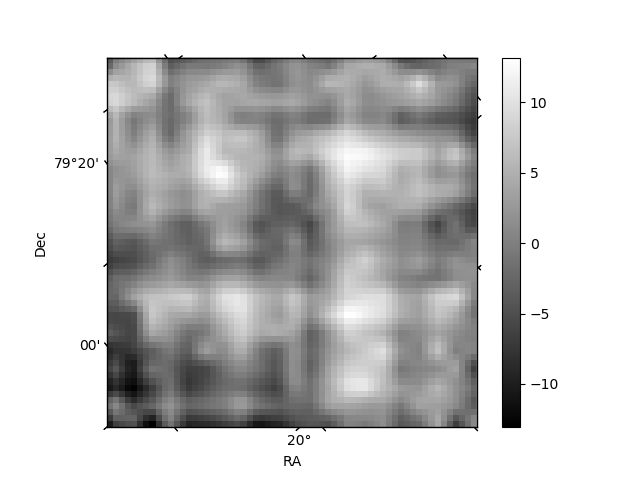
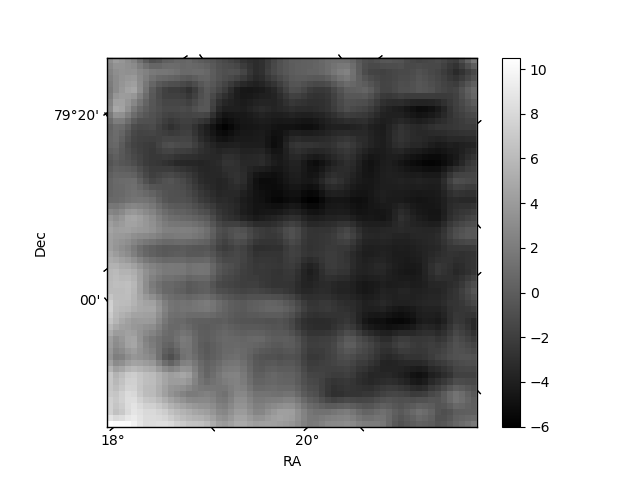
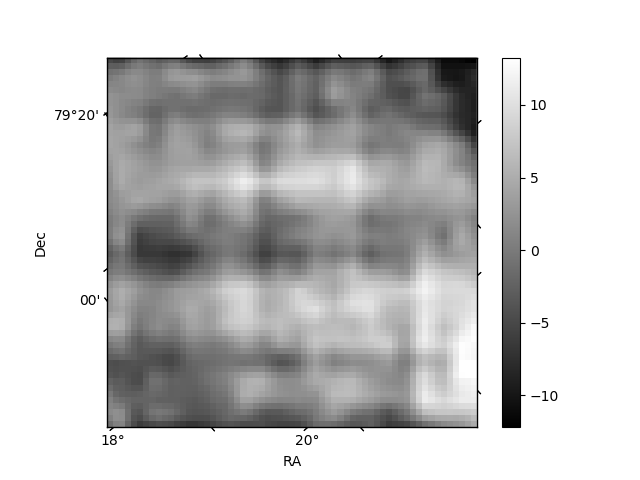
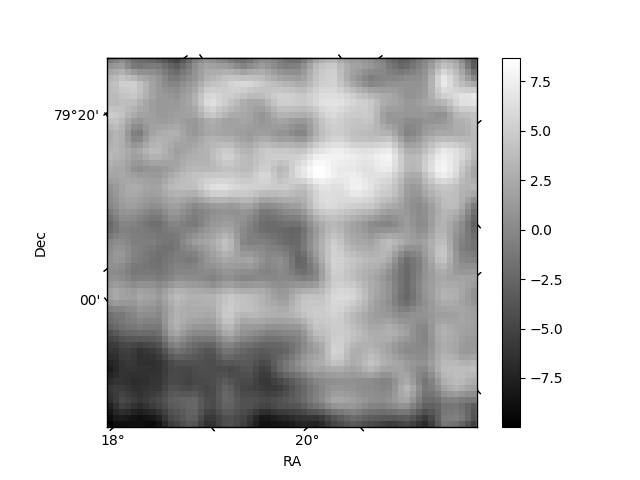
Histogram calculated using DETX and DETY for each event in the final _common_clean file
| Quadrant A | 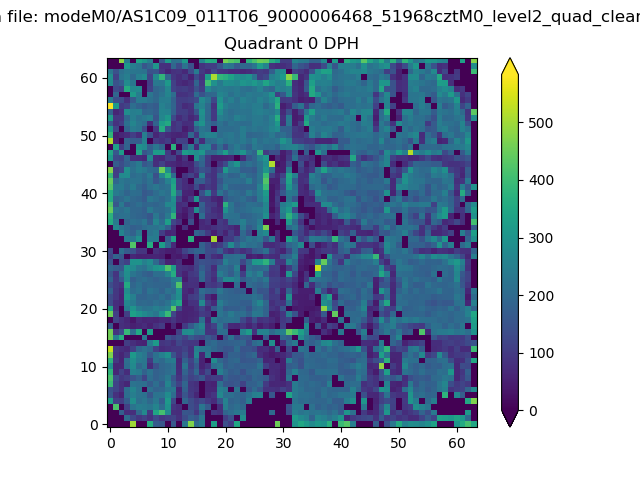 |
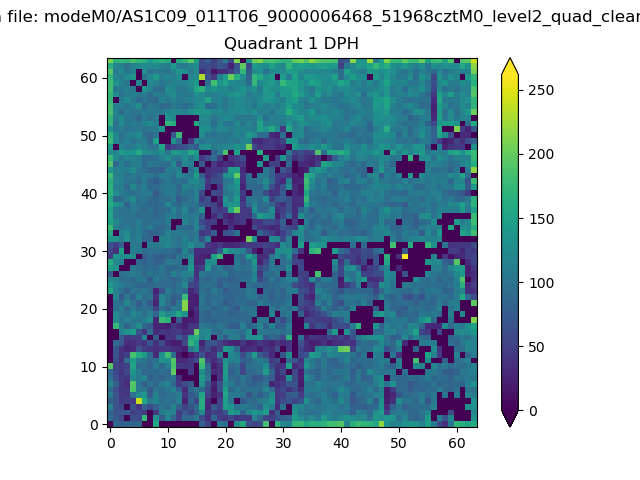 |
Quadrant B |
|---|---|---|---|
| Quadrant D | 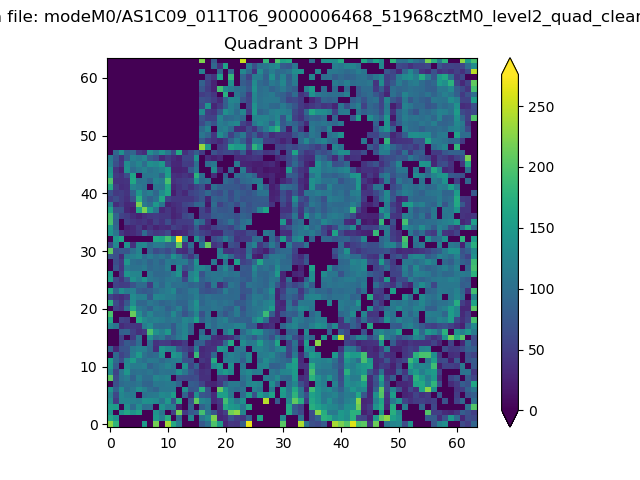 |
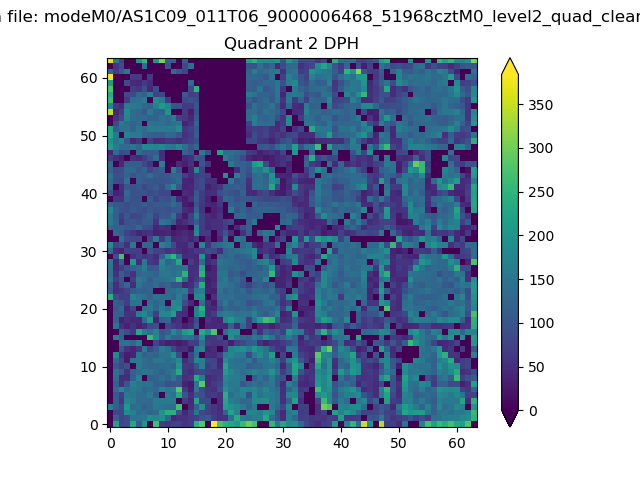 |
Quadrant C |
| Plot type | Count rate plots | Images |
|---|---|---|
| Comparison with Poisson distribution Blue bars denote a histogram of data divided into 1 sec bins. Red curve is a Poisson curve with rate = median count rate of data. |
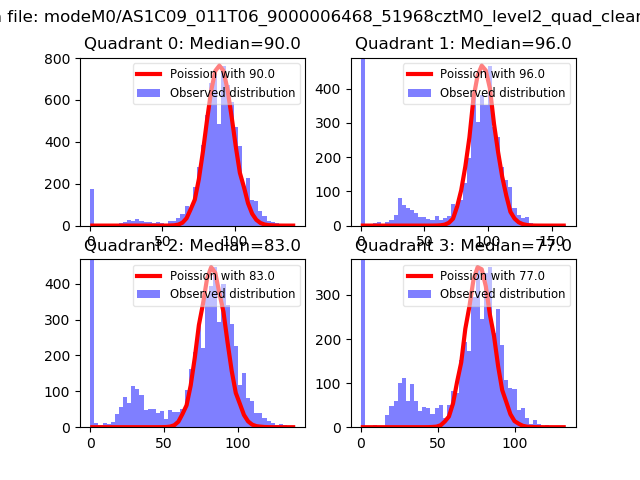 |
 |
| Quadrant-wise count rates Data is divided into 100 sec bins |
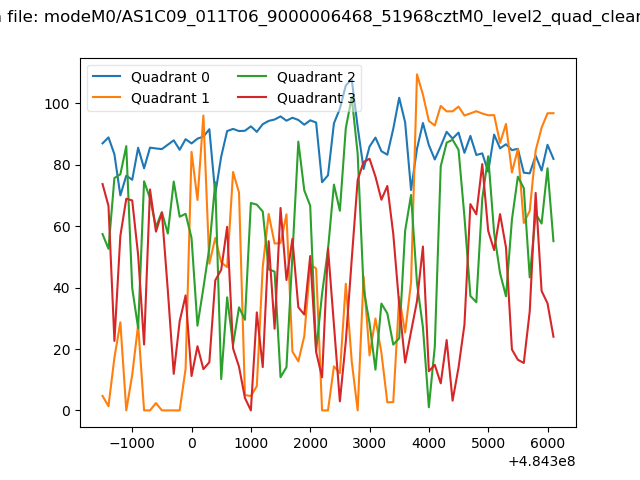 |
|
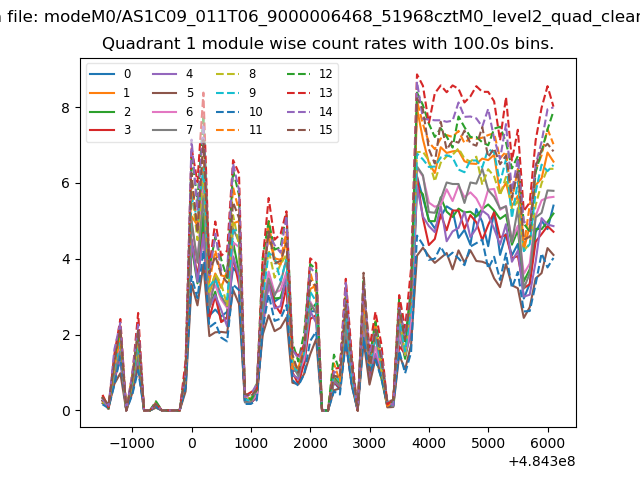
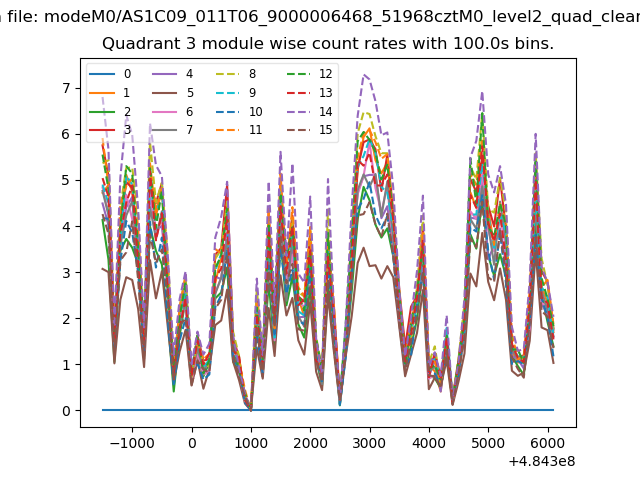
| Module-wise count rates for Quadrant A Data is divided into 100 sec bins |
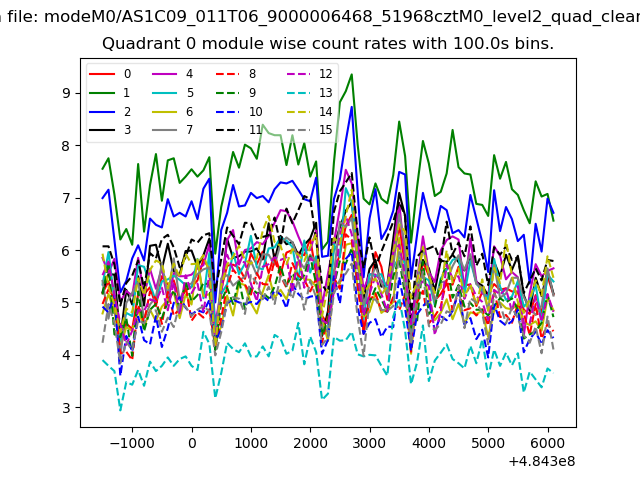 |
 |
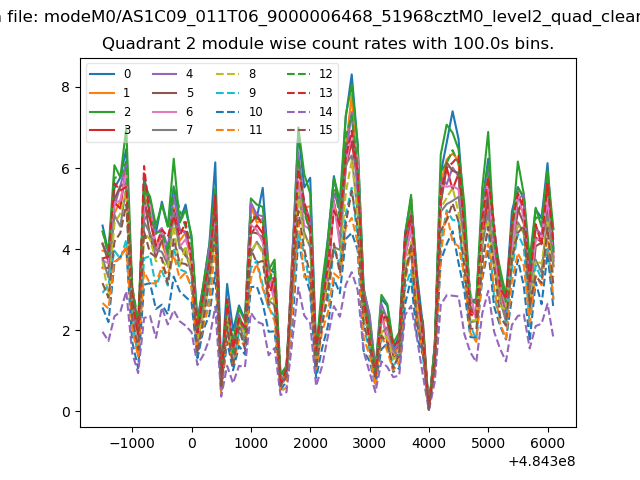
| Module-wise count rates for Quadrant B Data is divided into 100 sec bins |
 |
 |
| Module-wise count rates for Quadrant C Data is divided into 100 sec bins |
 |
 |
| Module-wise count rates for Quadrant D Data is divided into 100 sec bins |
 |
 |
| Parameter | Plot |
|---|---|
| CZT HV Monitor | 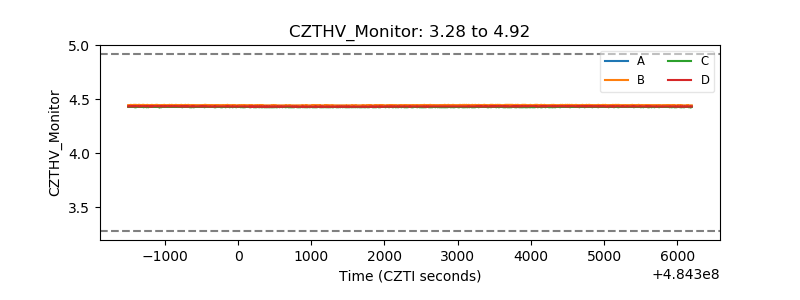 |
| D_VDD | 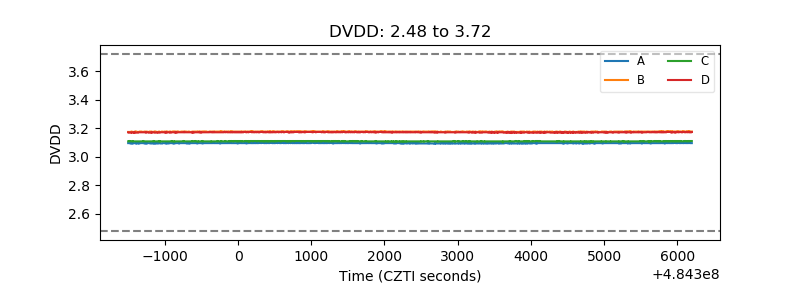 |
| Temperature 1 | 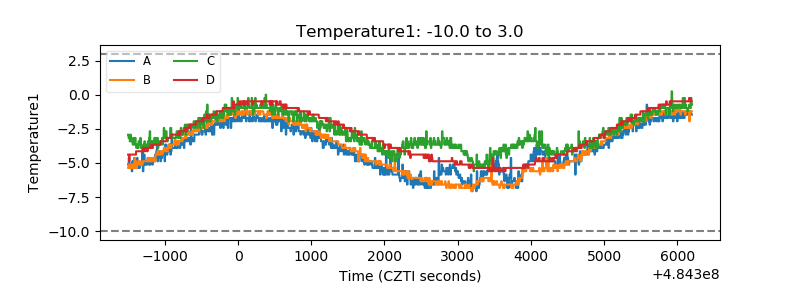 |
| Veto HV Monitor | 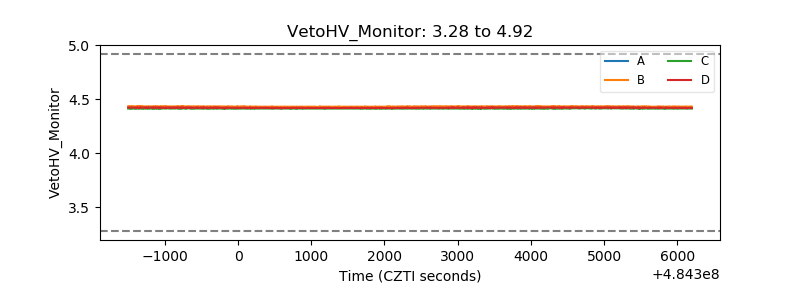 |
| Veto LLD | 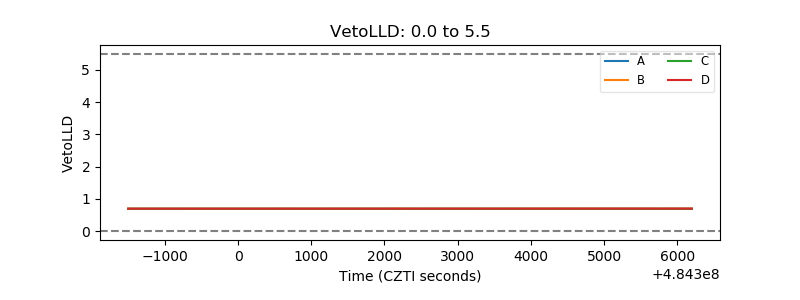 |
| Alpha Counter | 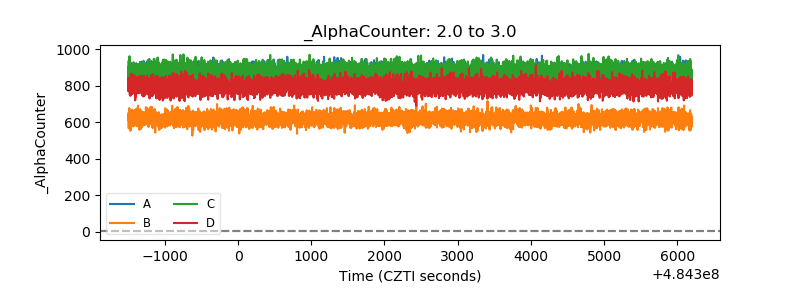 |
| _CPM_Rate | 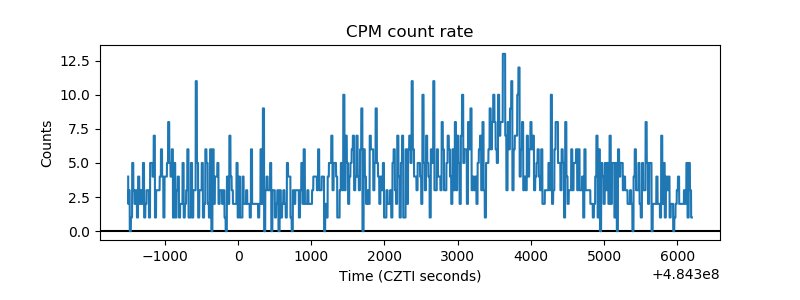 |
| CZT Counter | 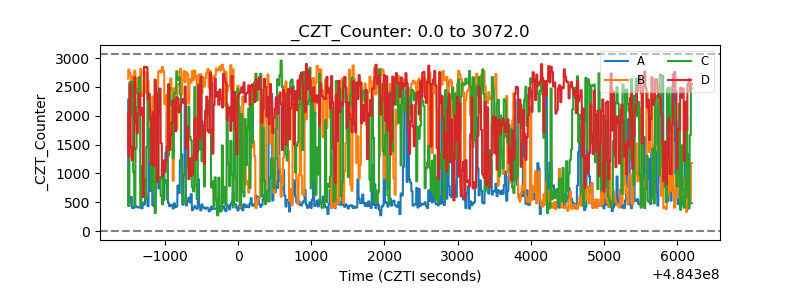 |
| +2.5 Volts monitor | 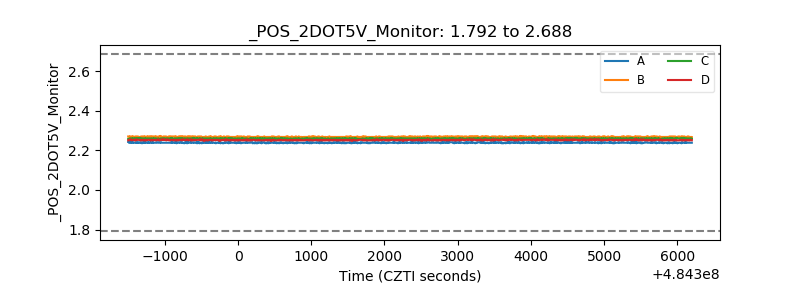 |
| +5 Volts monitor | 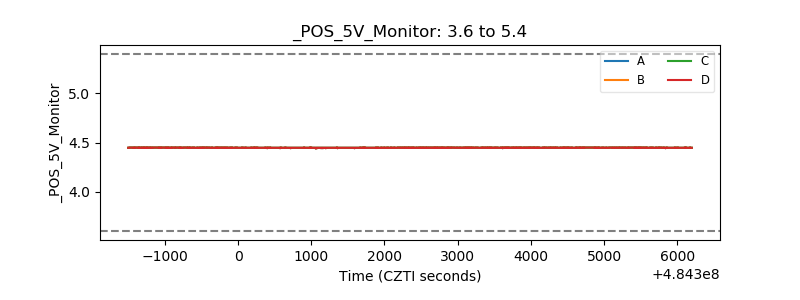 |
| _ROLL_ROT | 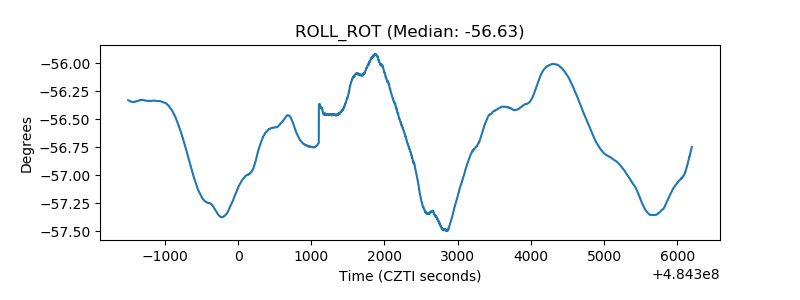 |
| _Roll_DEC | 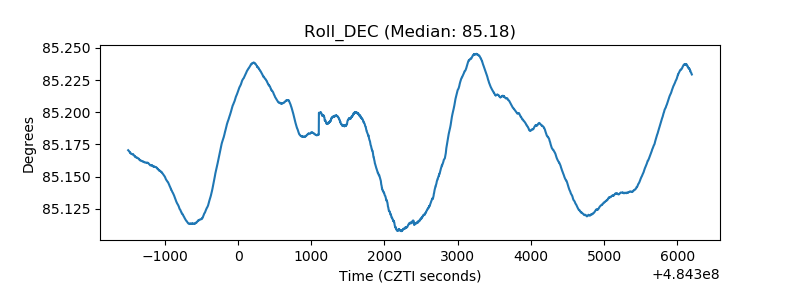 |
| _Roll_RA | 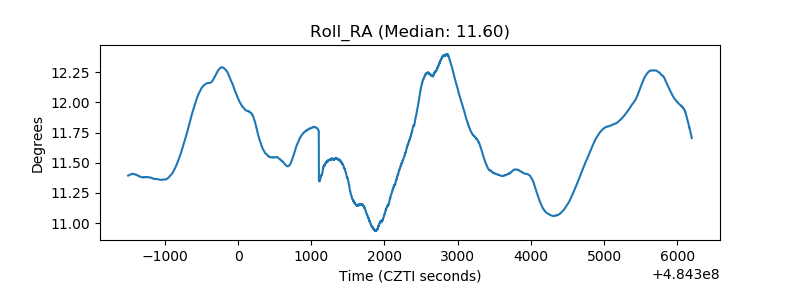 |
| Veto Counter | 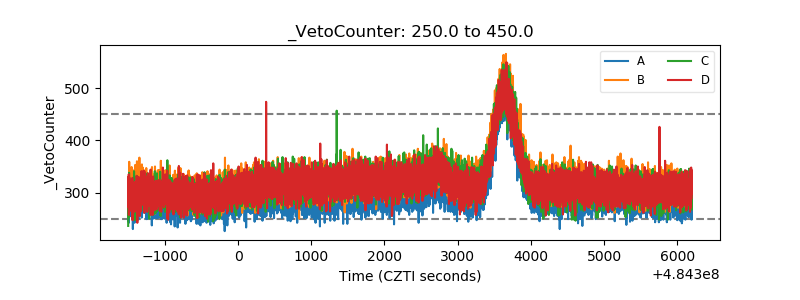 |