| Param | Original file | Final file |
|---|---|---|
| Filename | modeM0/AS1C09_011T06_9000006468_51976cztM0_level2.fits | modeM0/AS1C09_011T06_9000006468_51976cztM0_level2_quad_clean.evt |
| Size (bytes) | 737,743,680 | 92,741,760 |
| Size | 703.6 MB | 88.4 MB |
| Events in quadrant A | 5,112,109 | 612,955 |
| Events in quadrant B | 4,857,204 | 686,040 |
| Events in quadrant C | 9,187,476 | 487,665 |
| Events in quadrant D | 7,619,224 | 540,468 |
| Mode M0 | |||
|---|---|---|---|
| Quadrant | BADHDUFLAG | Total packets | Discarded packets |
| A | 0 | 20118 | 2 |
| B | 0 | 19212 | 2 |
| C | 0 | 32161 | 2 |
| D | 0 | 27436 | 2 |
| Mode M9 | |||
|---|---|---|---|
| Quadrant | BADHDUFLAG | Total packets | Discarded packets |
| A | 0 | 15 | 0 |
| B | 0 | 16 | 0 |
| C | 0 | 16 | 0 |
| D | 0 | 16 | 0 |
| Mode SS | |||
|---|---|---|---|
| Quadrant | BADHDUFLAG | Total packets | Discarded packets |
| A | 0 | 142 | 0 |
| B | 0 | 142 | 0 |
| C | 0 | 142 | 0 |
| D | 0 | 142 | 0 |
| Quadrant | Total seconds | Saturated seconds | Saturation percentage |
|---|---|---|---|
| A | 6891 | 456 | 6.617327% |
| B | 6891 | 305 | 4.426063% |
| C | 6891 | 1950 | 28.297780% |
| D | 6891 | 795 | 11.536787% |
Noise dominated data is calculated using 1-second bins in cleaned event files. If a bin has >2000 counts, and if more than 50% of those come from <1% of pixels, then it is considered to be noise-dominated and hence unusable.
| Quadrant | # 1 sec bins | Bins with >0 counts | Bins with >2000 counts | High rate bins dominated by noise | Noise dominated (total time) | Noise dominated (detector-on time) | Marked lightcurve |
|---|---|---|---|---|---|---|---|
| A | 7956 | 6893 | 364 | 364 | 4.58% | 5.28% | 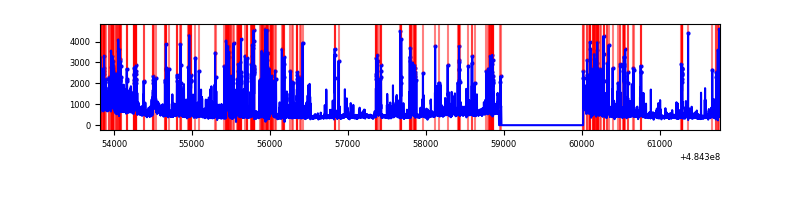 |
| B | 7956 | 6893 | 204 | 204 | 2.56% | 2.96% | 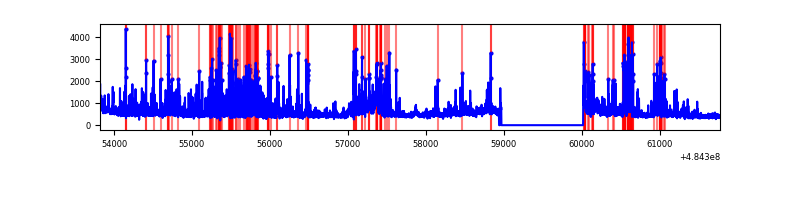 |
| C | 7956 | 6893 | 1570 | 1570 | 19.73% | 22.78% | 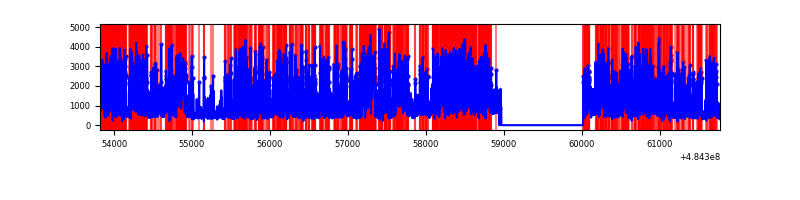 |
| D | 7956 | 6893 | 812 | 812 | 10.21% | 11.78% | 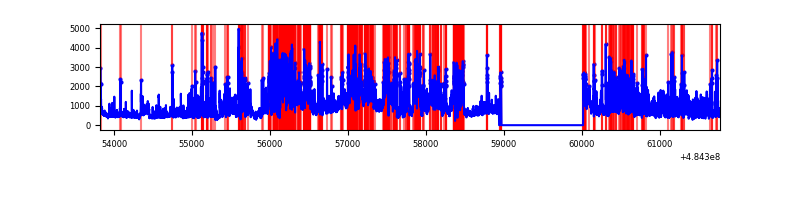 |
Top three noisy pixels from each quadrant. If the there are fewer than three noisy pixels in the level2.evt file, extra rows are filled as -1
| Pixel properties | Quadrant properties | ||||||
|---|---|---|---|---|---|---|---|
| Quadrant | DetID | PixID | Counts | Sigma | Mean | Median | Sigma |
| A | 7 | 64 | 1499023 | 8781.12 | 683 | 666 | 170.6 |
| A | 8 | 249 | 186483 | 1088.98 | 683 | 666 | 170.6 |
| A | 4 | 30 | 91396 | 531.72 | 683 | 666 | 170.6 |
| B | 8 | 128 | 1011829 | 6869.66 | 696 | 671 | 147.2 |
| B | 10 | 247 | 124873 | 843.81 | 696 | 671 | 147.2 |
| B | 10 | 44 | 113976 | 769.78 | 696 | 671 | 147.2 |
| C | 15 | 224 | 5414243 | 32111.28 | 608 | 603 | 168.6 |
| C | 4 | 5 | 670947 | 3976.18 | 608 | 603 | 168.6 |
| C | 13 | 3 | 318475 | 1885.47 | 608 | 603 | 168.6 |
| D | 2 | 172 | 1529892 | 8047.61 | 658 | 630 | 190.0 |
| D | 6 | 42 | 1481955 | 7795.35 | 658 | 630 | 190.0 |
| D | 8 | 176 | 346928 | 1822.36 | 658 | 630 | 190.0 |
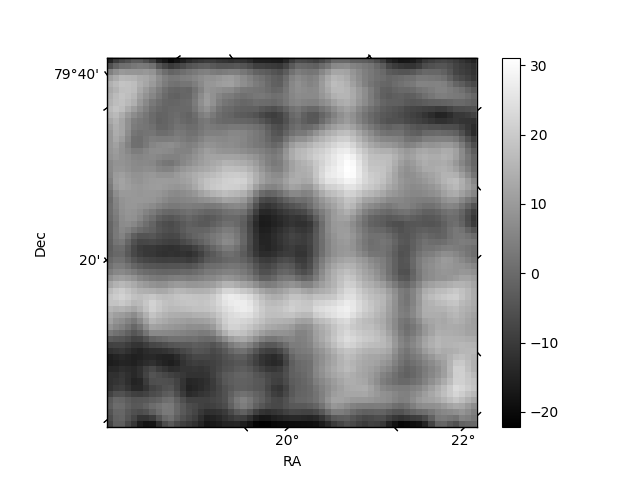
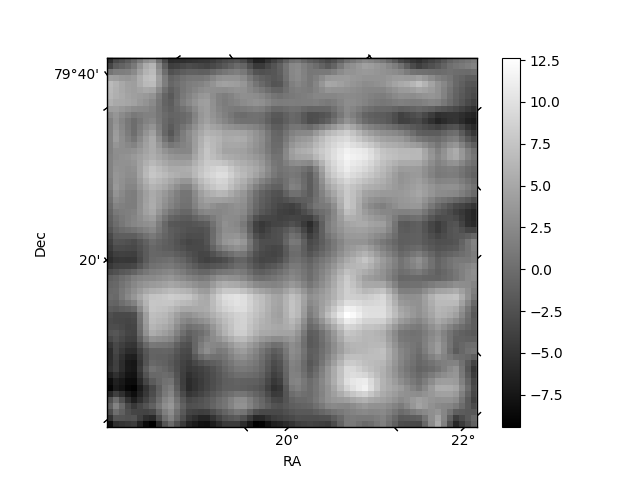
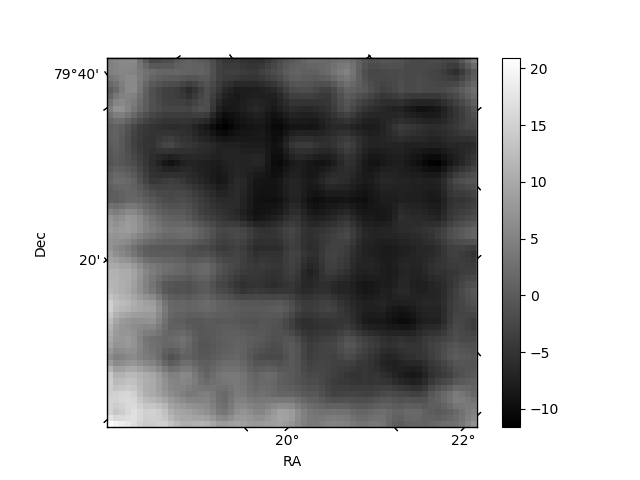
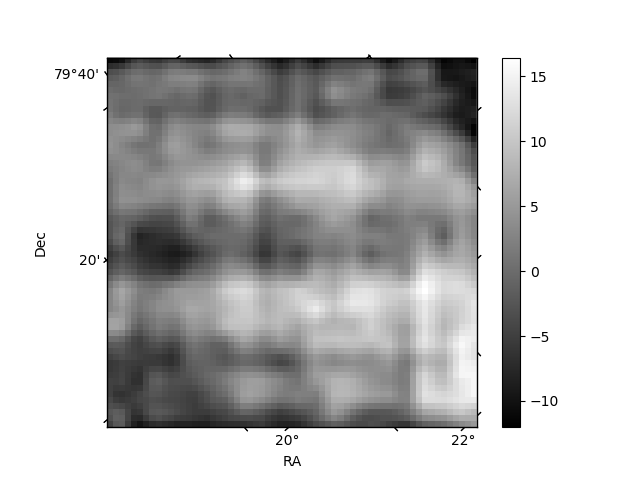
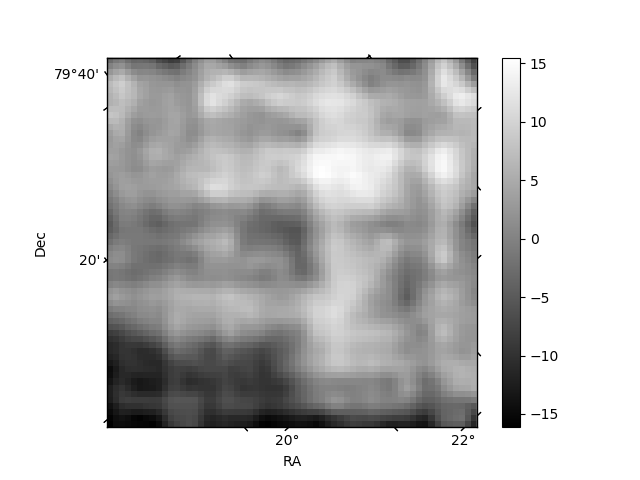
Histogram calculated using DETX and DETY for each event in the final _common_clean file
| Quadrant A | 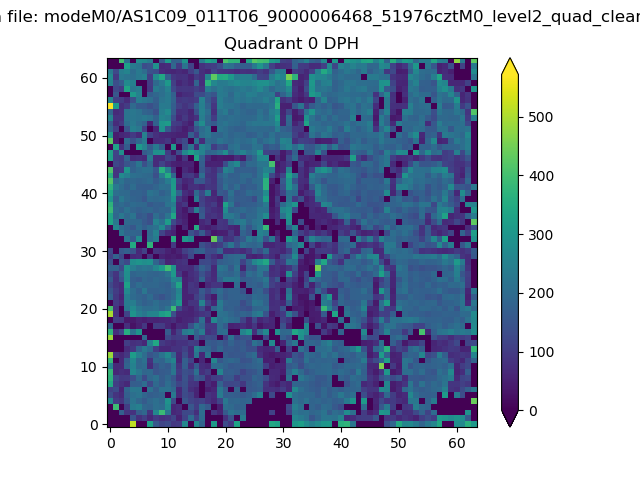 |
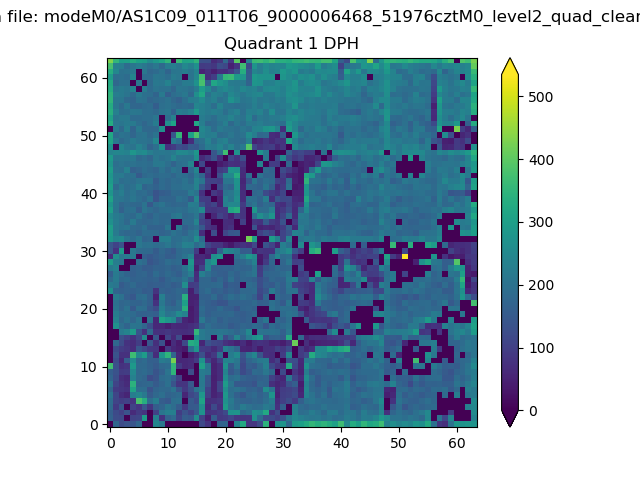 |
Quadrant B |
|---|---|---|---|
| Quadrant D | 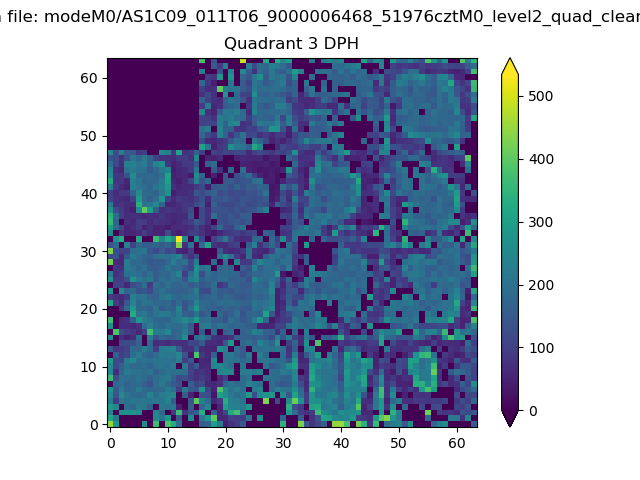 |
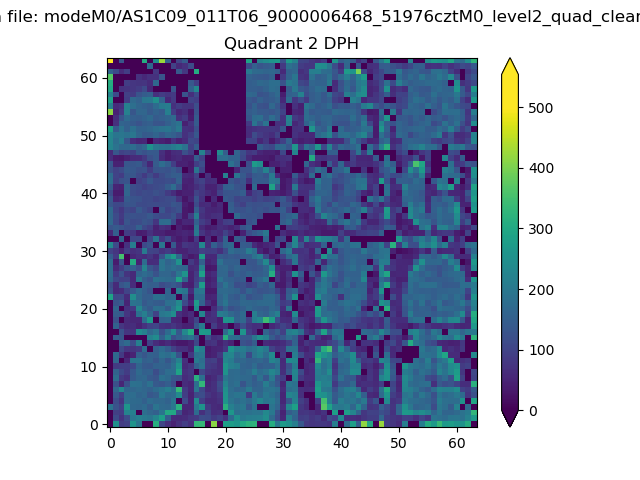 |
Quadrant C |
| Plot type | Count rate plots | Images |
|---|---|---|
| Comparison with Poisson distribution Blue bars denote a histogram of data divided into 1 sec bins. Red curve is a Poisson curve with rate = median count rate of data. |
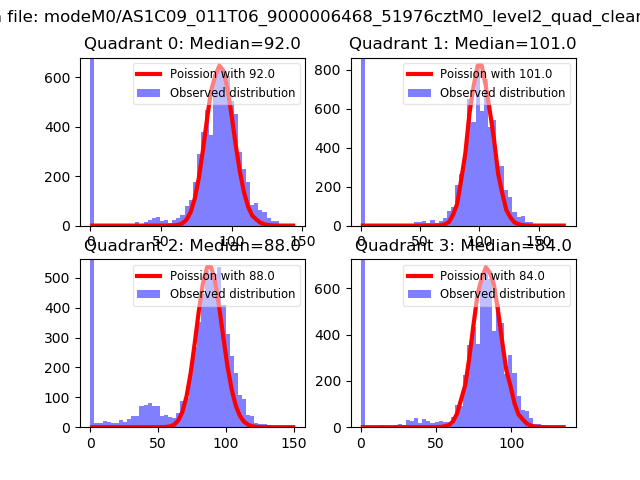 |
 |
| Quadrant-wise count rates Data is divided into 100 sec bins |
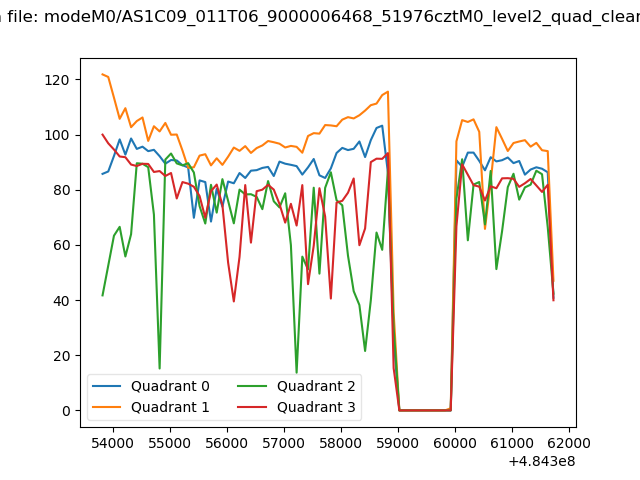 |
|
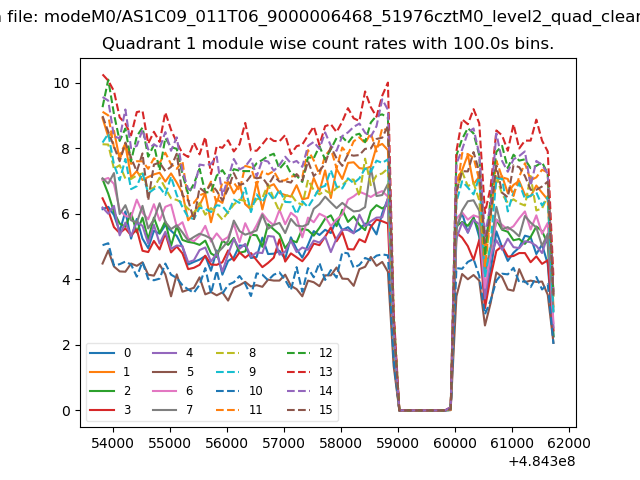
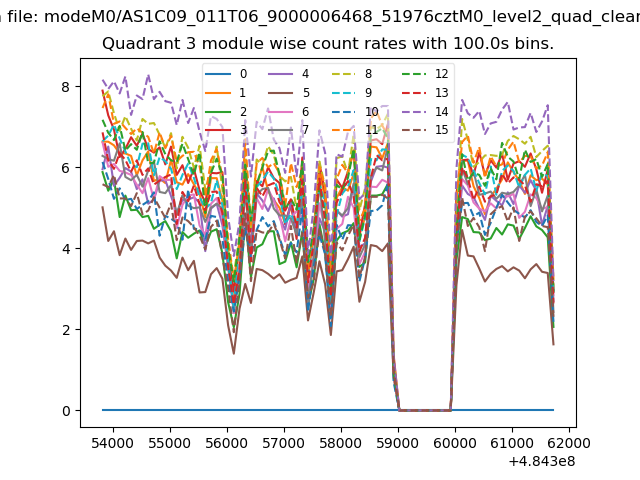
| Module-wise count rates for Quadrant A Data is divided into 100 sec bins |
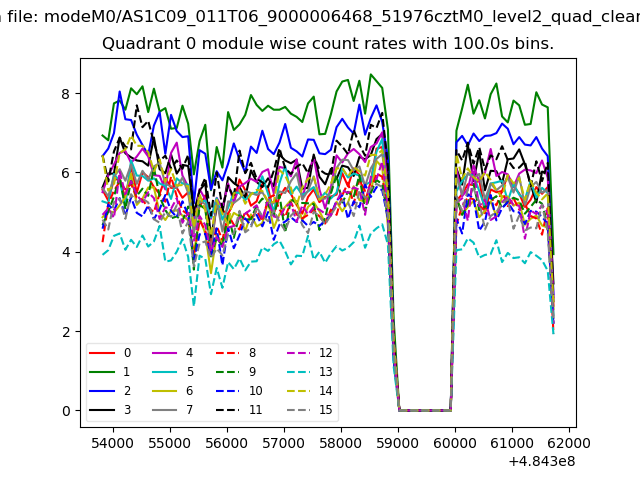 |
 |
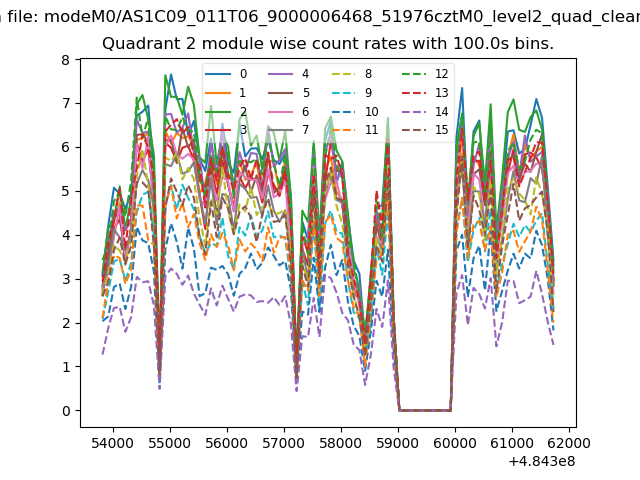
| Module-wise count rates for Quadrant B Data is divided into 100 sec bins |
 |
 |
| Module-wise count rates for Quadrant C Data is divided into 100 sec bins |
 |
 |
| Module-wise count rates for Quadrant D Data is divided into 100 sec bins |
 |
 |
| Parameter | Plot |
|---|---|
| CZT HV Monitor | 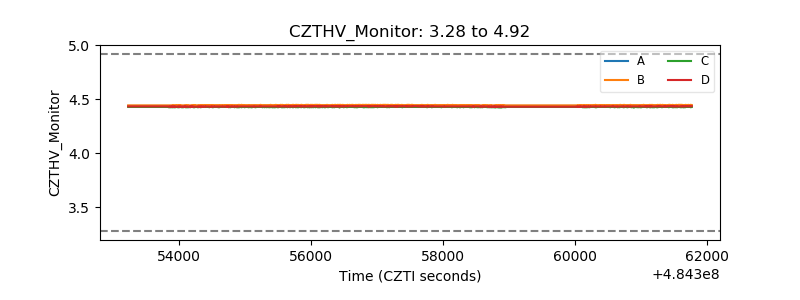 |
| D_VDD | 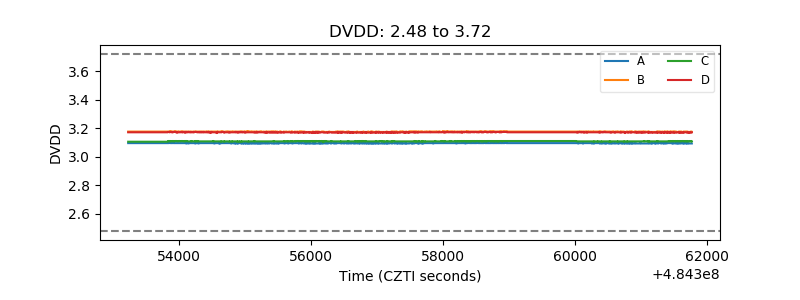 |
| Temperature 1 | 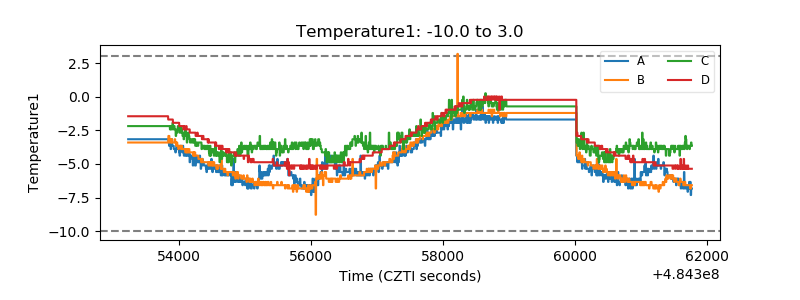 |
| Veto HV Monitor | 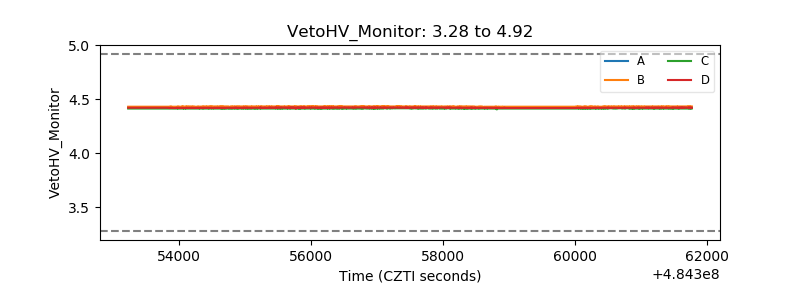 |
| Veto LLD | 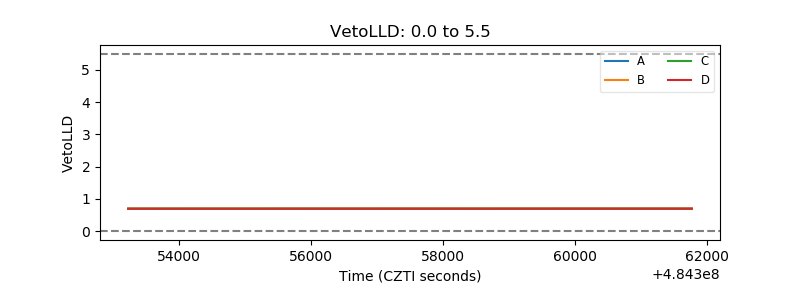 |
| Alpha Counter | 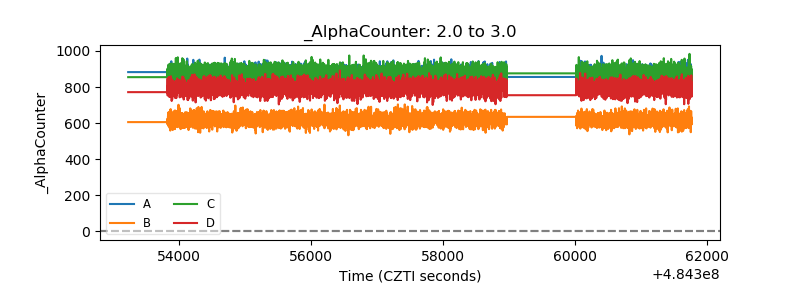 |
| _CPM_Rate | 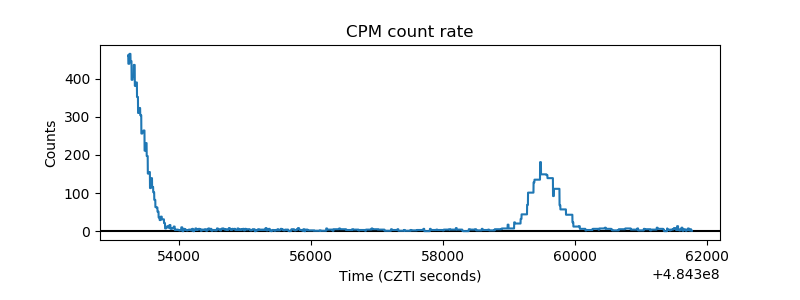 |
| CZT Counter | 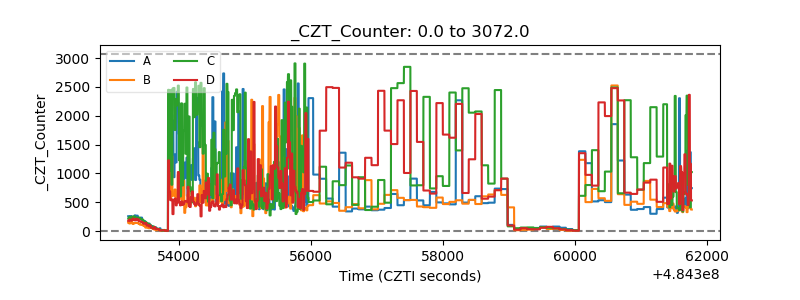 |
| +2.5 Volts monitor |  |
| +5 Volts monitor |  |
| _ROLL_ROT | 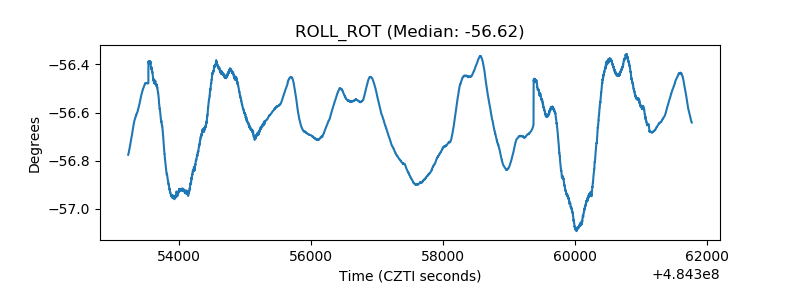 |
| _Roll_DEC | 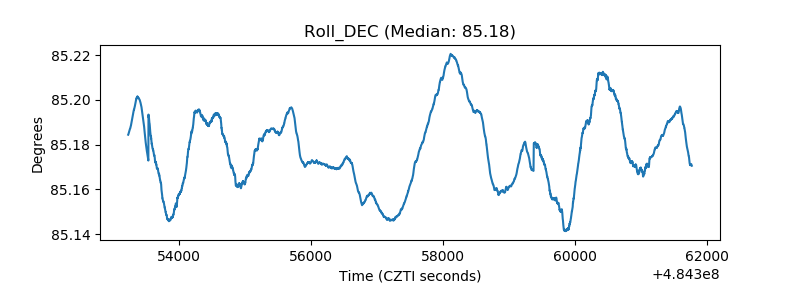 |
| _Roll_RA | 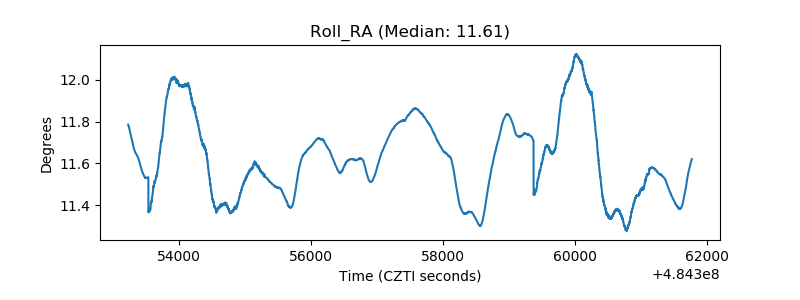 |
| Veto Counter | 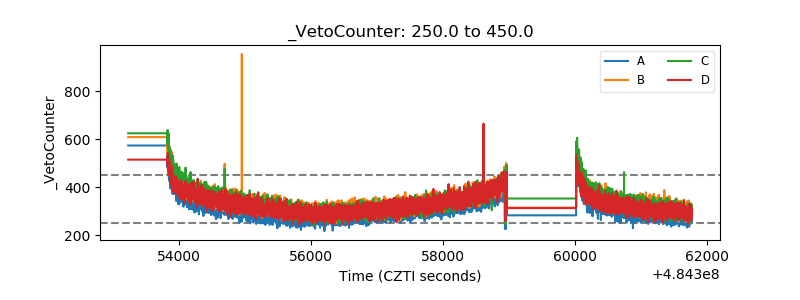 |