| Param | Original file | Final file |
|---|---|---|
| Filename | modeM0/AS1C09_011T06_9000006468_51978cztM0_level2.fits | modeM0/AS1C09_011T06_9000006468_51978cztM0_level2_quad_clean.evt |
| Size (bytes) | 939,836,160 | 88,528,320 |
| Size | 896.3 MB | 84.4 MB |
| Events in quadrant A | 4,983,123 | 654,115 |
| Events in quadrant B | 4,686,443 | 727,889 |
| Events in quadrant C | 8,398,743 | 568,129 |
| Events in quadrant D | 16,145,776 | 212,201 |
| Mode M0 | |||
|---|---|---|---|
| Quadrant | BADHDUFLAG | Total packets | Discarded packets |
| A | 0 | 20057 | 0 |
| B | 0 | 19322 | 0 |
| C | 0 | 30210 | 0 |
| D | 0 | 53071 | 0 |
| Mode SS | |||
|---|---|---|---|
| Quadrant | BADHDUFLAG | Total packets | Discarded packets |
| A | 0 | 148 | 0 |
| B | 0 | 148 | 0 |
| C | 0 | 148 | 0 |
| D | 0 | 148 | 0 |
| Quadrant | Total seconds | Saturated seconds | Saturation percentage |
|---|---|---|---|
| A | 7439 | 409 | 5.498051% |
| B | 7440 | 251 | 3.373656% |
| C | 7440 | 1435 | 19.287634% |
| D | 7440 | 5296 | 71.182796% |
Noise dominated data is calculated using 1-second bins in cleaned event files. If a bin has >2000 counts, and if more than 50% of those come from <1% of pixels, then it is considered to be noise-dominated and hence unusable.
| Quadrant | # 1 sec bins | Bins with >0 counts | Bins with >2000 counts | High rate bins dominated by noise | Noise dominated (total time) | Noise dominated (detector-on time) | Marked lightcurve |
|---|---|---|---|---|---|---|---|
| A | 7442 | 7442 | 305 | 305 | 4.10% | 4.10% | 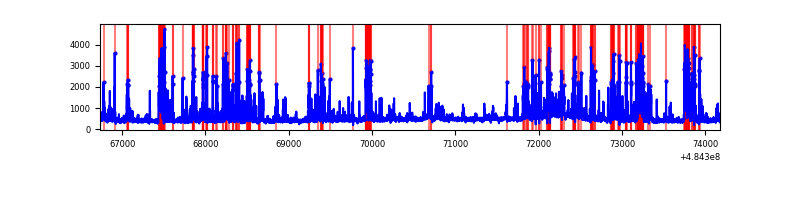 |
| B | 7443 | 7443 | 133 | 133 | 1.79% | 1.79% | 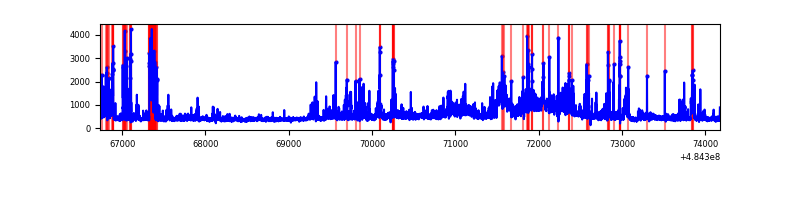 |
| C | 7443 | 7443 | 1198 | 1198 | 16.10% | 16.10% | 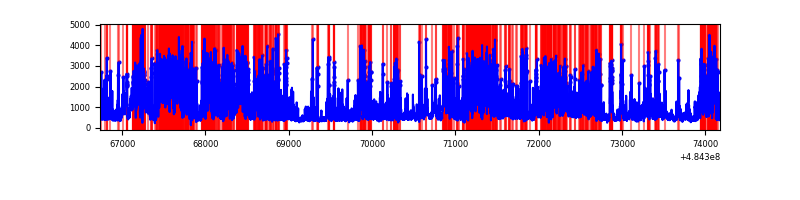 |
| D | 7442 | 7442 | 4666 | 4666 | 62.70% | 62.70% | 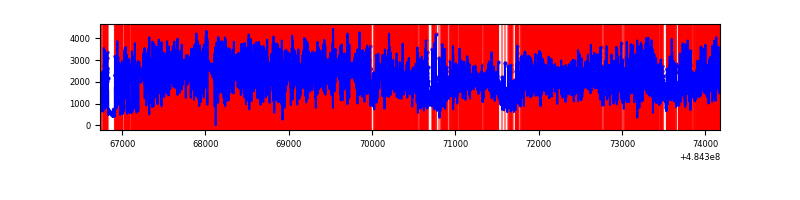 |
Top three noisy pixels from each quadrant. If the there are fewer than three noisy pixels in the level2.evt file, extra rows are filled as -1
| Pixel properties | Quadrant properties | ||||||
|---|---|---|---|---|---|---|---|
| Quadrant | DetID | PixID | Counts | Sigma | Mean | Median | Sigma |
| A | 7 | 64 | 1446020 | 7762.86 | 747 | 728 | 186.2 |
| A | 5 | 240 | 103372 | 551.31 | 747 | 728 | 186.2 |
| A | 4 | 3 | 78897 | 419.86 | 747 | 728 | 186.2 |
| B | 10 | 44 | 288121 | 1788.74 | 758 | 732 | 160.7 |
| B | 4 | 206 | 270470 | 1678.88 | 758 | 732 | 160.7 |
| B | 8 | 128 | 218972 | 1358.35 | 758 | 732 | 160.7 |
| C | 15 | 224 | 4020133 | 20935.43 | 692 | 685 | 192.0 |
| C | 12 | 252 | 1028428 | 5353.03 | 692 | 685 | 192.0 |
| C | 13 | 3 | 272579 | 1416.17 | 692 | 685 | 192.0 |
| D | 2 | 172 | 8870250 | 60352.43 | 515 | 492 | 147.0 |
| D | 6 | 42 | 1847768 | 12569.41 | 515 | 492 | 147.0 |
| D | 8 | 176 | 1483217 | 10088.89 | 515 | 492 | 147.0 |
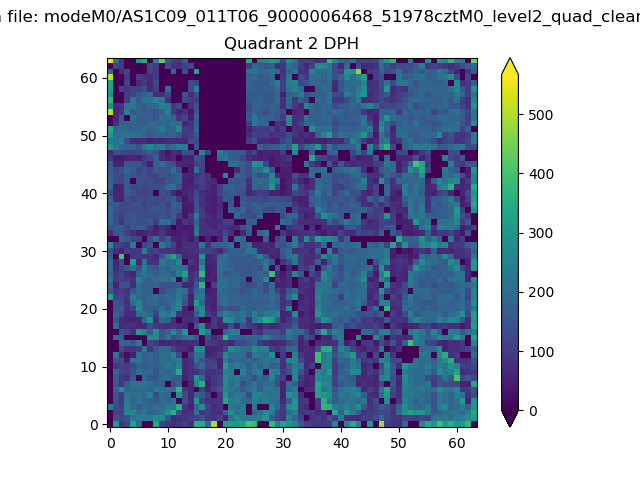
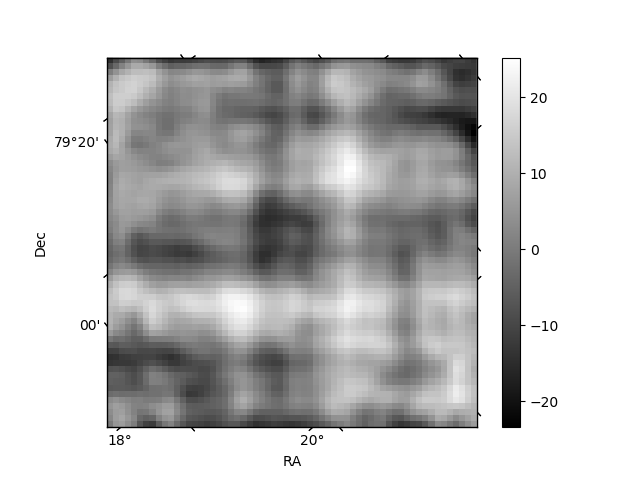
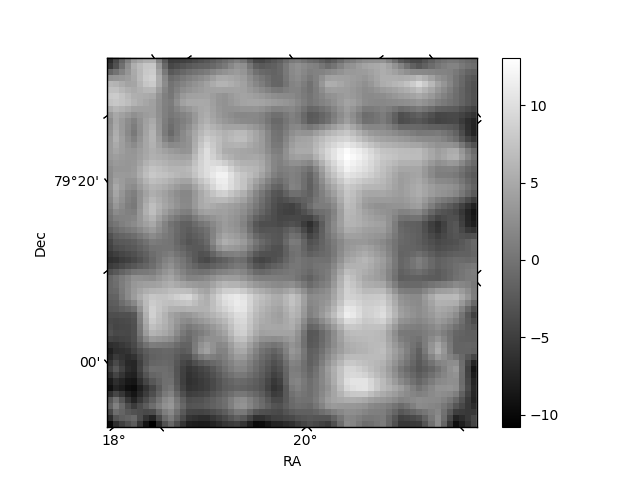
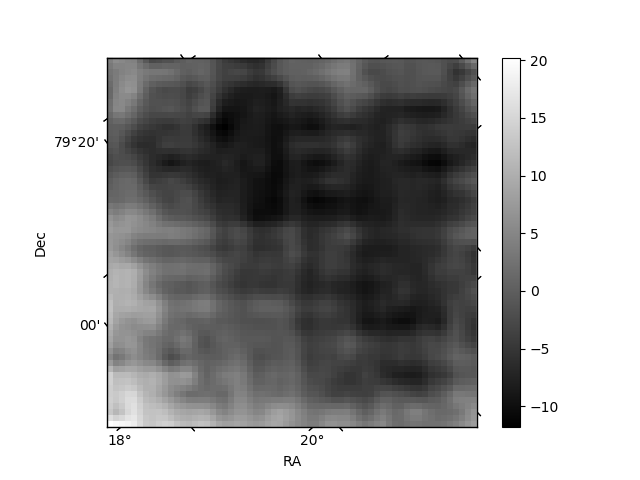
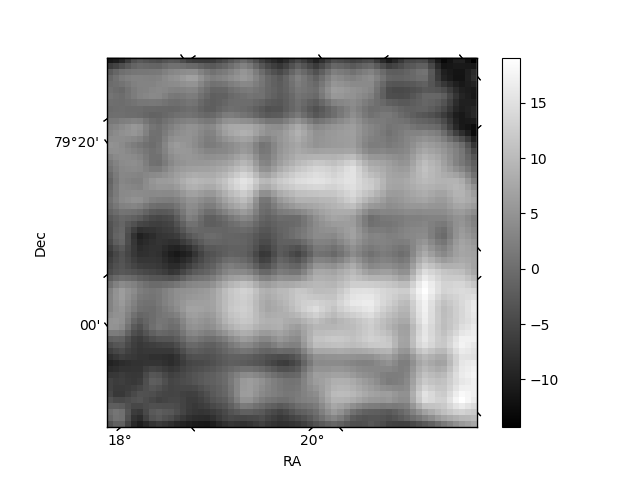
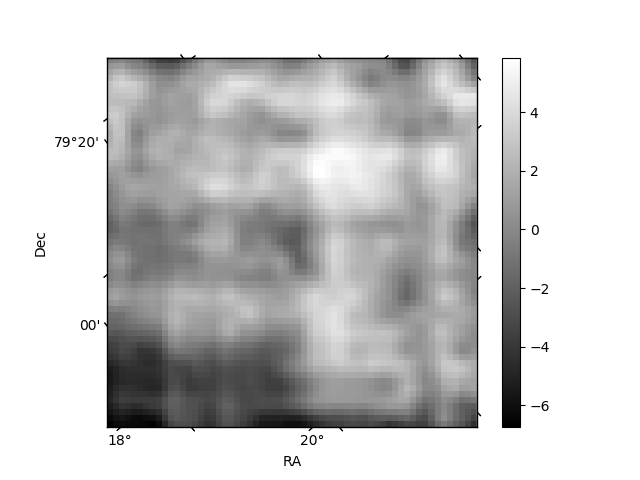
Histogram calculated using DETX and DETY for each event in the final _common_clean file
| Quadrant A | 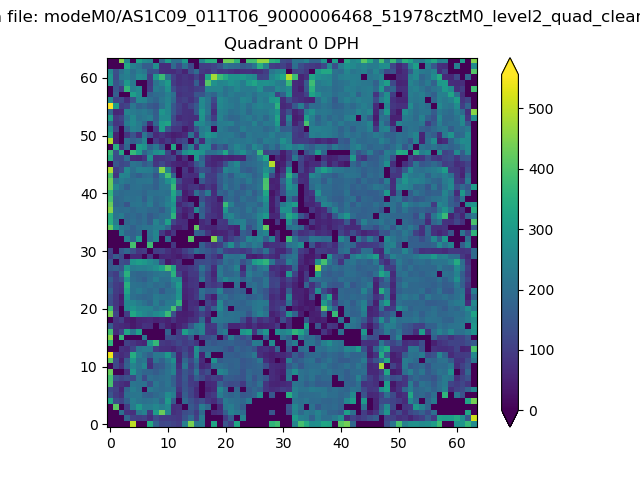 |
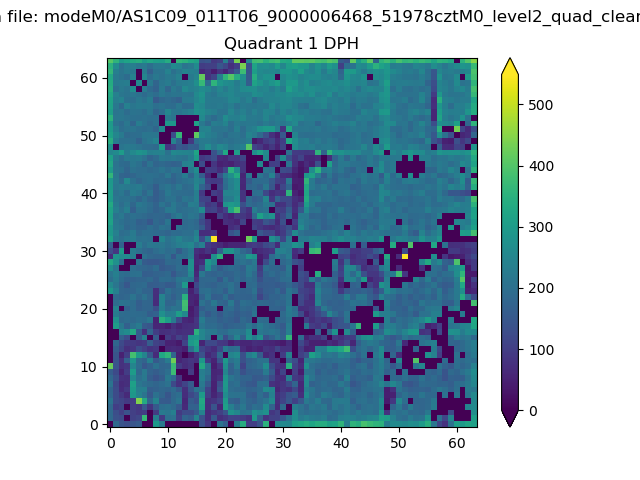 |
Quadrant B |
|---|---|---|---|
| Quadrant D | 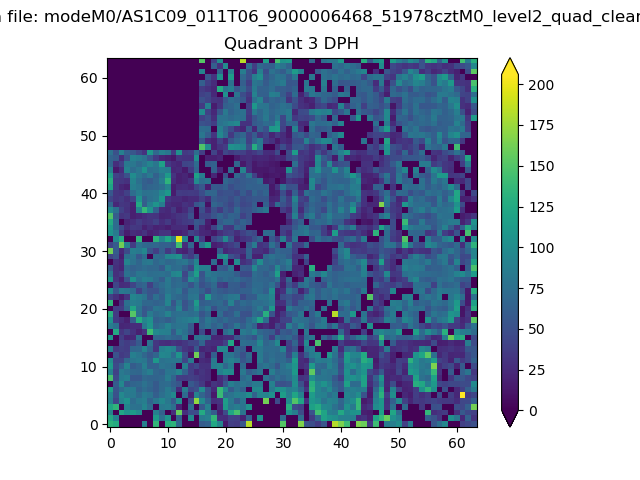 |
 |
Quadrant C |
| Plot type | Count rate plots | Images |
|---|---|---|
| Comparison with Poisson distribution Blue bars denote a histogram of data divided into 1 sec bins. Red curve is a Poisson curve with rate = median count rate of data. |
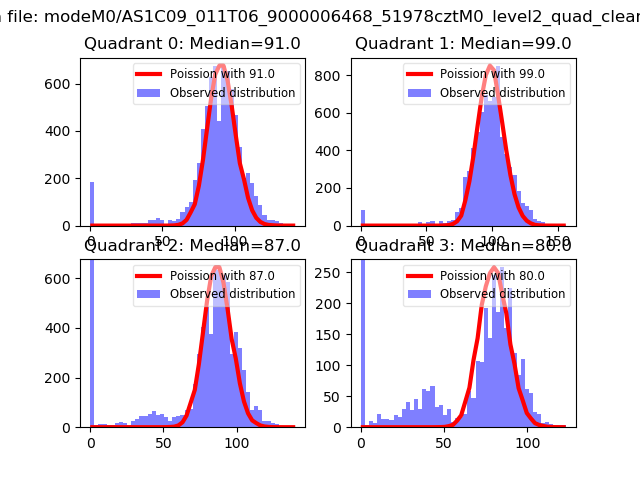 |
 |
| Quadrant-wise count rates Data is divided into 100 sec bins |
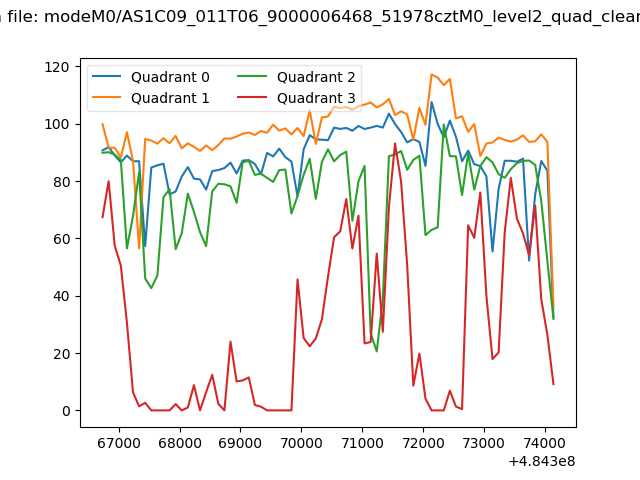 |
|
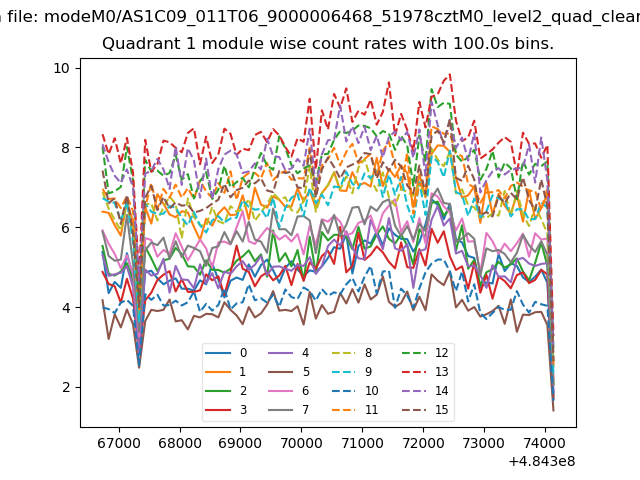
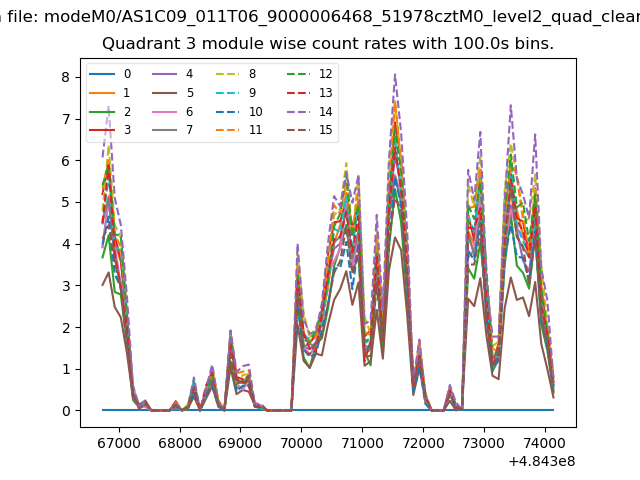
| Module-wise count rates for Quadrant A Data is divided into 100 sec bins |
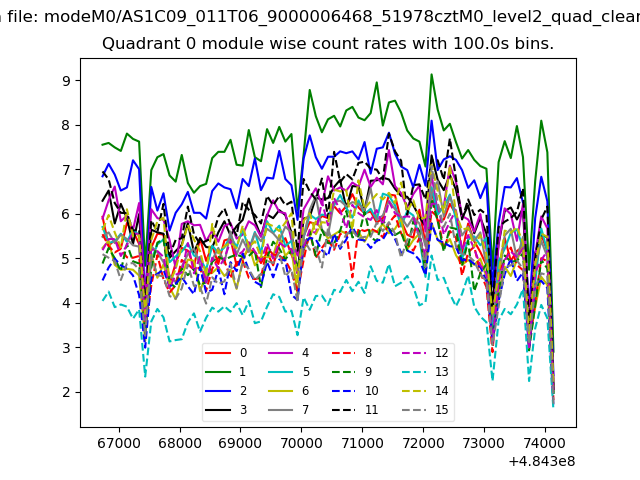 |
 |
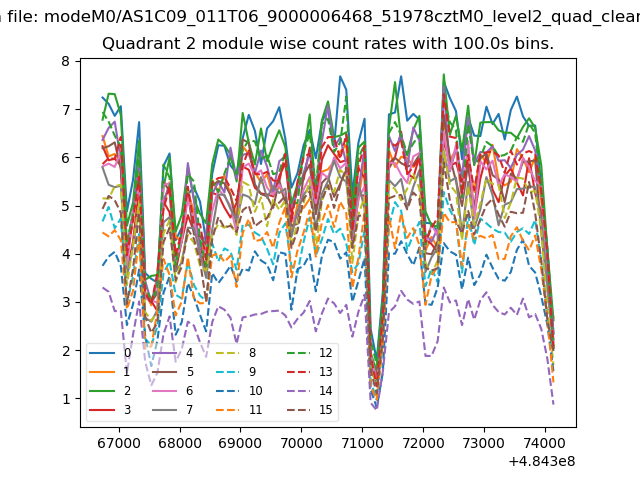
| Module-wise count rates for Quadrant B Data is divided into 100 sec bins |
 |
 |
| Module-wise count rates for Quadrant C Data is divided into 100 sec bins |
 |
 |
| Module-wise count rates for Quadrant D Data is divided into 100 sec bins |
 |
 |
| Parameter | Plot |
|---|---|
| CZT HV Monitor | 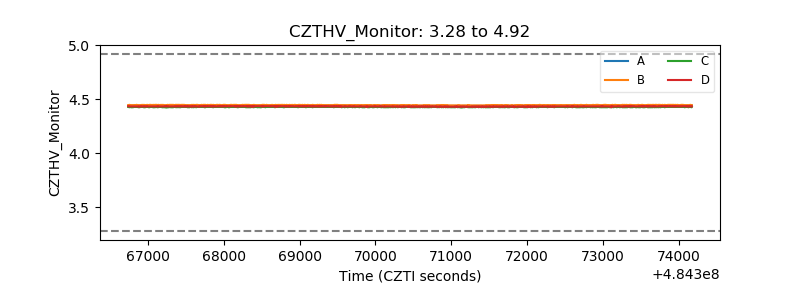 |
| D_VDD | 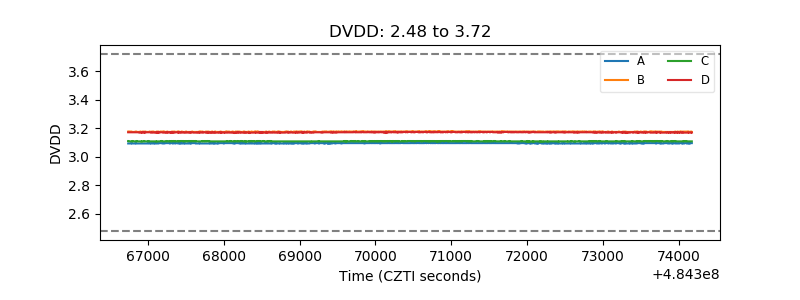 |
| Temperature 1 | 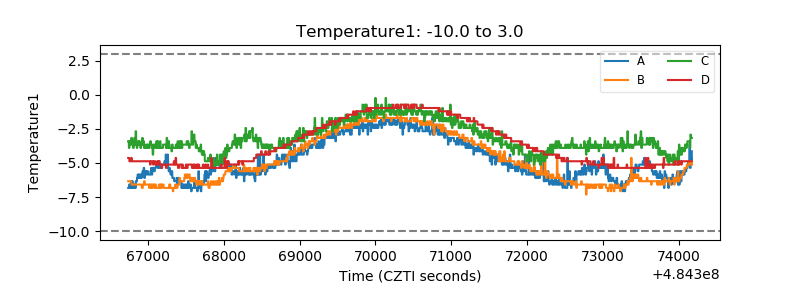 |
| Veto HV Monitor |  |
| Veto LLD | 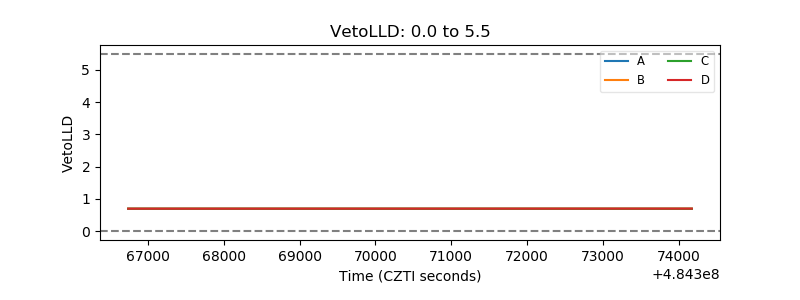 |
| Alpha Counter | 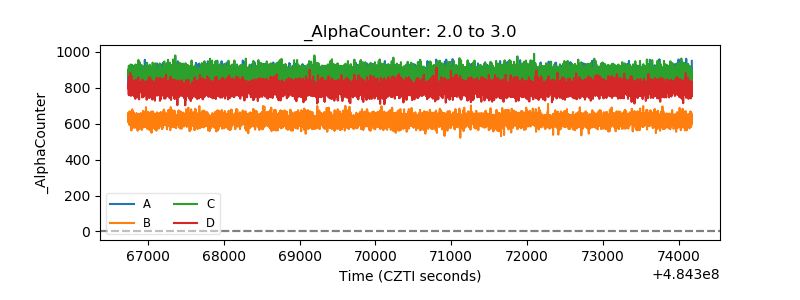 |
| _CPM_Rate | 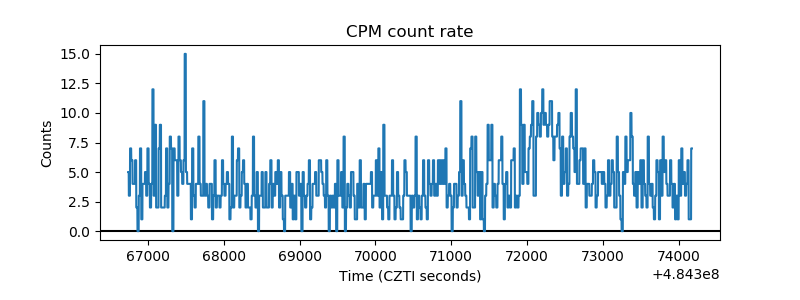 |
| CZT Counter | 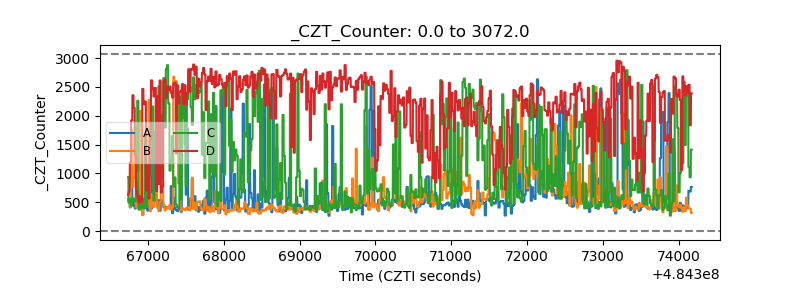 |
| +2.5 Volts monitor | 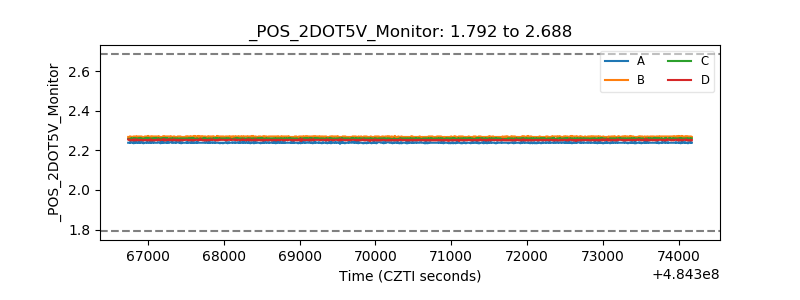 |
| +5 Volts monitor | 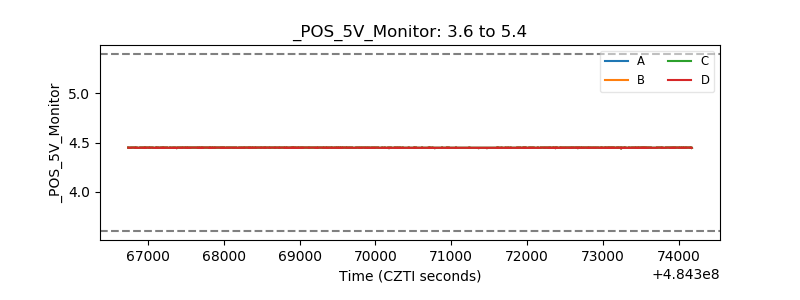 |
| _ROLL_ROT | 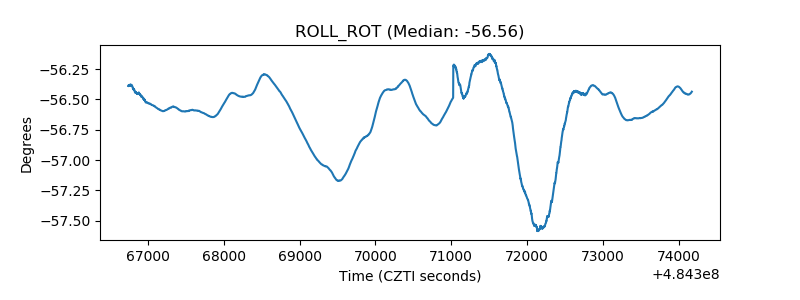 |
| _Roll_DEC | 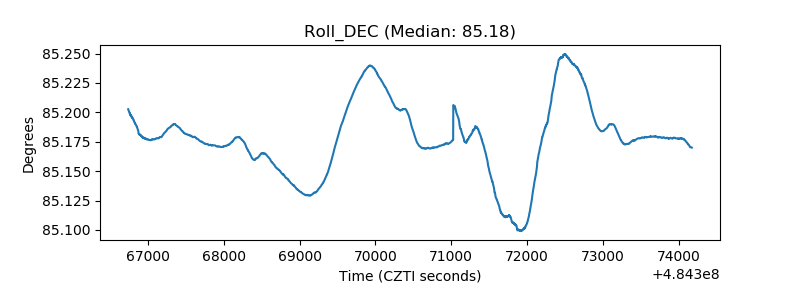 |
| _Roll_RA | 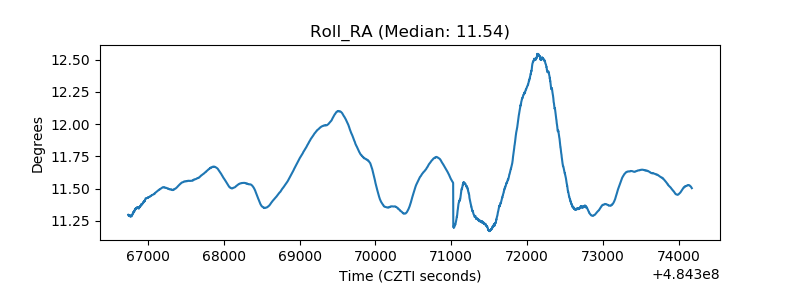 |
| Veto Counter | 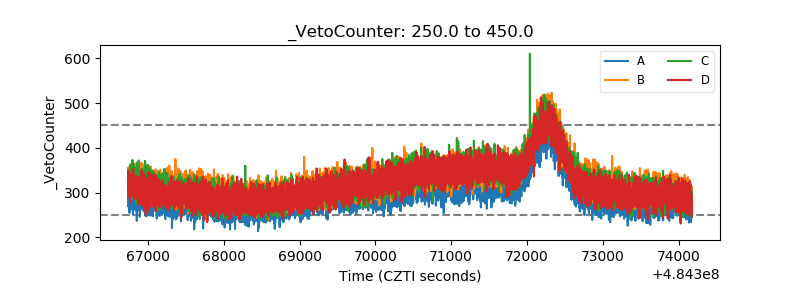 |