| Param | Original file | Final file |
|---|---|---|
| Filename | modeM0/AS1C09_011T07_9000006470_52105cztM0_level2.fits | modeM0/AS1C09_011T07_9000006470_52105cztM0_level2_quad_clean.evt |
| Size (bytes) | 917,360,640 | 62,896,320 |
| Size | 874.9 MB | 60.0 MB |
| Events in quadrant A | 3,020,604 | 574,722 |
| Events in quadrant B | 4,248,310 | 591,287 |
| Events in quadrant C | 11,711,304 | 258,137 |
| Events in quadrant D | 14,529,011 | 74,192 |
| Mode SS | |||
|---|---|---|---|
| Quadrant | BADHDUFLAG | Total packets | Discarded packets |
| A | 0 | 118 | 0 |
| B | 0 | 118 | 0 |
| C | 0 | 118 | 0 |
| D | 0 | 118 | 0 |
| Mode M9 | |||
|---|---|---|---|
| Quadrant | BADHDUFLAG | Total packets | Discarded packets |
| A | 0 | 12 | 0 |
| B | 0 | 12 | 0 |
| C | 0 | 12 | 0 |
| D | 0 | 12 | 0 |
| Mode M0 | |||
|---|---|---|---|
| Quadrant | BADHDUFLAG | Total packets | Discarded packets |
| A | 0 | 12877 | 1 |
| B | 0 | 16531 | 1 |
| C | 0 | 38767 | 1 |
| D | 0 | 47145 | 7 |
| Quadrant | Total seconds | Saturated seconds | Saturation percentage |
|---|---|---|---|
| A | 5802 | 97 | 1.671837% |
| B | 5803 | 403 | 6.944684% |
| C | 5803 | 3523 | 60.709978% |
| D | 5802 | 5146 | 88.693554% |
Noise dominated data is calculated using 1-second bins in cleaned event files. If a bin has >2000 counts, and if more than 50% of those come from <1% of pixels, then it is considered to be noise-dominated and hence unusable.
| Quadrant | # 1 sec bins | Bins with >0 counts | Bins with >2000 counts | High rate bins dominated by noise | Noise dominated (total time) | Noise dominated (detector-on time) | Marked lightcurve |
|---|---|---|---|---|---|---|---|
| A | 6987 | 5803 | 31 | 31 | 0.44% | 0.53% | 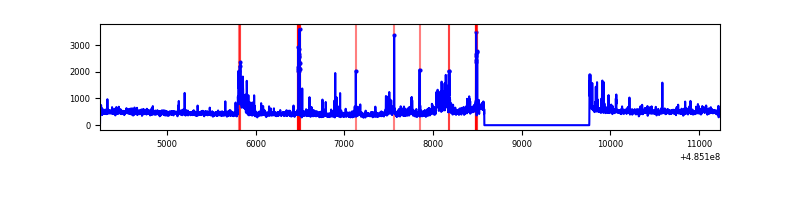 |
| B | 6988 | 5804 | 214 | 214 | 3.06% | 3.69% | 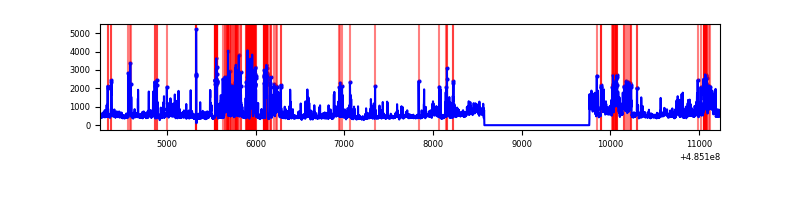 |
| C | 6988 | 5804 | 2963 | 2963 | 42.40% | 51.05% | 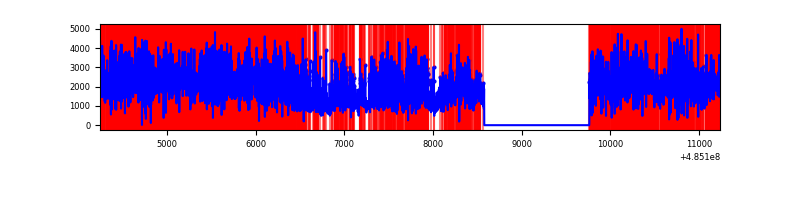 |
| D | 6987 | 5803 | 5095 | 5095 | 72.92% | 87.80% | 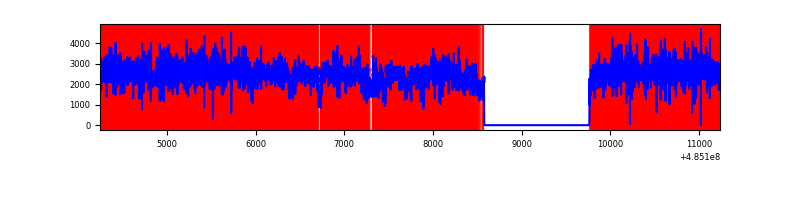 |
Top three noisy pixels from each quadrant. If the there are fewer than three noisy pixels in the level2.evt file, extra rows are filled as -1
| Pixel properties | Quadrant properties | ||||||
|---|---|---|---|---|---|---|---|
| Quadrant | DetID | PixID | Counts | Sigma | Mean | Median | Sigma |
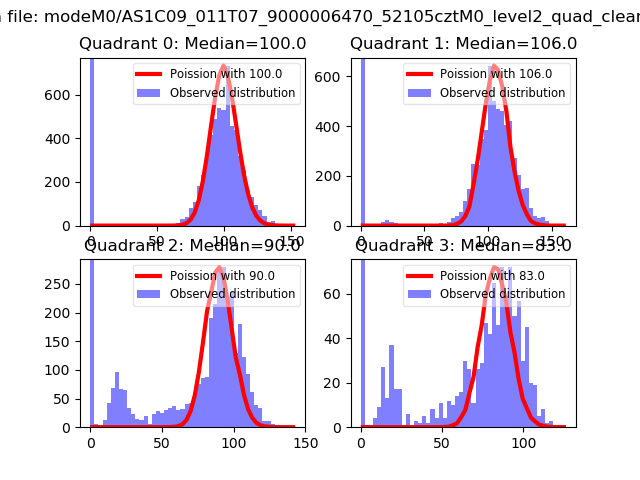
| A | 8 | 43 | 204984 | 1346.57 | 620 | 607 | 151.8 |
| A | 4 | 3 | 112994 | 740.48 | 620 | 607 | 151.8 |
| A | 13 | 248 | 44450 | 288.87 | 620 | 607 | 151.8 |
| B | 8 | 3 | 701920 | 5539.44 | 608 | 589 | 126.6 |
| B | 10 | 44 | 291412 | 2297.06 | 608 | 589 | 126.6 |
| B | 4 | 171 | 143220 | 1126.57 | 608 | 589 | 126.6 |
| C | 5 | 80 | 4687681 | 37606.26 | 450 | 445 | 124.6 |
| C | 15 | 224 | 3063465 | 24574.98 | 450 | 445 | 124.6 |
| C | 10 | 171 | 585200 | 4691.56 | 450 | 445 | 124.6 |
| D | 6 | 42 | 10085329 | 107308.18 | 329 | 314 | 94.0 |
| D | 15 | 94 | 2465027 | 26225.43 | 329 | 314 | 94.0 |
| D | 11 | 176 | 129519 | 1374.78 | 329 | 314 | 94.0 |
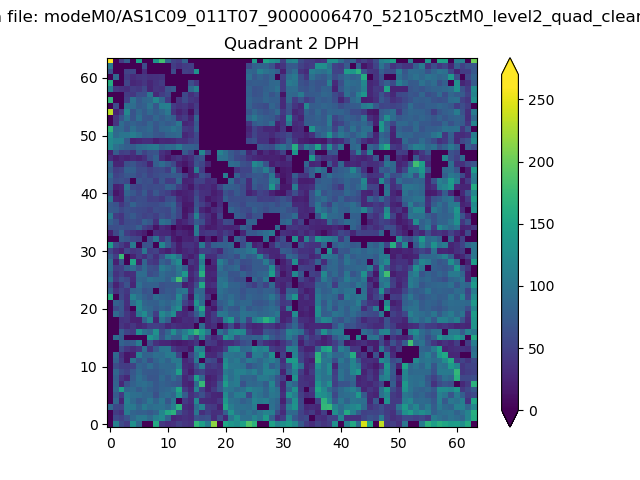
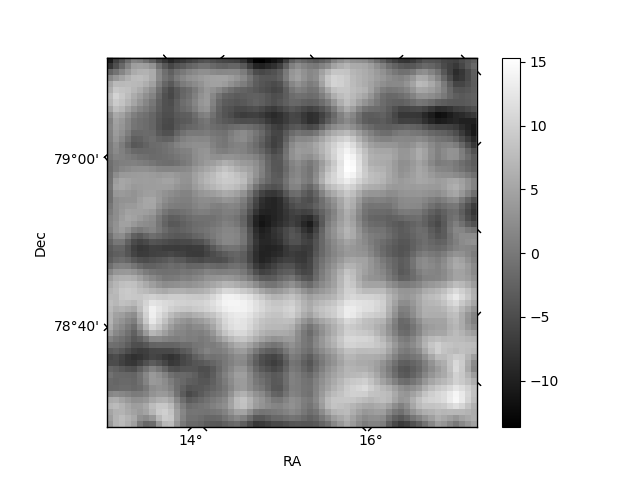
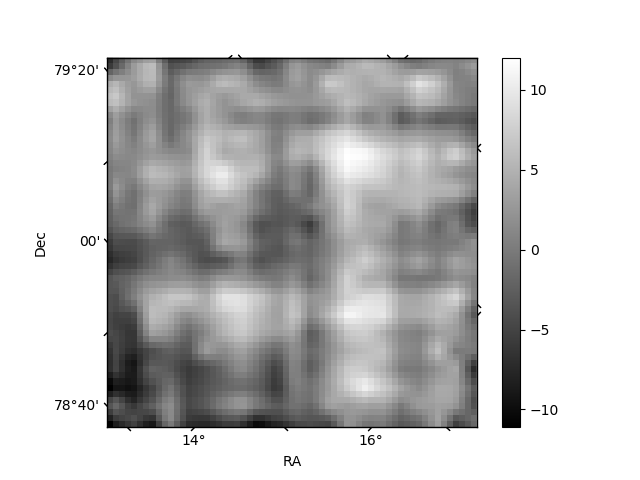
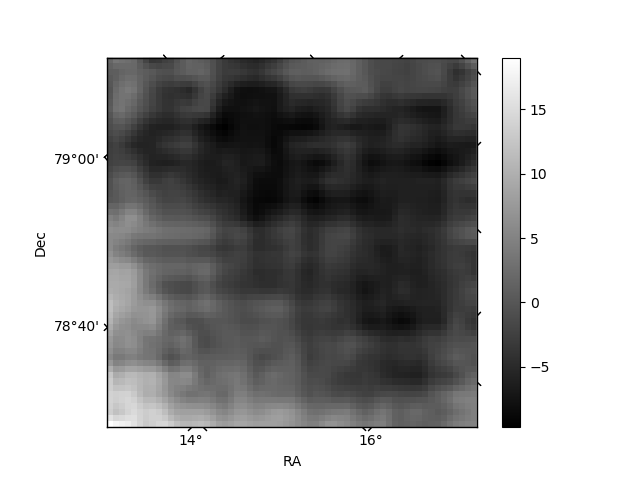
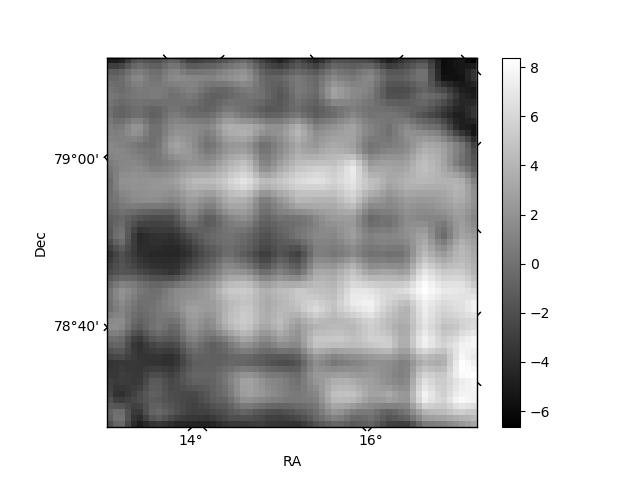
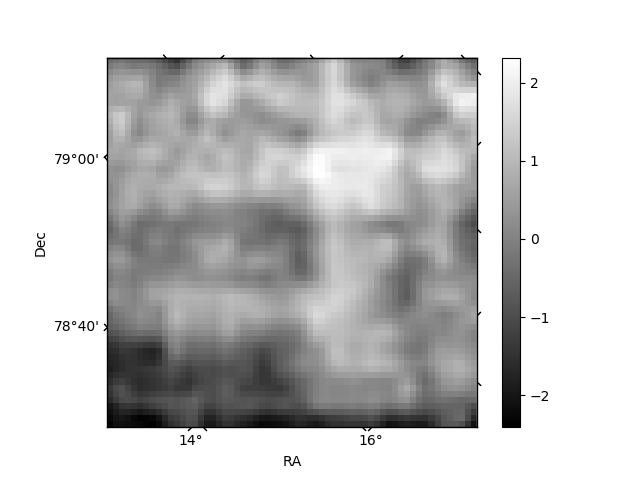
Histogram calculated using DETX and DETY for each event in the final _common_clean file
| Quadrant A | 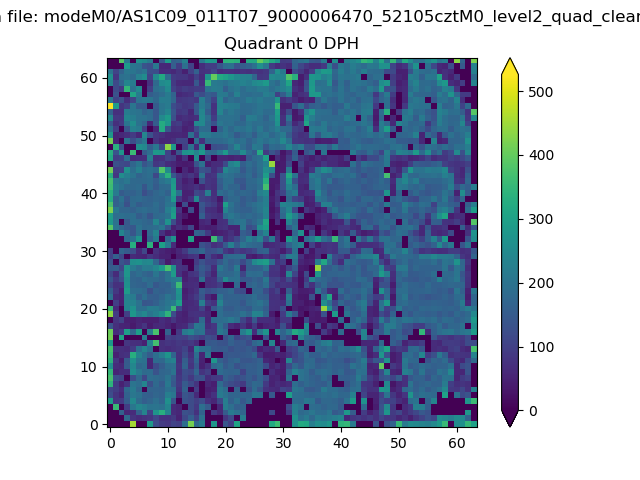 |
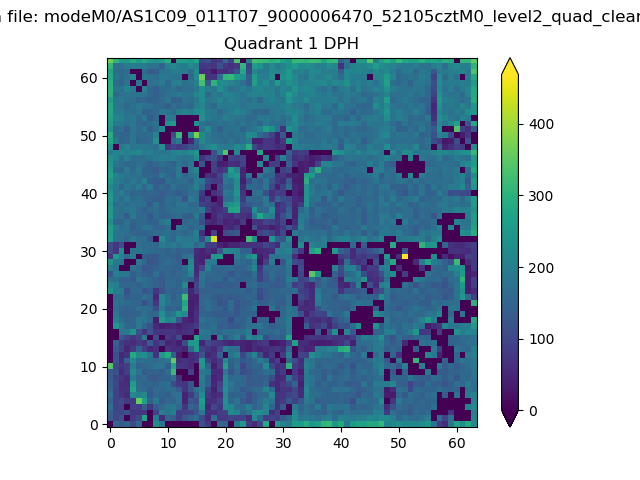 |
Quadrant B |
|---|---|---|---|
| Quadrant D | 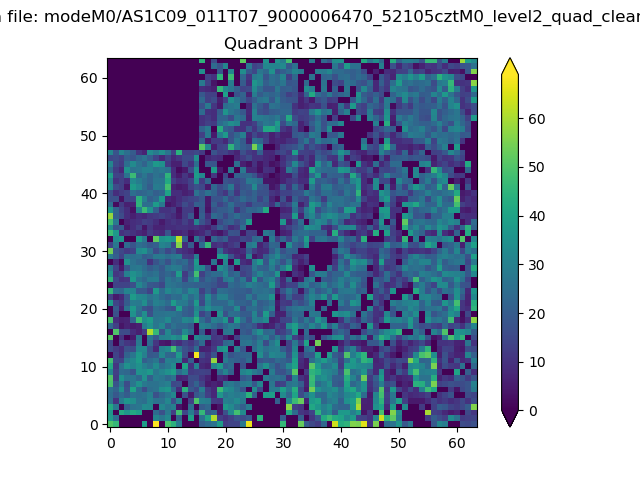 |
 |
Quadrant C |
| Plot type | Count rate plots | Images |
|---|---|---|
| Comparison with Poisson distribution Blue bars denote a histogram of data divided into 1 sec bins. Red curve is a Poisson curve with rate = median count rate of data. |
 |
 |
| Quadrant-wise count rates Data is divided into 100 sec bins |
 |
|
| Module-wise count rates for Quadrant A Data is divided into 100 sec bins |
 |
 |
| Module-wise count rates for Quadrant B Data is divided into 100 sec bins |
 |
 |
| Module-wise count rates for Quadrant C Data is divided into 100 sec bins |
 |
 |
| Module-wise count rates for Quadrant D Data is divided into 100 sec bins |
 |
 |
| Parameter | Plot |
|---|---|
| CZT HV Monitor |  |
| D_VDD | 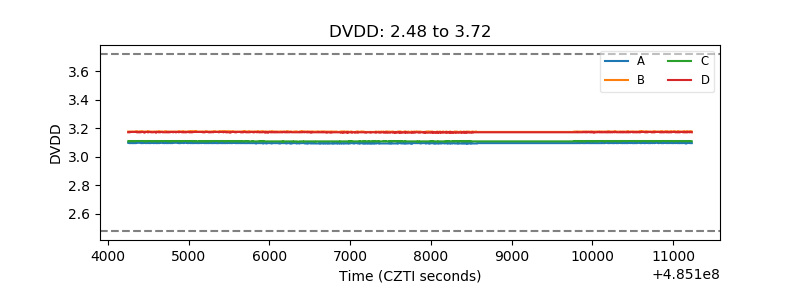 |
| Temperature 1 | 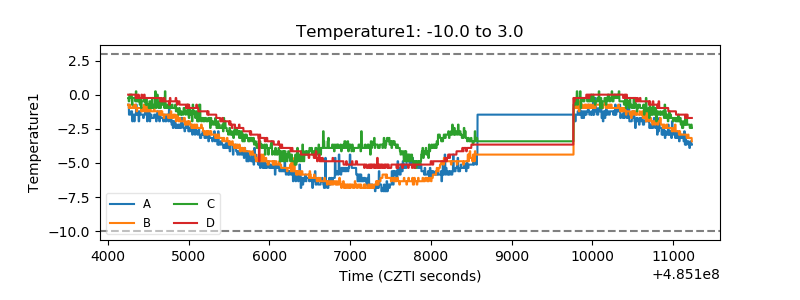 |
| Veto HV Monitor | 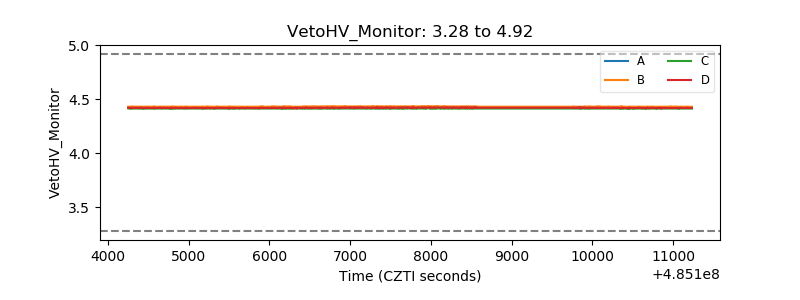 |
| Veto LLD | 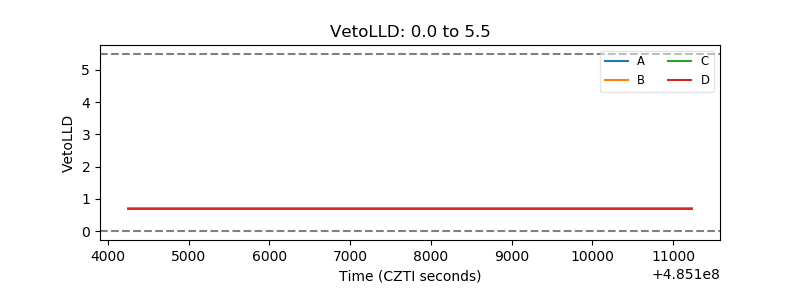 |
| Alpha Counter |  |
| _CPM_Rate |  |
| CZT Counter | 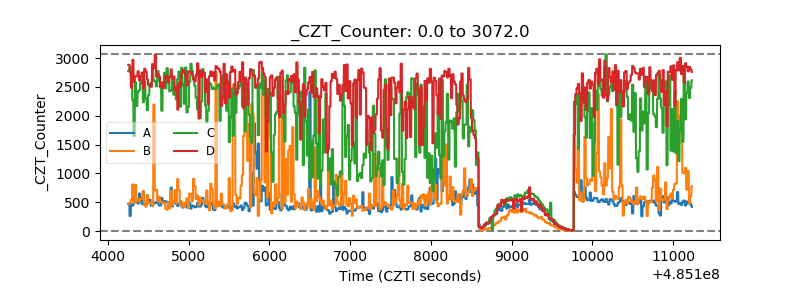 |
| +2.5 Volts monitor |  |
| +5 Volts monitor |  |
| _ROLL_ROT | 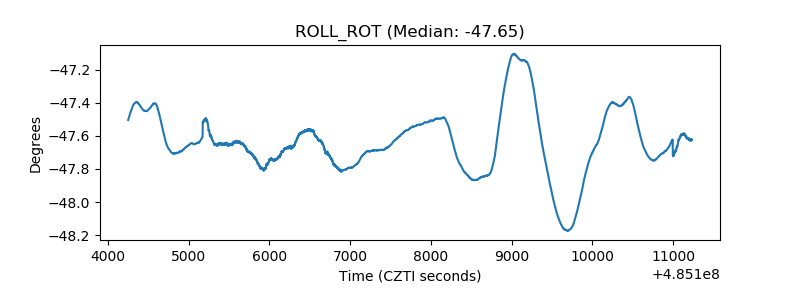 |
| _Roll_DEC | 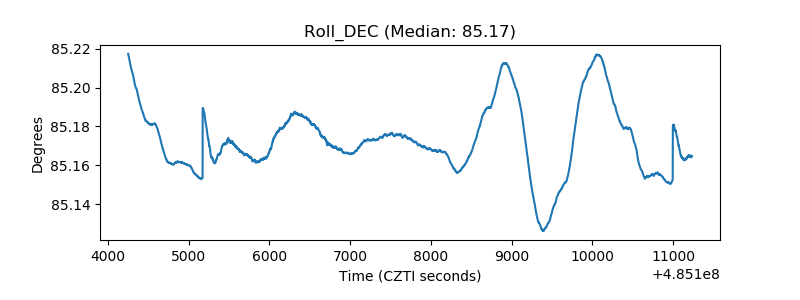 |
| _Roll_RA | 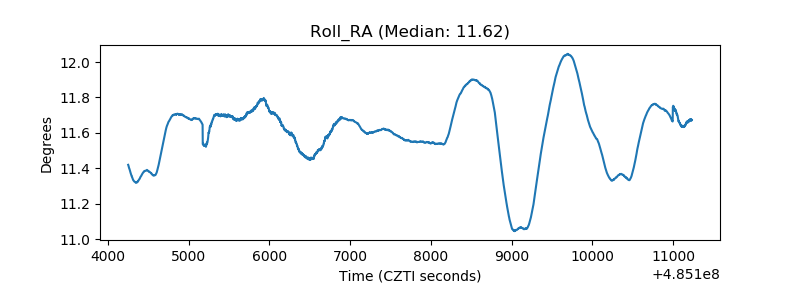 |
| Veto Counter | 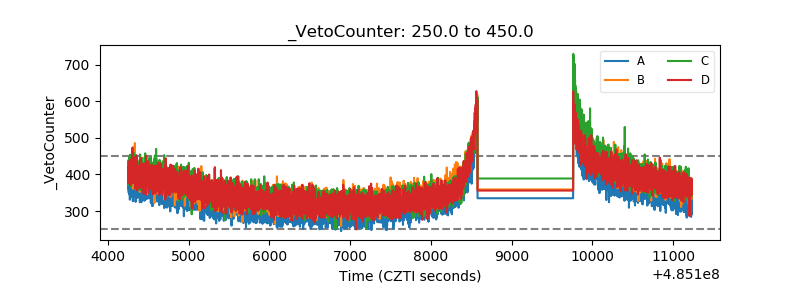 |