| Param | Original file | Final file |
|---|---|---|
| Filename | modeM0/AS1C09_011T07_9000006470_52118cztM0_level2.fits | modeM0/AS1C09_011T07_9000006470_52118cztM0_level2_quad_clean.evt |
| Size (bytes) | 871,459,200 | 68,345,280 |
| Size | 831.1 MB | 65.2 MB |
| Events in quadrant A | 3,776,479 | 579,760 |
| Events in quadrant B | 4,462,276 | 600,244 |
| Events in quadrant C | 7,484,821 | 463,619 |
| Events in quadrant D | 16,065,905 | 2,409 |
| Mode SS | |||
|---|---|---|---|
| Quadrant | BADHDUFLAG | Total packets | Discarded packets |
| A | 0 | 124 | 0 |
| B | 0 | 124 | 0 |
| C | 0 | 124 | 0 |
| D | 0 | 124 | 0 |
| Mode M9 | |||
|---|---|---|---|
| Quadrant | BADHDUFLAG | Total packets | Discarded packets |
| A | 0 | 11 | 0 |
| B | 0 | 11 | 0 |
| C | 0 | 11 | 0 |
| D | 0 | 11 | 0 |
| Mode M0 | |||
|---|---|---|---|
| Quadrant | BADHDUFLAG | Total packets | Discarded packets |
| A | 0 | 15222 | 1 |
| B | 0 | 17414 | 1 |
| C | 0 | 26426 | 4 |
| D | 0 | 51796 | 1 |
| Quadrant | Total seconds | Saturated seconds | Saturation percentage |
|---|---|---|---|
| A | 6057 | 218 | 3.599141% |
| B | 6057 | 420 | 6.934126% |
| C | 6056 | 1437 | 23.728534% |
| D | 6056 | 6040 | 99.735799% |
Noise dominated data is calculated using 1-second bins in cleaned event files. If a bin has >2000 counts, and if more than 50% of those come from <1% of pixels, then it is considered to be noise-dominated and hence unusable.
| Quadrant | # 1 sec bins | Bins with >0 counts | Bins with >2000 counts | High rate bins dominated by noise | Noise dominated (total time) | Noise dominated (detector-on time) | Marked lightcurve |
|---|---|---|---|---|---|---|---|
| A | 7162 | 6058 | 105 | 105 | 1.47% | 1.73% | 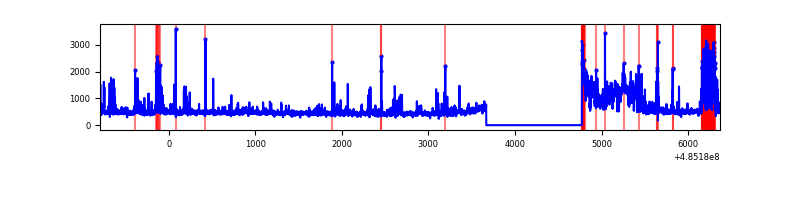 |
| B | 7162 | 6057 | 261 | 261 | 3.64% | 4.31% | 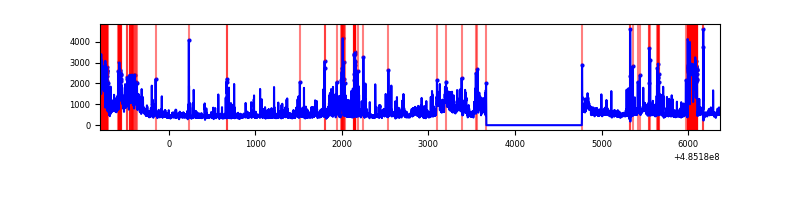 |
| C | 7161 | 6057 | 1076 | 1076 | 15.03% | 17.76% | 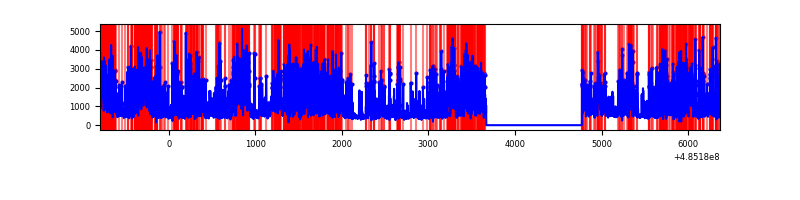 |
| D | 7160 | 6055 | 5745 | 5745 | 80.24% | 94.88% | 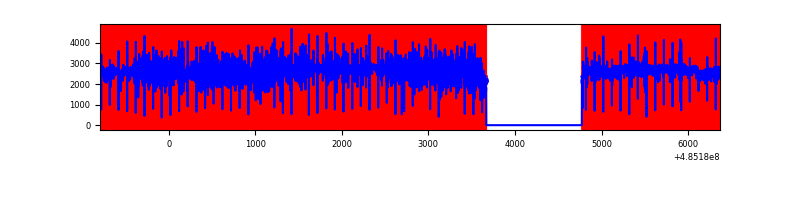 |
Top three noisy pixels from each quadrant. If the there are fewer than three noisy pixels in the level2.evt file, extra rows are filled as -1
| Pixel properties | Quadrant properties | ||||||
|---|---|---|---|---|---|---|---|
| Quadrant | DetID | PixID | Counts | Sigma | Mean | Median | Sigma |
| A | 3 | 7 | 580553 | 3598.01 | 643 | 627 | 161.2 |
| A | 4 | 3 | 236274 | 1462.01 | 643 | 627 | 161.2 |
| A | 5 | 240 | 79539 | 489.59 | 643 | 627 | 161.2 |
| B | 8 | 128 | 426792 | 3227.45 | 623 | 601 | 132.1 |
| B | 5 | 172 | 353803 | 2674.72 | 623 | 601 | 132.1 |
| B | 10 | 254 | 263378 | 1989.95 | 623 | 601 | 132.1 |
| C | 15 | 224 | 3766428 | 23934.53 | 571 | 563 | 157.3 |
| C | 13 | 3 | 417676 | 2651.03 | 571 | 563 | 157.3 |
| C | 15 | 217 | 340464 | 2160.29 | 571 | 563 | 157.3 |
| D | 15 | 94 | 11187237 | 194159.45 | 197 | 188 | 57.6 |
| D | 6 | 42 | 3350005 | 58138.53 | 197 | 188 | 57.6 |
| D | 13 | 170 | 181648 | 3149.37 | 197 | 188 | 57.6 |
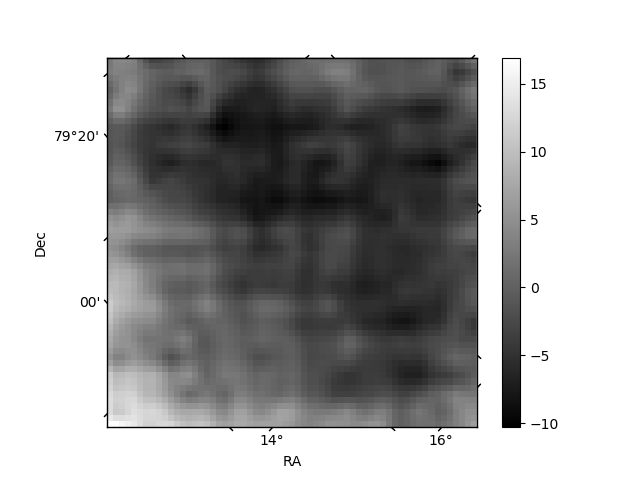
Histogram calculated using DETX and DETY for each event in the final _common_clean file
| Quadrant A | 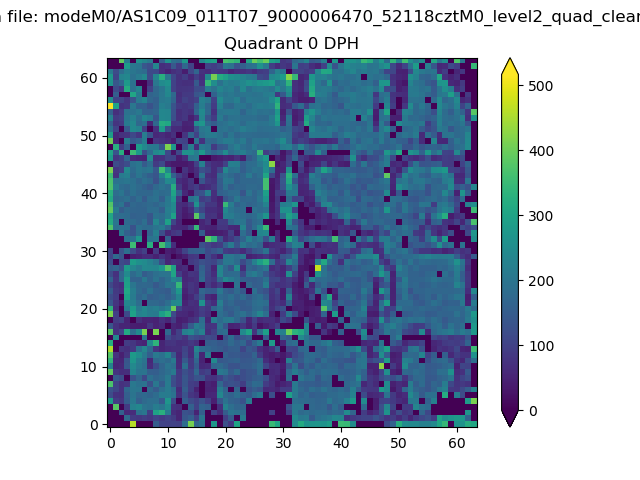 |
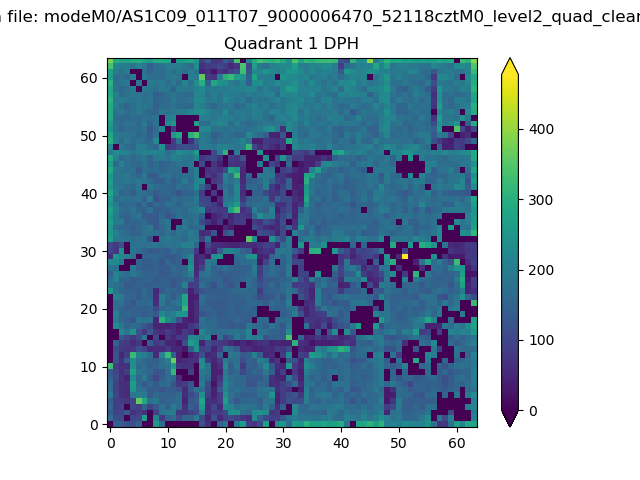 |
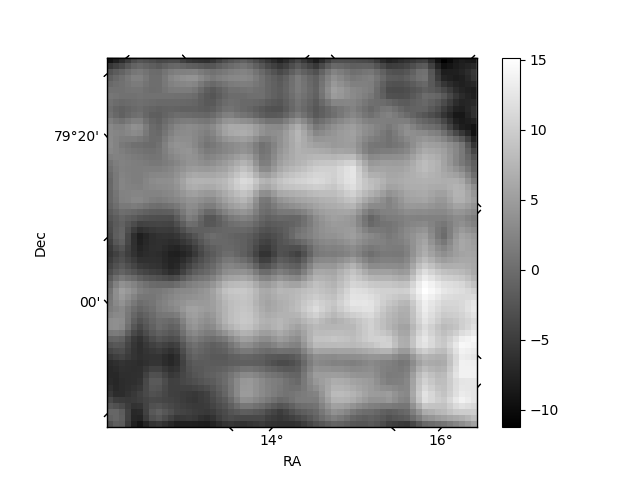
Quadrant B |
|---|---|---|---|
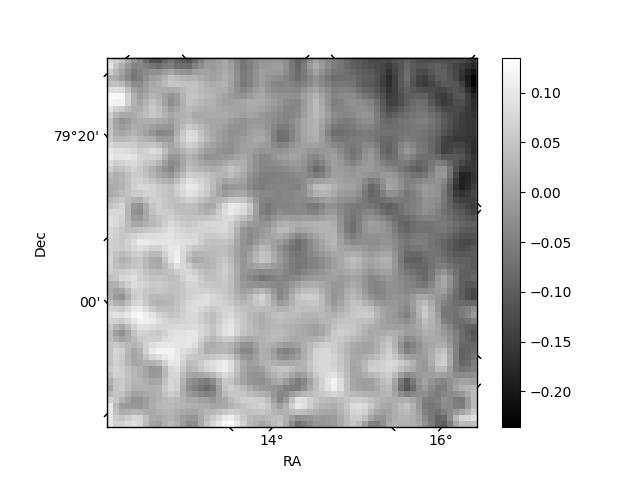
| Quadrant D | 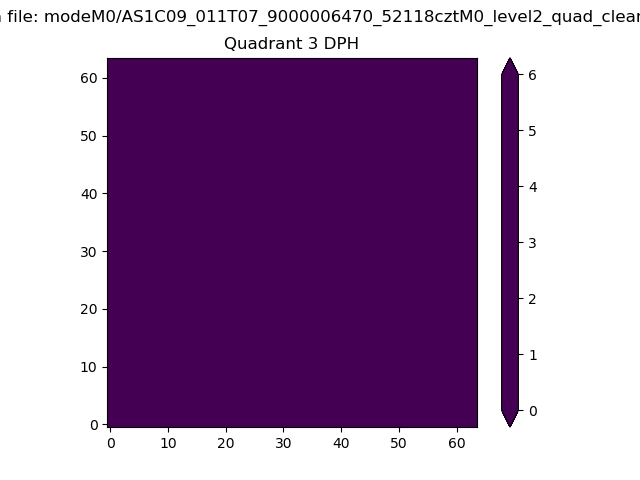 |
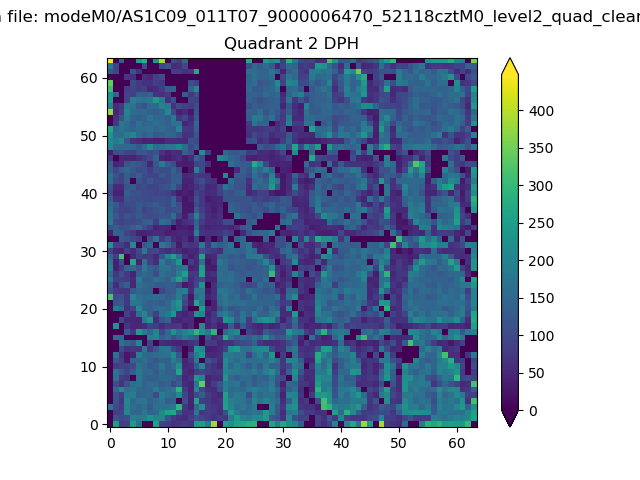 |
Quadrant C |
| Plot type | Count rate plots | Images |
|---|---|---|
| Comparison with Poisson distribution Blue bars denote a histogram of data divided into 1 sec bins. Red curve is a Poisson curve with rate = median count rate of data. |
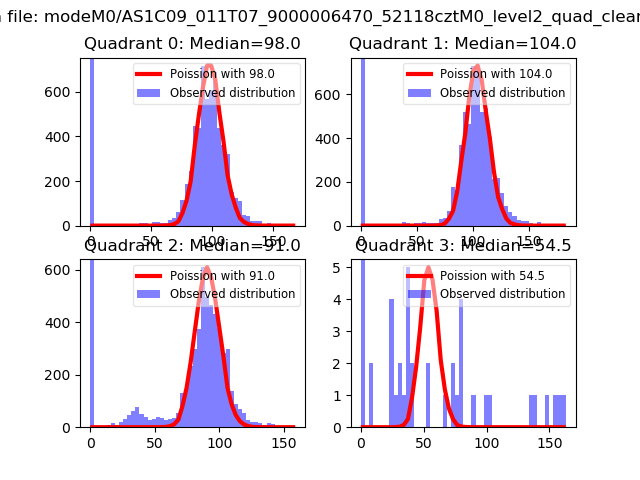 |
 |
| Quadrant-wise count rates Data is divided into 100 sec bins |
 |
|
| Module-wise count rates for Quadrant A Data is divided into 100 sec bins |
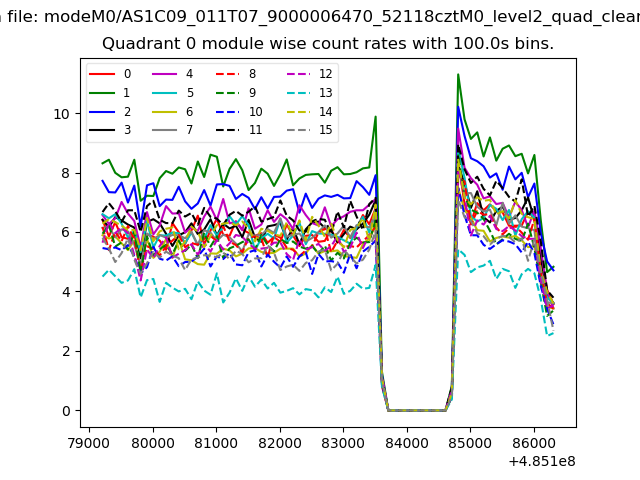 |
 |
| Module-wise count rates for Quadrant B Data is divided into 100 sec bins |
 |
 |
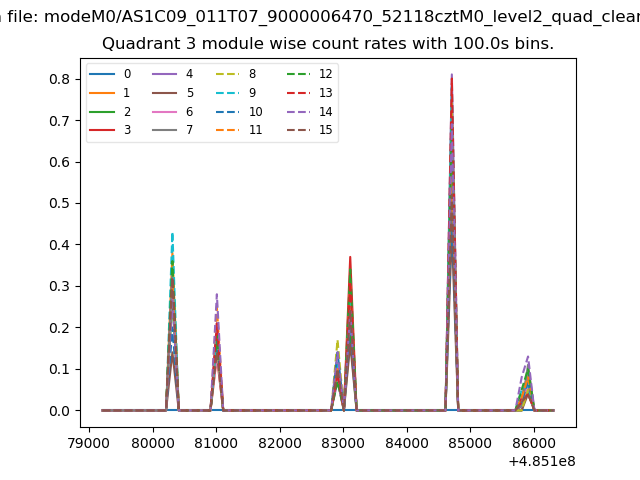
| Module-wise count rates for Quadrant C Data is divided into 100 sec bins |
 |
 |
| Module-wise count rates for Quadrant D Data is divided into 100 sec bins |
 |
 |
| Parameter | Plot |
|---|---|
| CZT HV Monitor |  |
| D_VDD | 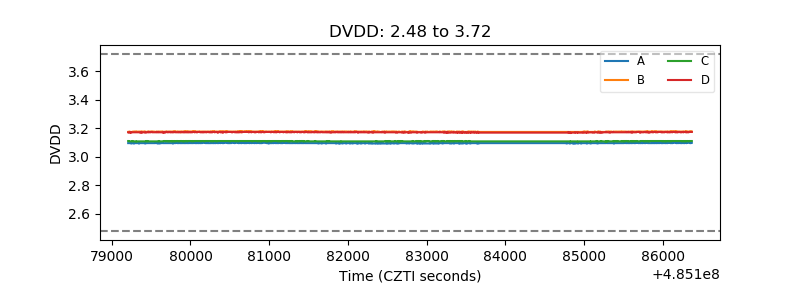 |
| Temperature 1 |  |
| Veto HV Monitor | 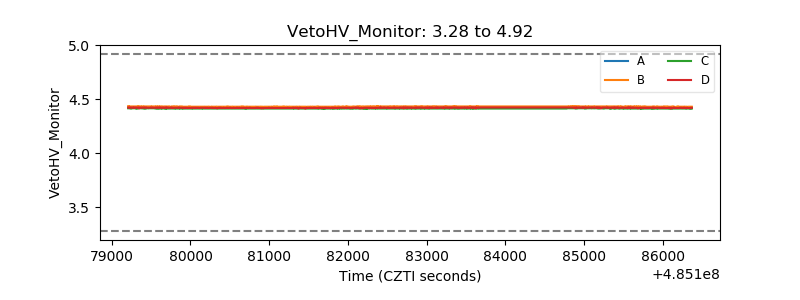 |
| Veto LLD | 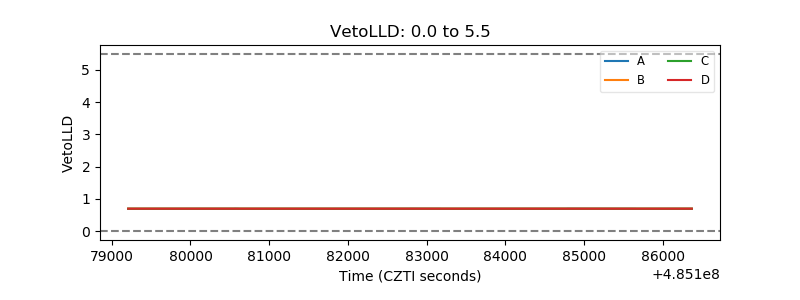 |
| Alpha Counter |  |
| _CPM_Rate |  |
| CZT Counter | 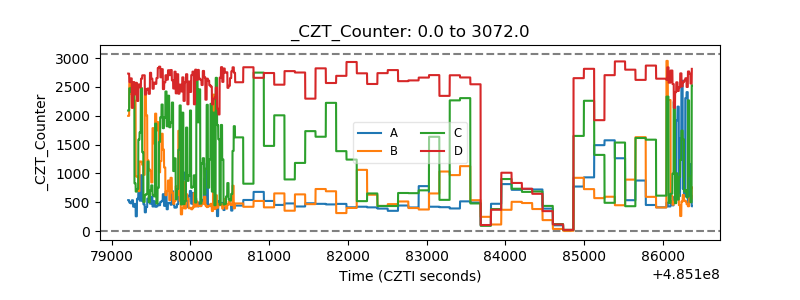 |
| +2.5 Volts monitor |  |
| +5 Volts monitor |  |
| _ROLL_ROT | 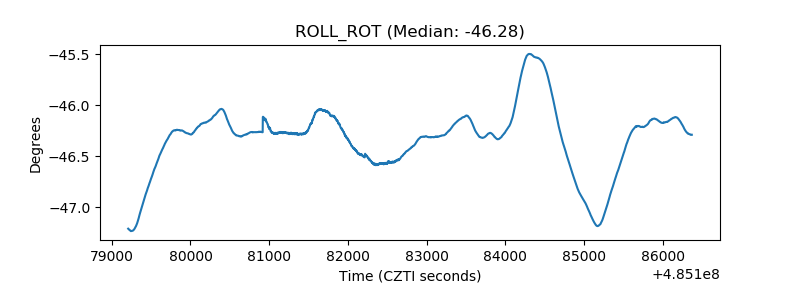 |
| _Roll_DEC | 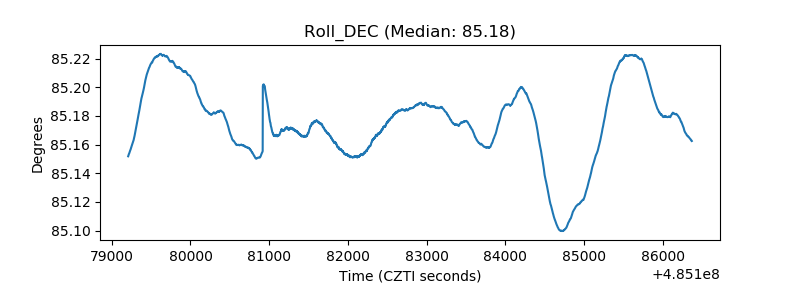 |
| _Roll_RA | 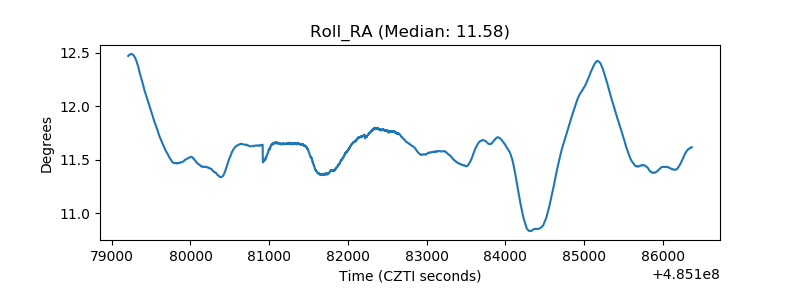 |
| Veto Counter | 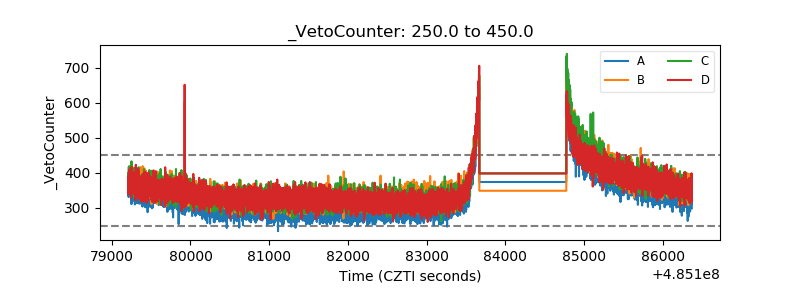 |