| Param | Original file | Final file |
|---|---|---|
| Filename | modeM0/AS1C09_011T07_9000006470_52125cztM0_level2.fits | modeM0/AS1C09_011T07_9000006470_52125cztM0_level2_quad_clean.evt |
| Size (bytes) | 1,142,231,040 | 74,733,120 |
| Size | 1.1 GB | 71.3 MB |
| Events in quadrant A | 5,203,355 | 656,508 |
| Events in quadrant B | 4,137,354 | 719,311 |
| Events in quadrant C | 13,510,765 | 340,319 |
| Events in quadrant D | 18,860,133 | 32,518 |
| Mode SS | |||
|---|---|---|---|
| Quadrant | BADHDUFLAG | Total packets | Discarded packets |
| A | 0 | 148 | 0 |
| B | 0 | 148 | 0 |
| C | 0 | 148 | 0 |
| D | 0 | 148 | 0 |
| Mode M0 | |||
|---|---|---|---|
| Quadrant | BADHDUFLAG | Total packets | Discarded packets |
| A | 0 | 20682 | 0 |
| B | 0 | 17548 | 0 |
| C | 0 | 45189 | 0 |
| D | 0 | 61093 | 8 |
| Quadrant | Total seconds | Saturated seconds | Saturation percentage |
|---|---|---|---|
| A | 7378 | 361 | 4.892925% |
| B | 7378 | 168 | 2.277040% |
| C | 7378 | 3990 | 54.079696% |
| D | 7378 | 7113 | 96.408241% |
Noise dominated data is calculated using 1-second bins in cleaned event files. If a bin has >2000 counts, and if more than 50% of those come from <1% of pixels, then it is considered to be noise-dominated and hence unusable.
| Quadrant | # 1 sec bins | Bins with >0 counts | Bins with >2000 counts | High rate bins dominated by noise | Noise dominated (total time) | Noise dominated (detector-on time) | Marked lightcurve |
|---|---|---|---|---|---|---|---|
| A | 7378 | 7378 | 268 | 268 | 3.63% | 3.63% | 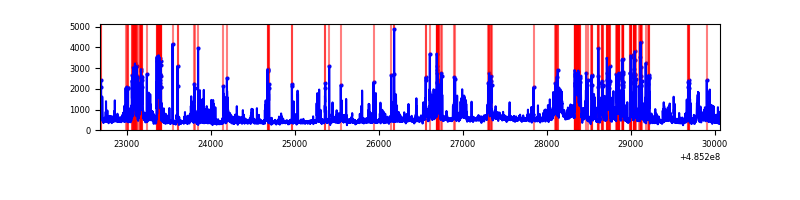 |
| B | 7378 | 7378 | 104 | 104 | 1.41% | 1.41% | 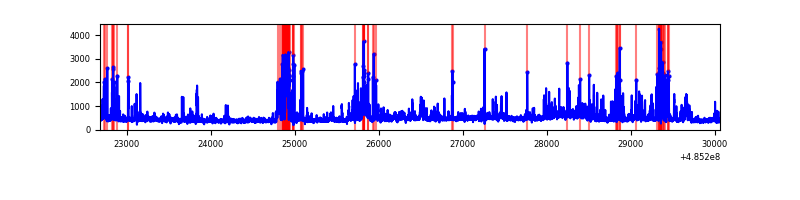 |
| C | 7378 | 7378 | 3209 | 3209 | 43.49% | 43.49% | 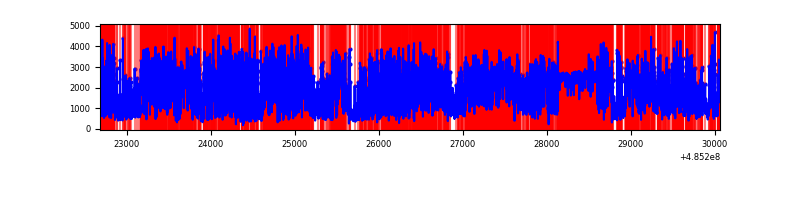 |
| D | 7378 | 7378 | 6668 | 6668 | 90.38% | 90.38% |  |
Top three noisy pixels from each quadrant. If the there are fewer than three noisy pixels in the level2.evt file, extra rows are filled as -1
| Pixel properties | Quadrant properties | ||||||
|---|---|---|---|---|---|---|---|
| Quadrant | DetID | PixID | Counts | Sigma | Mean | Median | Sigma |
| A | 7 | 206 | 963070 | 5159.17 | 746 | 727 | 186.5 |
| A | 8 | 43 | 360807 | 1930.41 | 746 | 727 | 186.5 |
| A | 4 | 3 | 147796 | 788.45 | 746 | 727 | 186.5 |
| B | 0 | 213 | 269014 | 1673.72 | 754 | 727 | 160.3 |
| B | 4 | 81 | 235309 | 1463.45 | 754 | 727 | 160.3 |
| B | 5 | 185 | 126715 | 785.98 | 754 | 727 | 160.3 |
| C | 15 | 224 | 5326263 | 35564.09 | 537 | 533 | 149.8 |
| C | 15 | 193 | 1999349 | 13347.67 | 537 | 533 | 149.8 |
| C | 15 | 248 | 1908469 | 12740.79 | 537 | 533 | 149.8 |
| D | 15 | 94 | 8643476 | 88097.41 | 338 | 323 | 98.1 |
| D | 6 | 42 | 7024002 | 71590.53 | 338 | 323 | 98.1 |
| D | 12 | 17 | 422219 | 4300.28 | 338 | 323 | 98.1 |
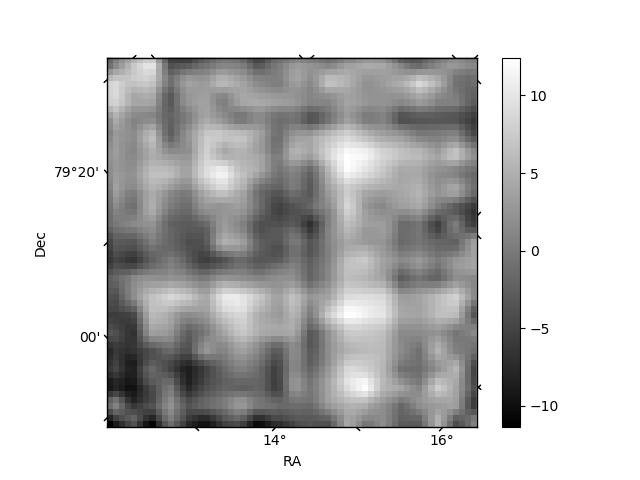
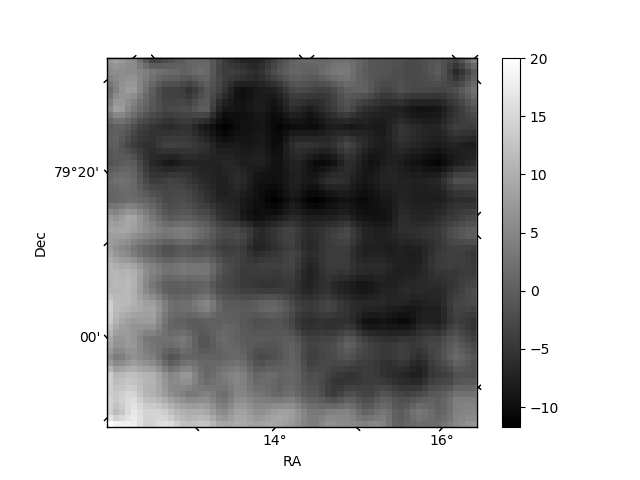
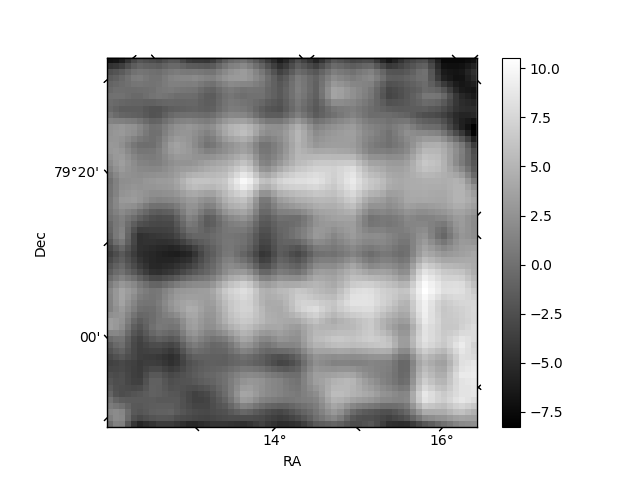
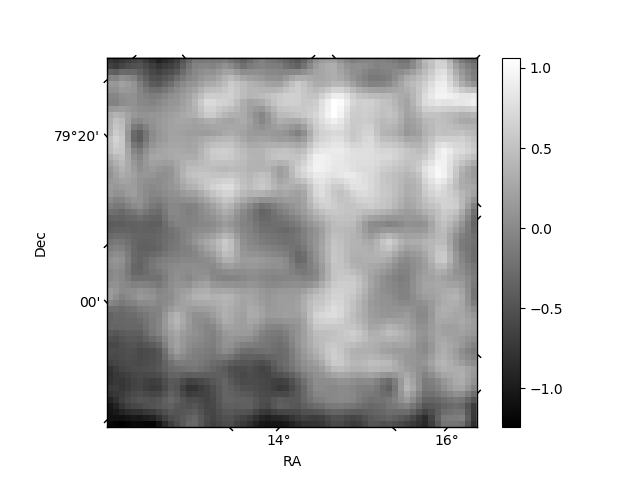
Histogram calculated using DETX and DETY for each event in the final _common_clean file
| Quadrant A | 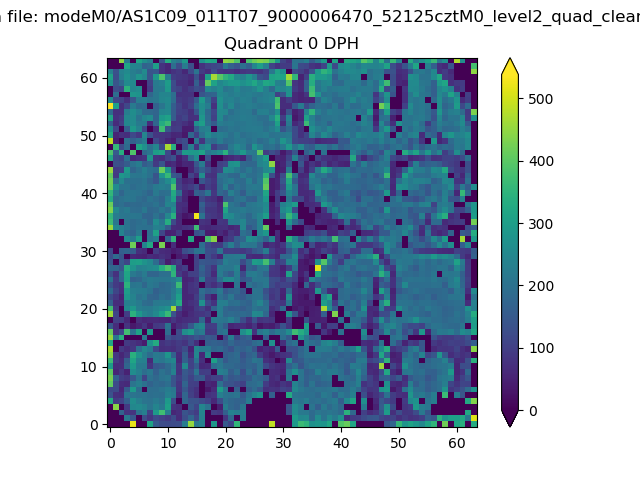 |
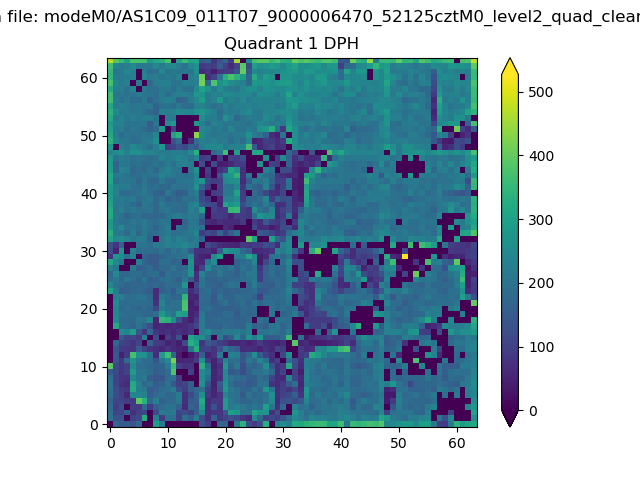 |
Quadrant B |
|---|---|---|---|
| Quadrant D | 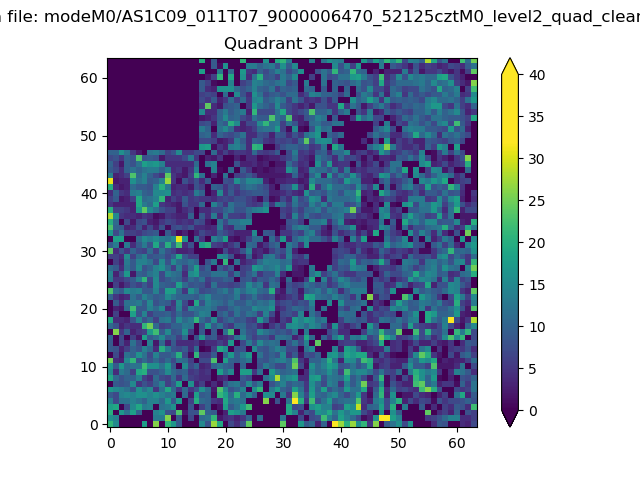 |
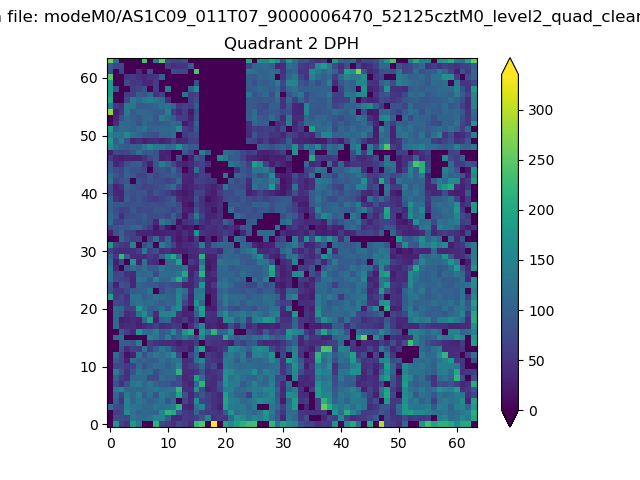 |
Quadrant C |
| Plot type | Count rate plots | Images |
|---|---|---|
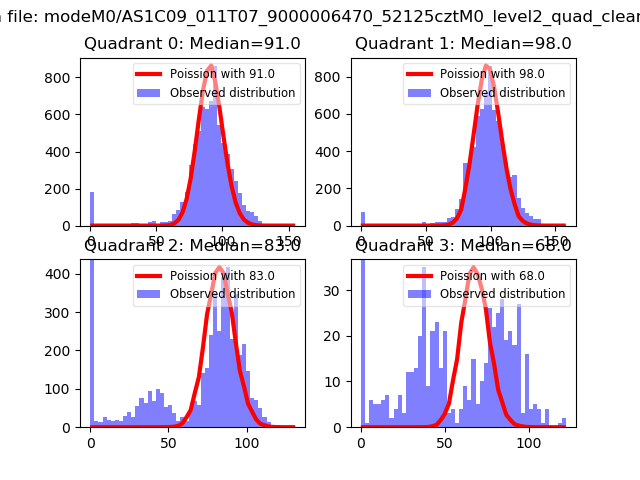
| Comparison with Poisson distribution Blue bars denote a histogram of data divided into 1 sec bins. Red curve is a Poisson curve with rate = median count rate of data. |
 |
 |
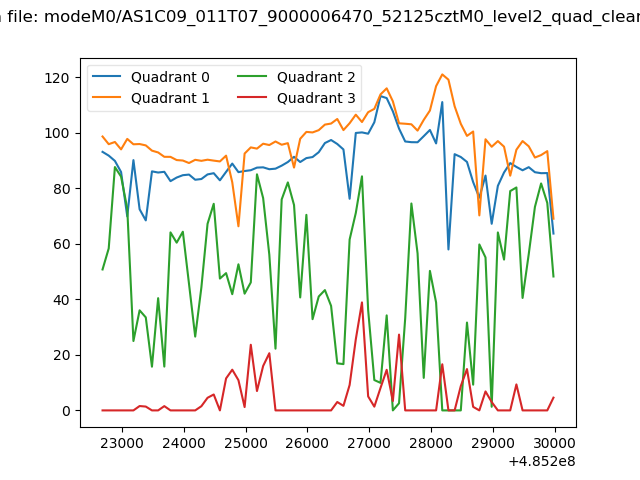
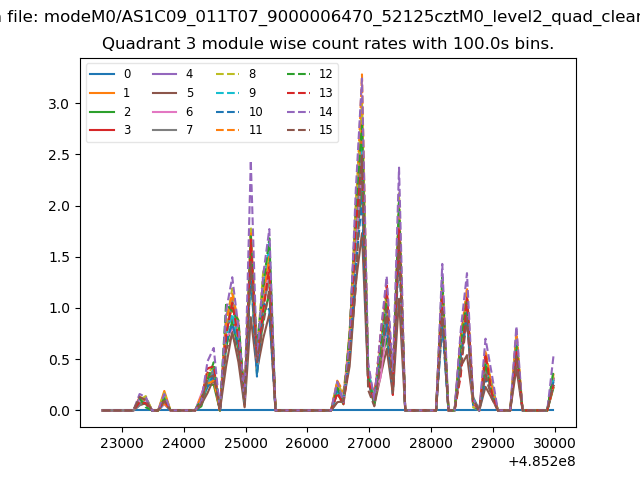
| Quadrant-wise count rates Data is divided into 100 sec bins |
 |
|
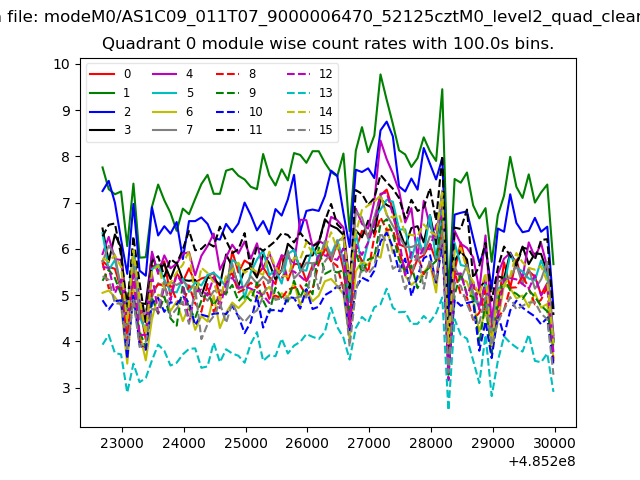
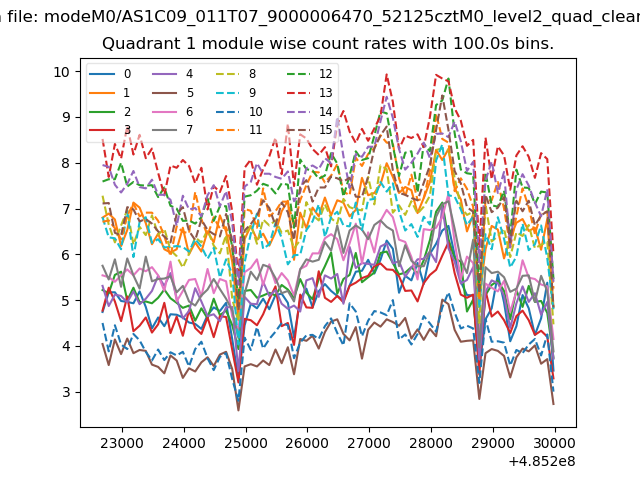
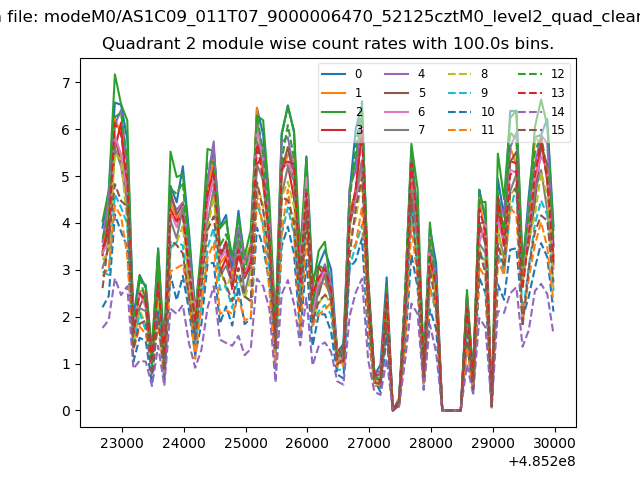
| Module-wise count rates for Quadrant A Data is divided into 100 sec bins |
 |
 |
| Module-wise count rates for Quadrant B Data is divided into 100 sec bins |
 |
 |
| Module-wise count rates for Quadrant C Data is divided into 100 sec bins |
 |
 |
| Module-wise count rates for Quadrant D Data is divided into 100 sec bins |
 |
 |
| Parameter | Plot |
|---|---|
| CZT HV Monitor | 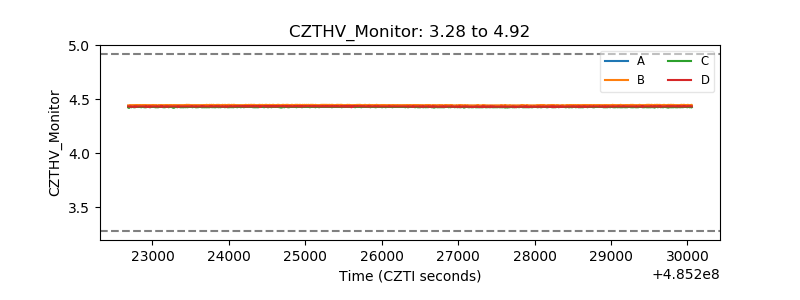 |
| D_VDD | 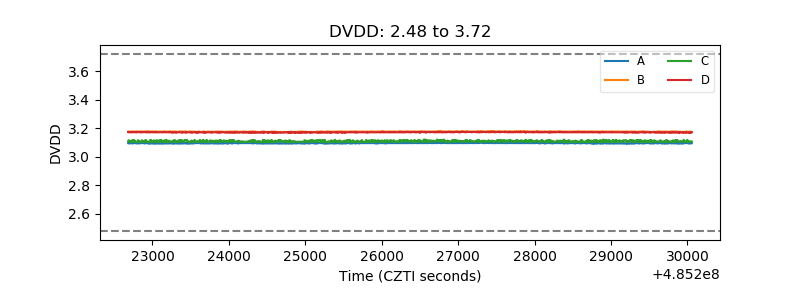 |
| Temperature 1 | 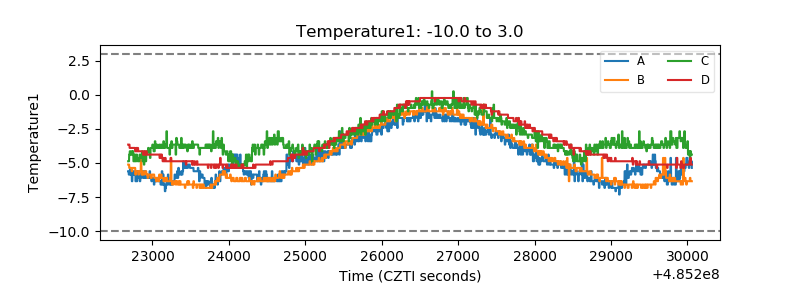 |
| Veto HV Monitor | 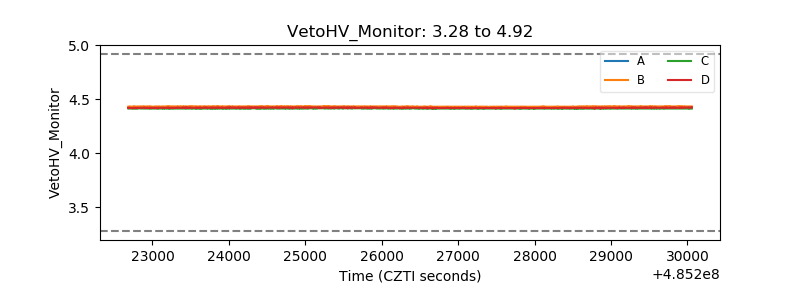 |
| Veto LLD | 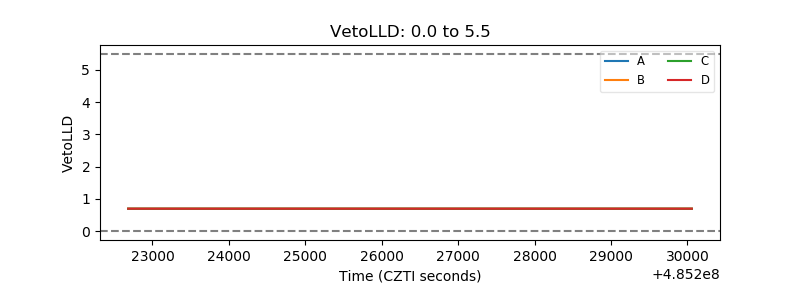 |
| Alpha Counter | 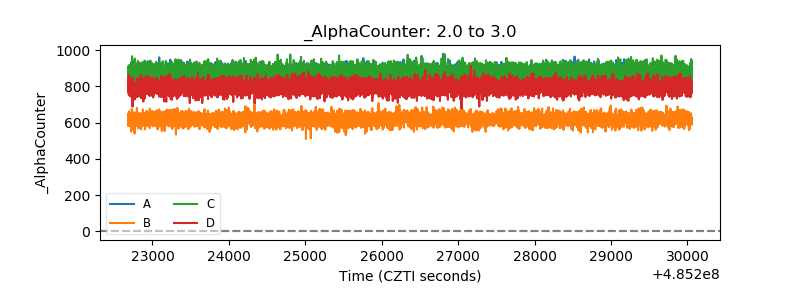 |
| _CPM_Rate | 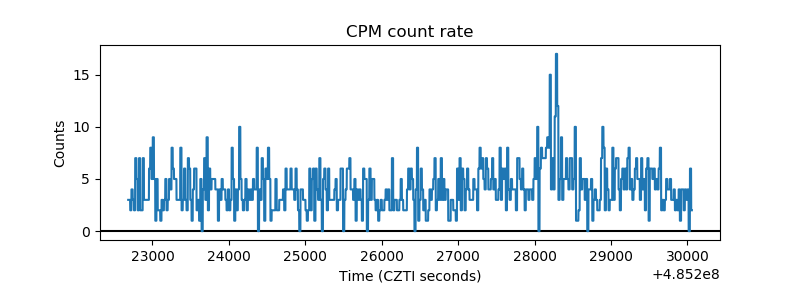 |
| CZT Counter | 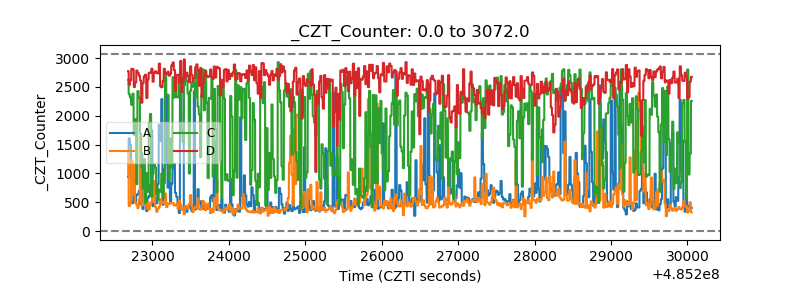 |
| +2.5 Volts monitor |  |
| +5 Volts monitor | 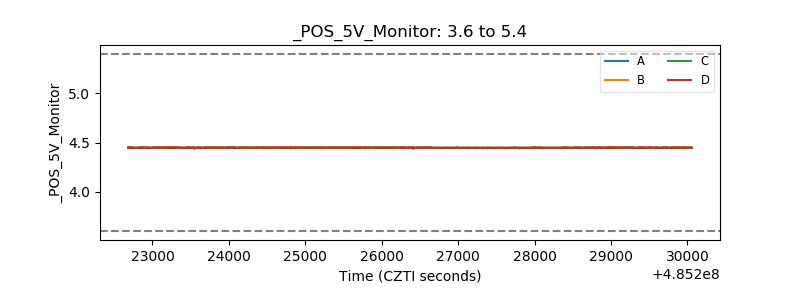 |
| _ROLL_ROT | 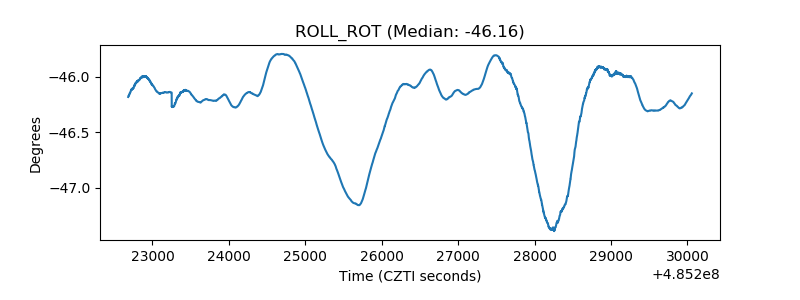 |
| _Roll_DEC | 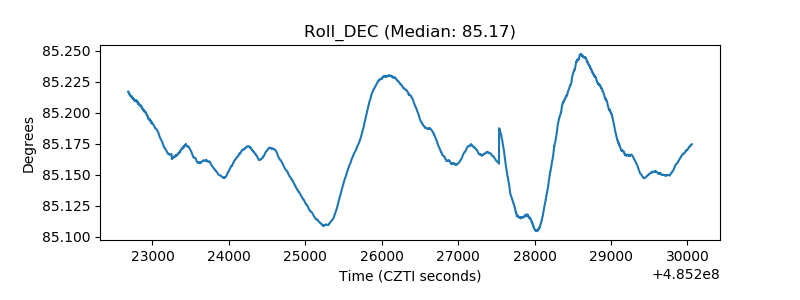 |
| _Roll_RA | 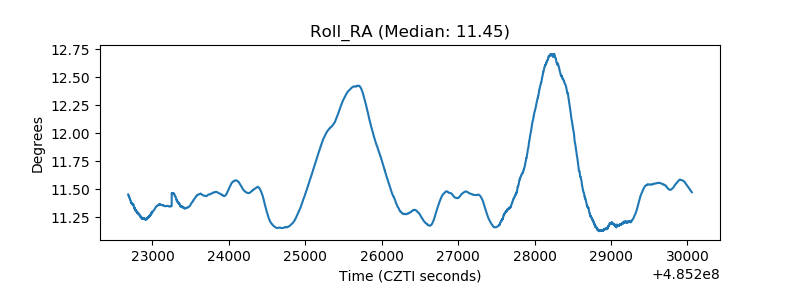 |
| Veto Counter | 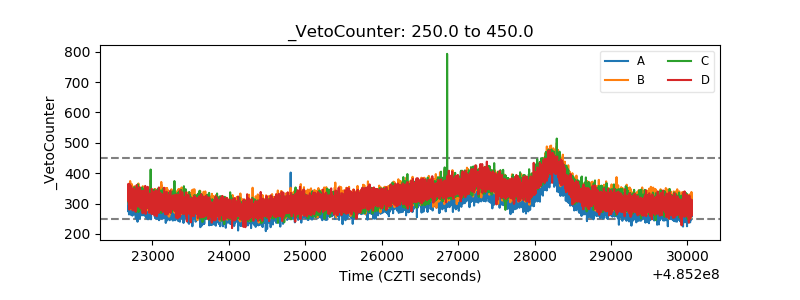 |