| Param | Original file | Final file |
|---|---|---|
| Filename | modeM0/AS1C09_011T08_9000006472_52161cztM0_level2.fits | modeM0/AS1C09_011T08_9000006472_52161cztM0_level2_quad_clean.evt |
| Size (bytes) | 375,698,880 | 28,013,760 |
| Size | 358.3 MB | 26.7 MB |
| Events in quadrant A | 1,880,180 | 249,658 |
| Events in quadrant B | 1,695,142 | 263,684 |
| Events in quadrant C | 4,429,932 | 142,144 |
| Events in quadrant D | 5,691,247 | 30 |
| Mode M0 | |||
|---|---|---|---|
| Quadrant | BADHDUFLAG | Total packets | Discarded packets |
| A | 0 | 7502 | 0 |
| B | 0 | 6890 | 0 |
| C | 0 | 15026 | 0 |
| D | 0 | 18741 | 0 |
| Mode SS | |||
|---|---|---|---|
| Quadrant | BADHDUFLAG | Total packets | Discarded packets |
| A | 0 | 54 | 0 |
| B | 0 | 54 | 0 |
| C | 0 | 54 | 0 |
| D | 0 | 54 | 0 |
| Quadrant | Total seconds | Saturated seconds | Saturation percentage |
|---|---|---|---|
| A | 2688 | 22 | 0.818452% |
| B | 2689 | 66 | 2.454444% |
| C | 2689 | 1198 | 44.551878% |
| D | 2689 | 2688 | 99.962811% |
Noise dominated data is calculated using 1-second bins in cleaned event files. If a bin has >2000 counts, and if more than 50% of those come from <1% of pixels, then it is considered to be noise-dominated and hence unusable.
| Quadrant | # 1 sec bins | Bins with >0 counts | Bins with >2000 counts | High rate bins dominated by noise | Noise dominated (total time) | Noise dominated (detector-on time) | Marked lightcurve |
|---|---|---|---|---|---|---|---|
| A | 2688 | 2688 | 15 | 15 | 0.56% | 0.56% | 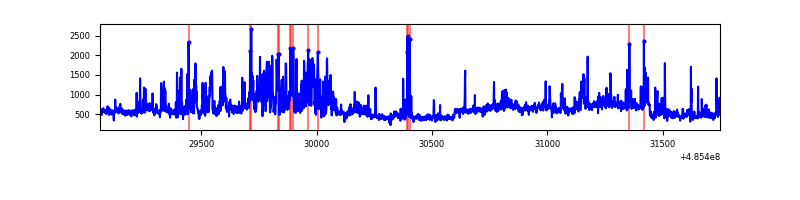 |
| B | 2689 | 2689 | 60 | 60 | 2.23% | 2.23% | 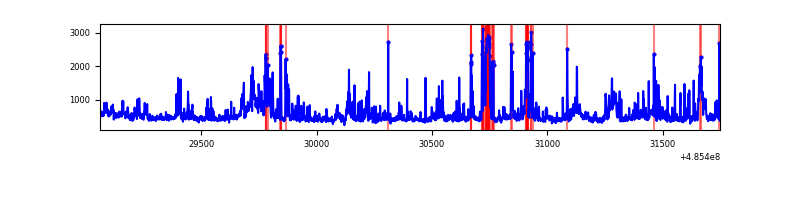 |
| C | 2688 | 2688 | 1144 | 1144 | 42.56% | 42.56% | 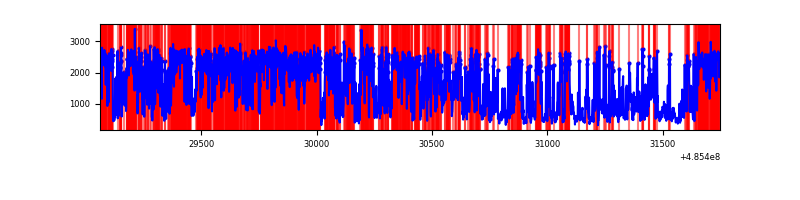 |
| D | 2688 | 2688 | 1720 | 1720 | 63.99% | 63.99% | 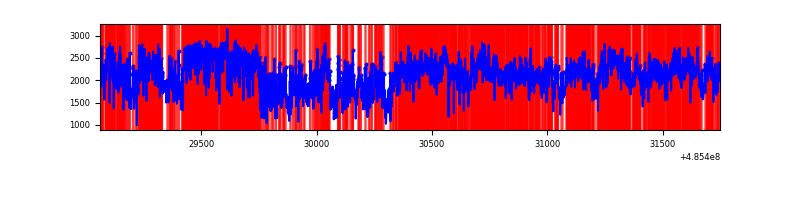 |
Top three noisy pixels from each quadrant. If the there are fewer than three noisy pixels in the level2.evt file, extra rows are filled as -1
| Pixel properties | Quadrant properties | ||||||
|---|---|---|---|---|---|---|---|
| Quadrant | DetID | PixID | Counts | Sigma | Mean | Median | Sigma |
| A | 4 | 3 | 342429 | 5012.12 | 271 | 264 | 68.3 |
| A | 4 | 95 | 253320 | 3706.83 | 271 | 264 | 68.3 |
| A | 14 | 254 | 51848 | 755.62 | 271 | 264 | 68.3 |
| B | 10 | 44 | 189748 | 3299.77 | 264 | 256 | 57.4 |
| B | 7 | 0 | 94518 | 1641.46 | 264 | 256 | 57.4 |
| B | 0 | 216 | 93681 | 1626.88 | 264 | 256 | 57.4 |
| C | 15 | 224 | 2140352 | 38019.53 | 200 | 198 | 56.3 |
| C | 0 | 192 | 960043 | 17051.51 | 200 | 198 | 56.3 |
| C | 13 | 3 | 230548 | 4092.14 | 200 | 198 | 56.3 |
| D | 12 | 1 | 4786283 | 662667.16 | 19 | 18 | 7.2 |
| D | 6 | 42 | 745945 | 103274.96 | 19 | 18 | 7.2 |
| D | 12 | 3 | 21370 | 2956.22 | 19 | 18 | 7.2 |
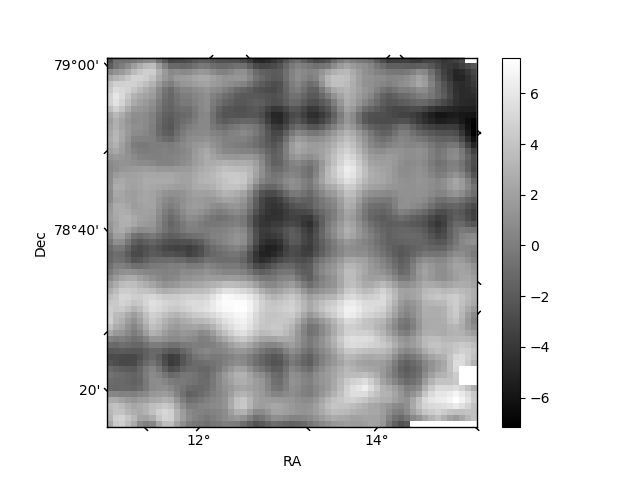
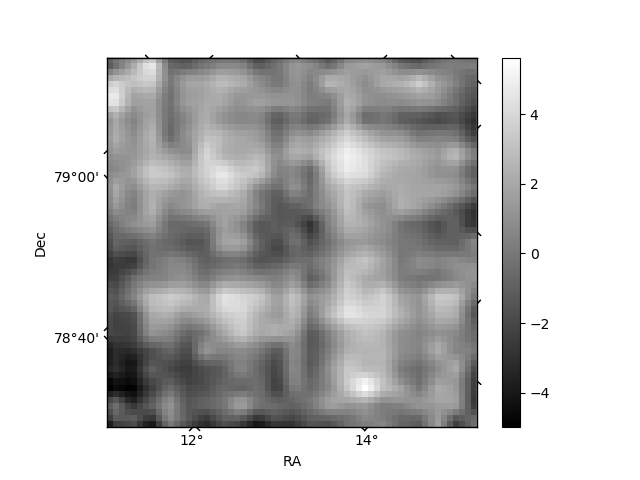
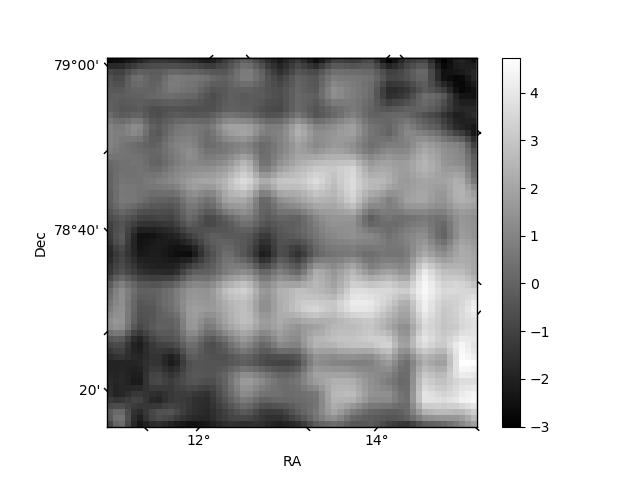
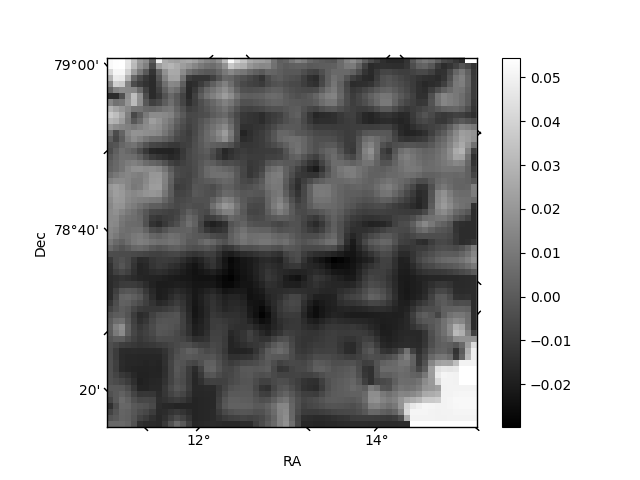
Histogram calculated using DETX and DETY for each event in the final _common_clean file
| Quadrant A | 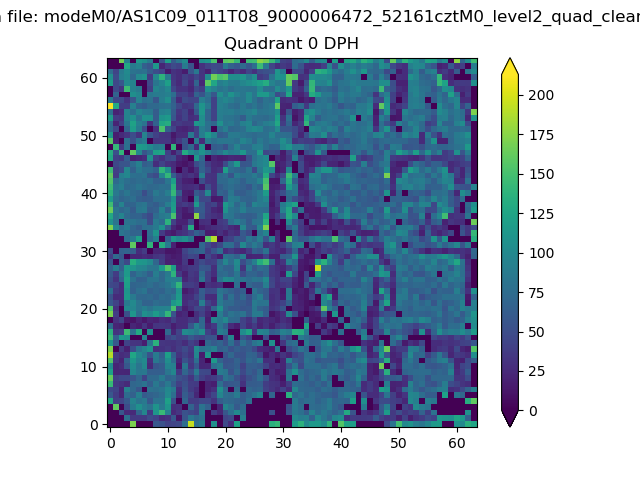 |
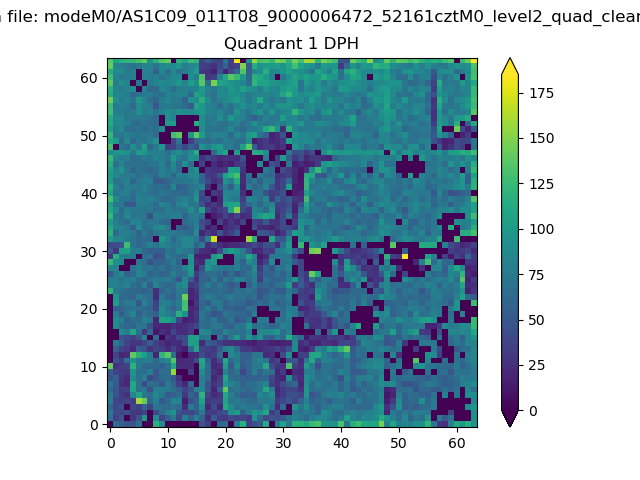 |
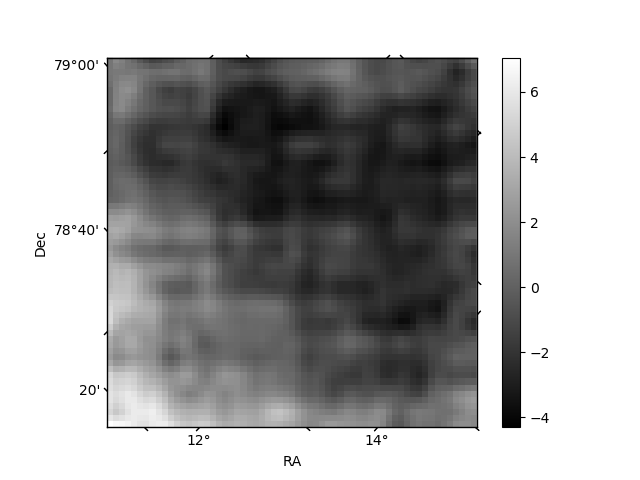
Quadrant B |
|---|---|---|---|
| Quadrant D | 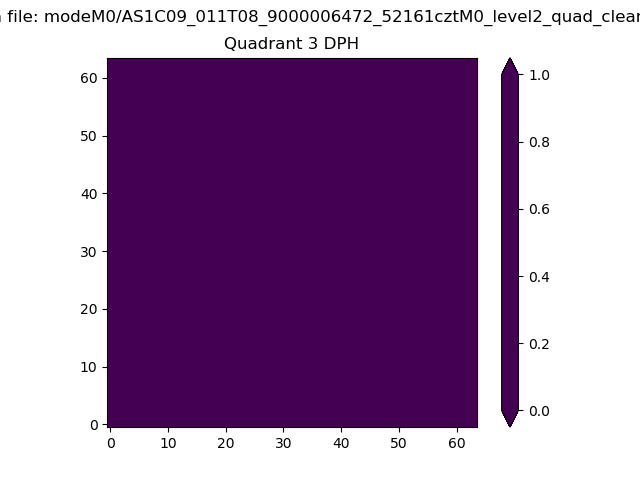 |
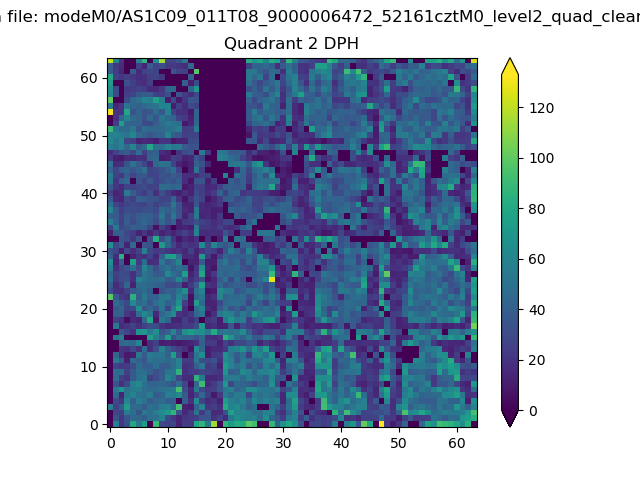 |
Quadrant C |
| Plot type | Count rate plots | Images |
|---|---|---|
| Comparison with Poisson distribution Blue bars denote a histogram of data divided into 1 sec bins. Red curve is a Poisson curve with rate = median count rate of data. |
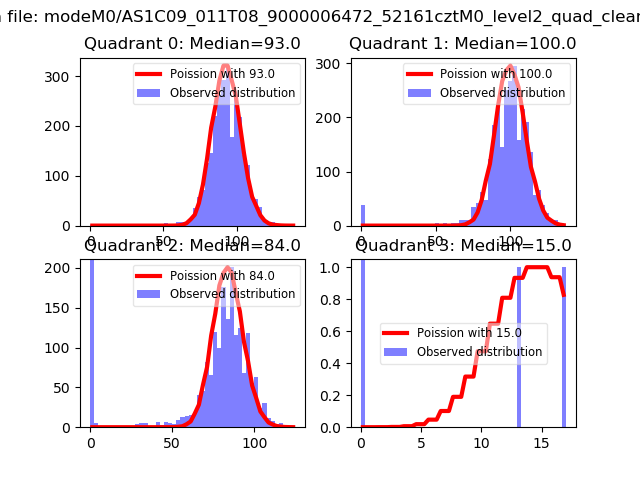 |
 |
| Quadrant-wise count rates Data is divided into 100 sec bins |
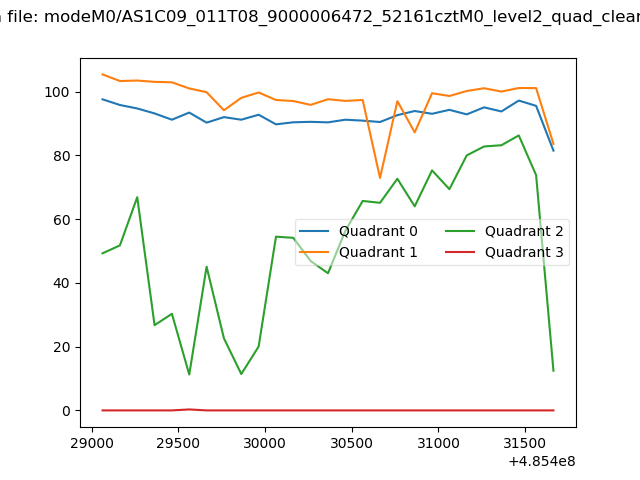 |
|
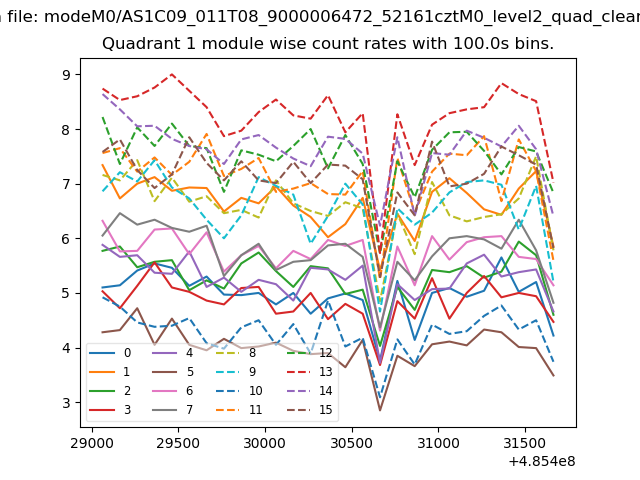
| Module-wise count rates for Quadrant A Data is divided into 100 sec bins |
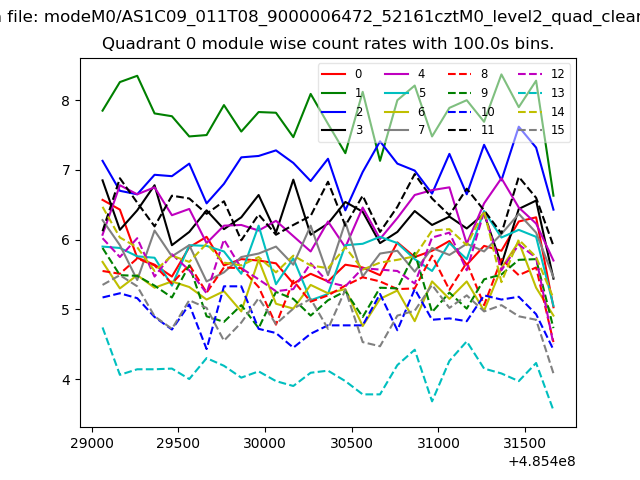 |
 |
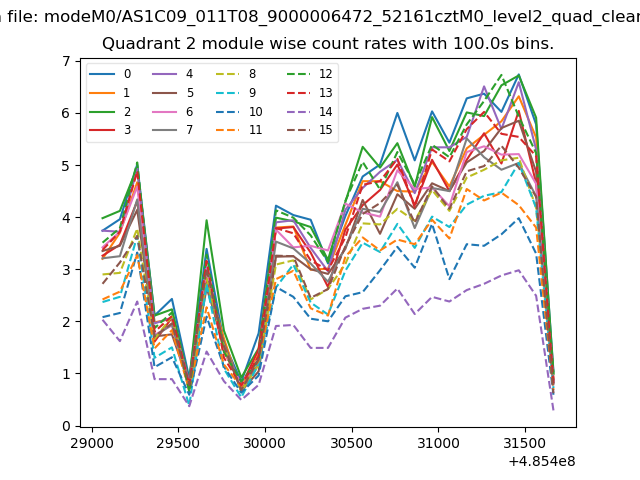
| Module-wise count rates for Quadrant B Data is divided into 100 sec bins |
 |
 |
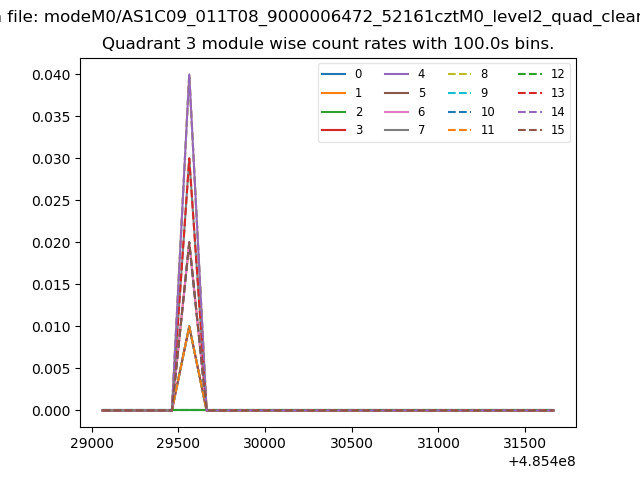
| Module-wise count rates for Quadrant C Data is divided into 100 sec bins |
 |
 |
| Module-wise count rates for Quadrant D Data is divided into 100 sec bins |
 |
 |
| Parameter | Plot |
|---|---|
| CZT HV Monitor | 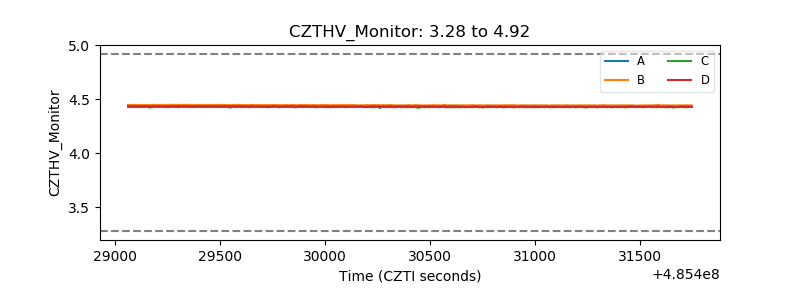 |
| D_VDD | 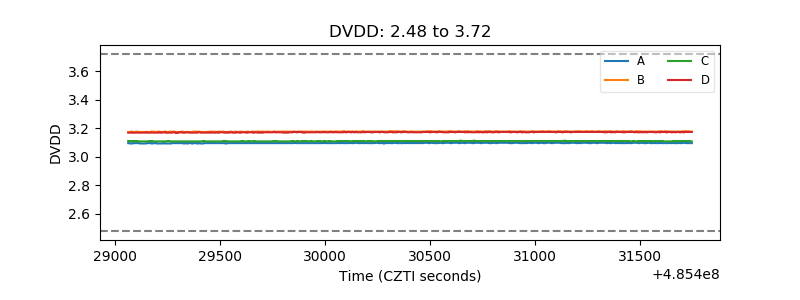 |
| Temperature 1 | 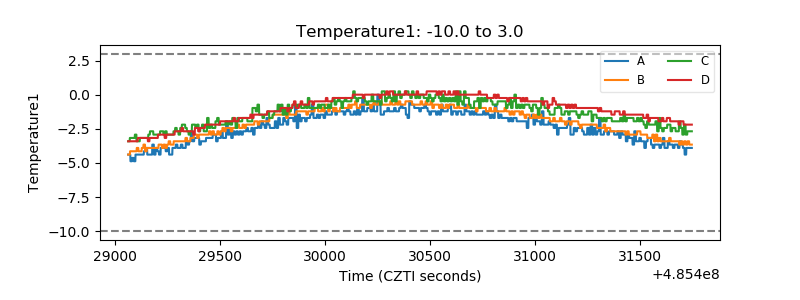 |
| Veto HV Monitor |  |
| Veto LLD | 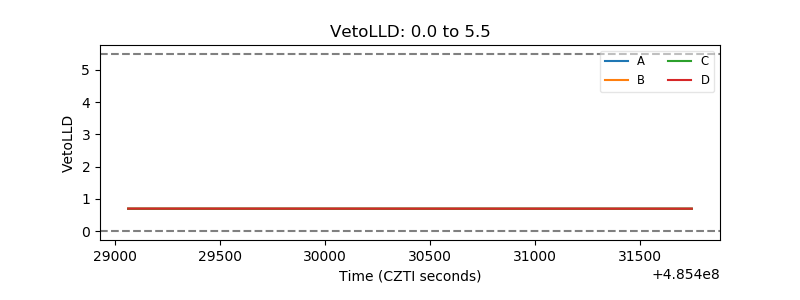 |
| Alpha Counter | 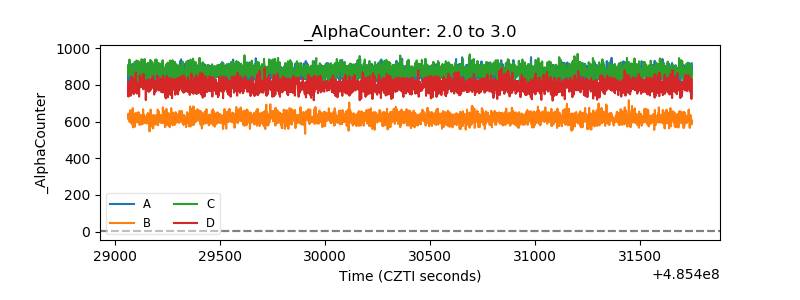 |
| _CPM_Rate | 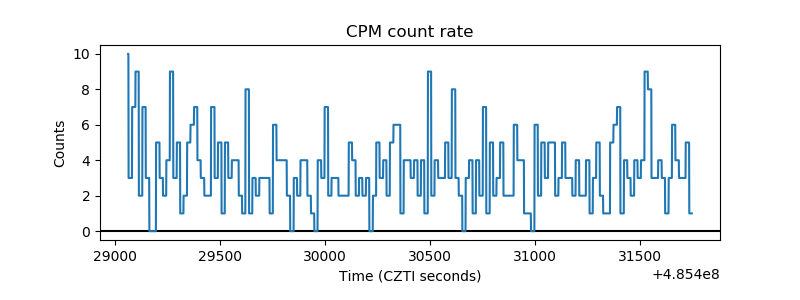 |
| CZT Counter | 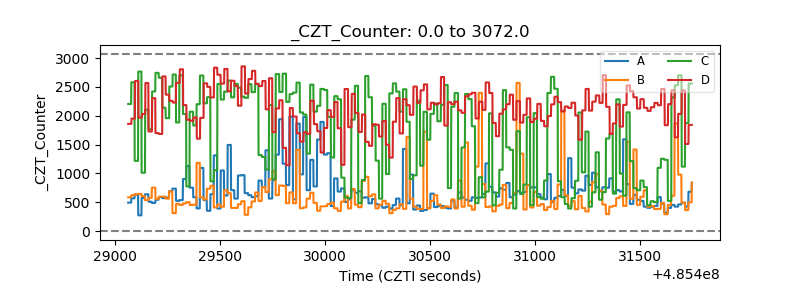 |
| +2.5 Volts monitor |  |
| +5 Volts monitor | 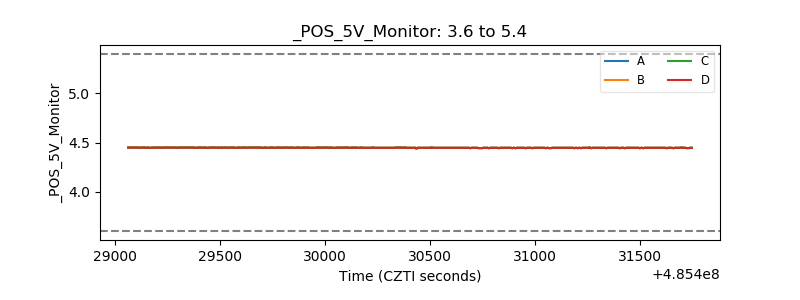 |
| _ROLL_ROT | 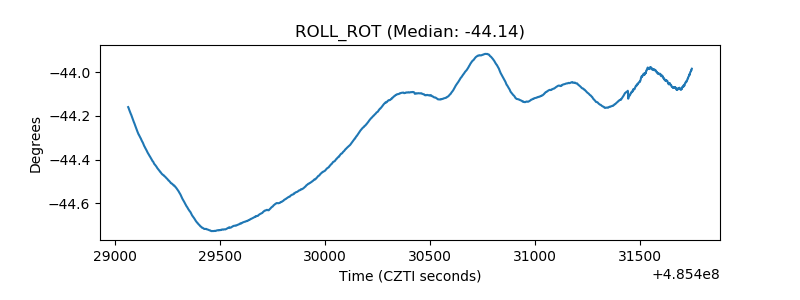 |
| _Roll_DEC | 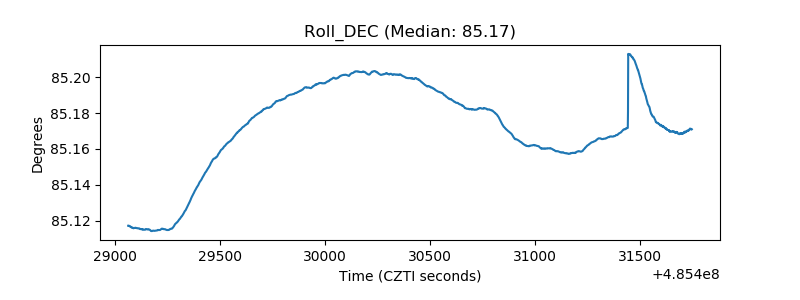 |
| _Roll_RA | 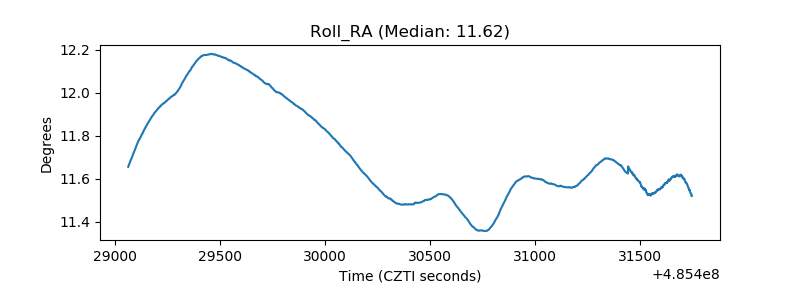 |
| Veto Counter | 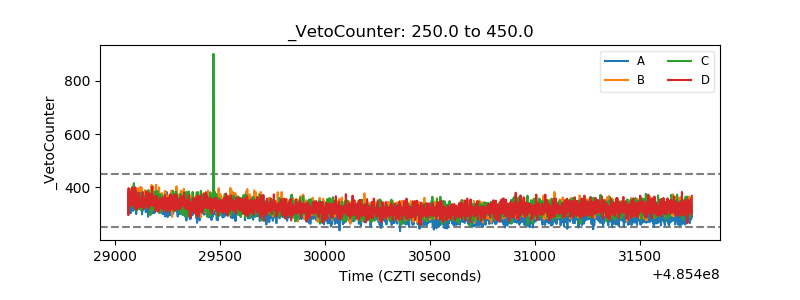 |