| Param | Original file | Final file |
|---|---|---|
| Filename | modeM0/AS1C09_011T08_9000006472_52187cztM0_level2.fits | modeM0/AS1C09_011T08_9000006472_52187cztM0_level2_quad_clean.evt |
| Size (bytes) | 966,913,920 | 69,148,800 |
| Size | 922.1 MB | 65.9 MB |
| Events in quadrant A | 3,949,053 | 595,641 |
| Events in quadrant B | 3,664,807 | 639,437 |
| Events in quadrant C | 12,439,547 | 268,312 |
| Events in quadrant D | 15,232,128 | 133,475 |
| Mode M0 | |||
|---|---|---|---|
| Quadrant | BADHDUFLAG | Total packets | Discarded packets |
| A | 0 | 16116 | 1 |
| B | 0 | 15392 | 1 |
| C | 0 | 41504 | 1 |
| D | 0 | 49761 | 8 |
| Mode M9 | |||
|---|---|---|---|
| Quadrant | BADHDUFLAG | Total packets | Discarded packets |
| A | 0 | 8 | 0 |
| B | 0 | 8 | 0 |
| C | 0 | 8 | 0 |
| D | 0 | 8 | 0 |
| Mode SS | |||
|---|---|---|---|
| Quadrant | BADHDUFLAG | Total packets | Discarded packets |
| A | 0 | 132 | 0 |
| B | 0 | 132 | 0 |
| C | 0 | 132 | 0 |
| D | 0 | 132 | 0 |
| Quadrant | Total seconds | Saturated seconds | Saturation percentage |
|---|---|---|---|
| A | 6546 | 154 | 2.352582% |
| B | 6547 | 127 | 1.939820% |
| C | 6547 | 3808 | 58.164045% |
| D | 6545 | 5255 | 80.290298% |
Noise dominated data is calculated using 1-second bins in cleaned event files. If a bin has >2000 counts, and if more than 50% of those come from <1% of pixels, then it is considered to be noise-dominated and hence unusable.
| Quadrant | # 1 sec bins | Bins with >0 counts | Bins with >2000 counts | High rate bins dominated by noise | Noise dominated (total time) | Noise dominated (detector-on time) | Marked lightcurve |
|---|---|---|---|---|---|---|---|
| A | 7326 | 6547 | 96 | 96 | 1.31% | 1.47% | 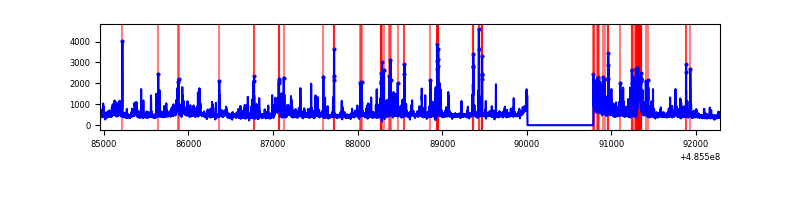 |
| B | 7327 | 6548 | 54 | 54 | 0.74% | 0.82% | 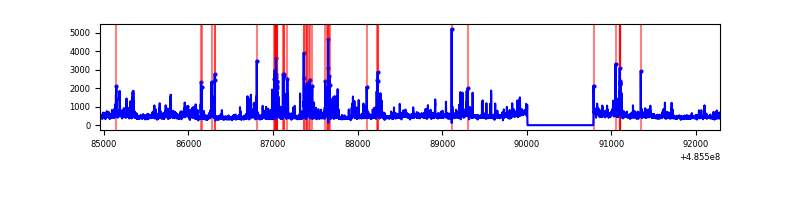 |
| C | 7327 | 6548 | 3097 | 3097 | 42.27% | 47.30% | 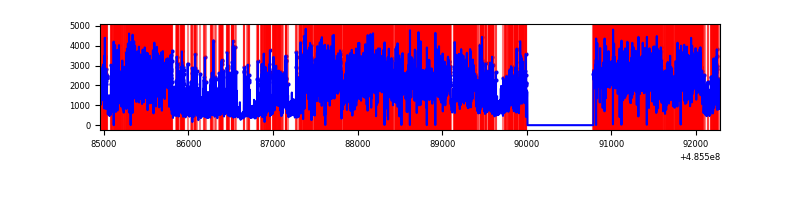 |
| D | 7326 | 6547 | 4650 | 4650 | 63.47% | 71.02% | 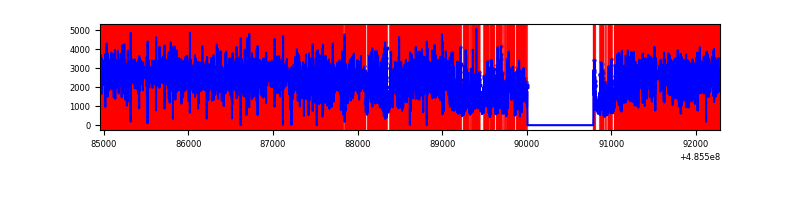 |
Top three noisy pixels from each quadrant. If the there are fewer than three noisy pixels in the level2.evt file, extra rows are filled as -1
| Pixel properties | Quadrant properties | ||||||
|---|---|---|---|---|---|---|---|
| Quadrant | DetID | PixID | Counts | Sigma | Mean | Median | Sigma |
| A | 4 | 95 | 386658 | 2290.02 | 677 | 661 | 168.6 |
| A | 3 | 114 | 248539 | 1470.6 | 677 | 661 | 168.6 |
| A | 3 | 95 | 119189 | 703.2 | 677 | 661 | 168.6 |
| B | 4 | 81 | 260572 | 1807.58 | 671 | 648 | 143.8 |
| B | 4 | 206 | 117737 | 814.27 | 671 | 648 | 143.8 |
| B | 0 | 213 | 92664 | 639.9 | 671 | 648 | 143.8 |
| C | 15 | 248 | 7530016 | 60433.22 | 446 | 442 | 124.6 |
| C | 15 | 224 | 2398269 | 19245.23 | 446 | 442 | 124.6 |
| C | 12 | 252 | 290467 | 2327.77 | 446 | 442 | 124.6 |
| D | 6 | 42 | 8303462 | 75009.38 | 383 | 365 | 110.7 |
| D | 15 | 93 | 2064412 | 18646.4 | 383 | 365 | 110.7 |
| D | 12 | 17 | 1031942 | 9319.17 | 383 | 365 | 110.7 |
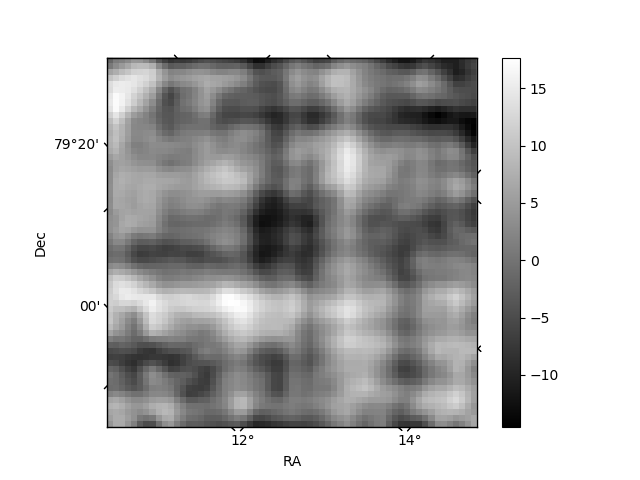
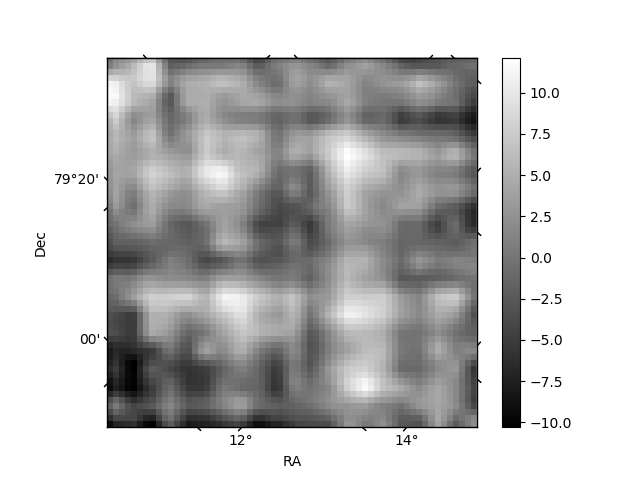
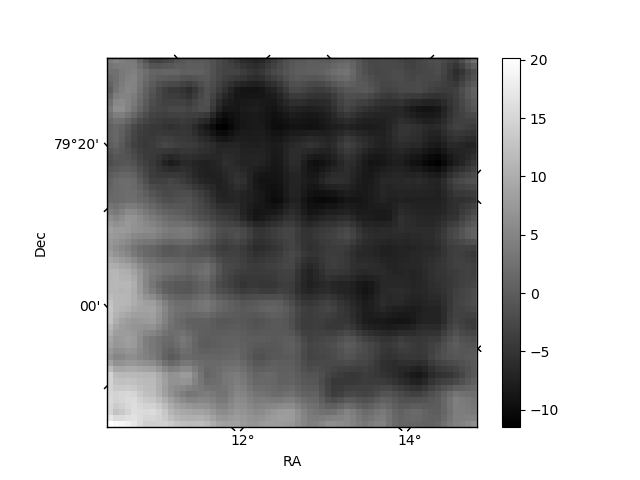
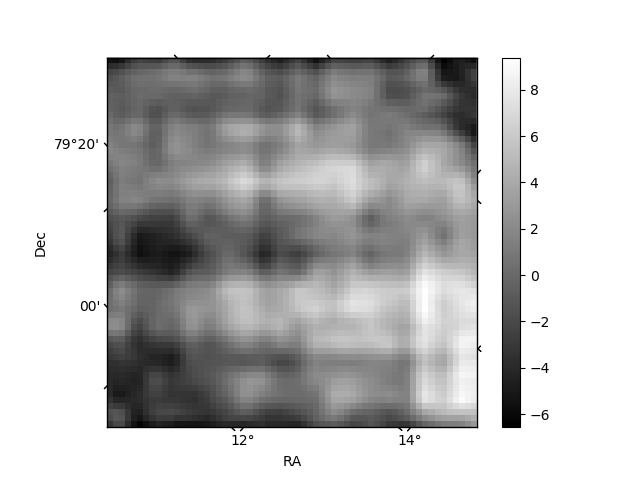
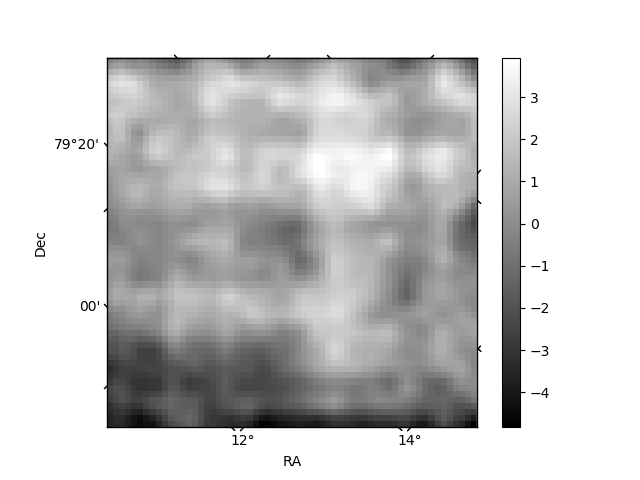
Histogram calculated using DETX and DETY for each event in the final _common_clean file
| Quadrant A | 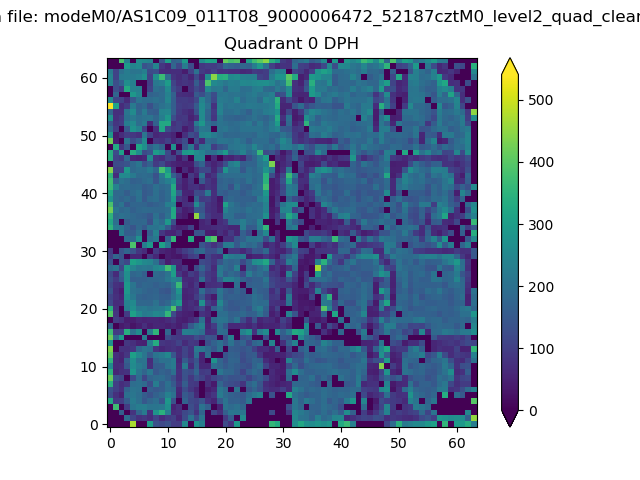 |
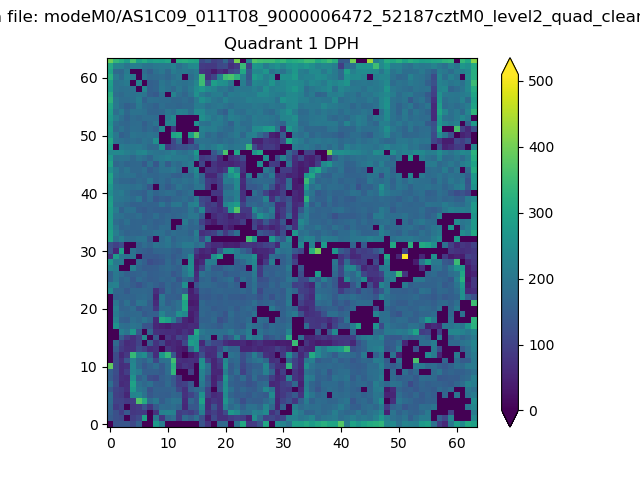 |
Quadrant B |
|---|---|---|---|
| Quadrant D | 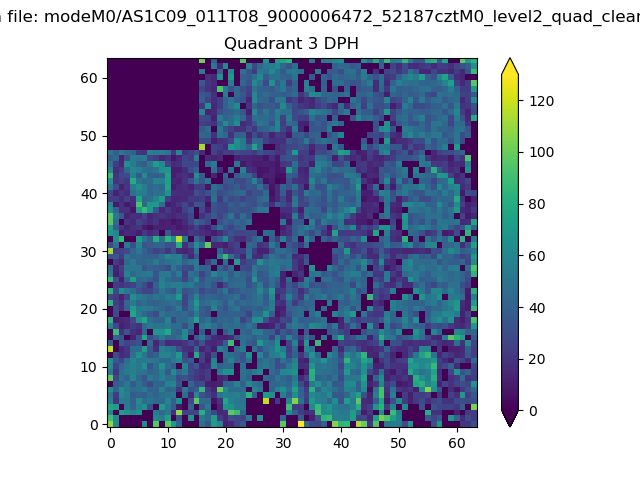 |
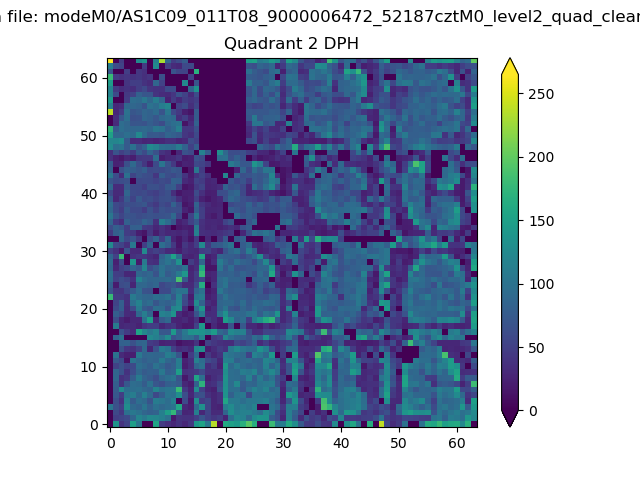 |
Quadrant C |
| Plot type | Count rate plots | Images |
|---|---|---|
| Comparison with Poisson distribution Blue bars denote a histogram of data divided into 1 sec bins. Red curve is a Poisson curve with rate = median count rate of data. |
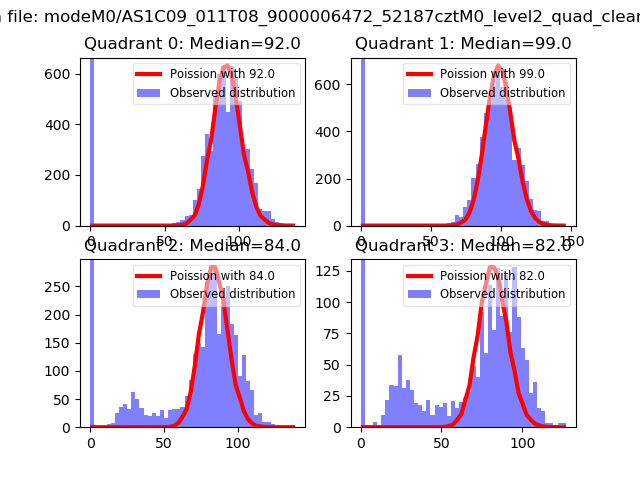 |
 |
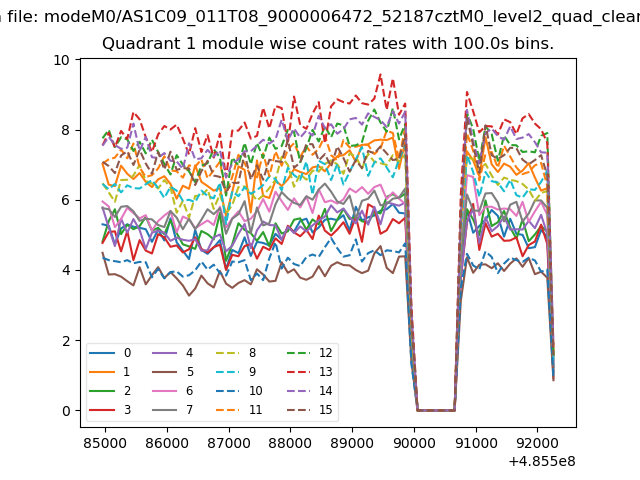
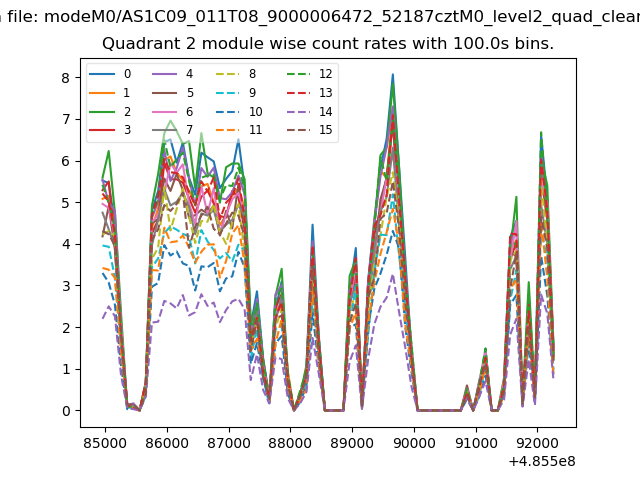
| Quadrant-wise count rates Data is divided into 100 sec bins |
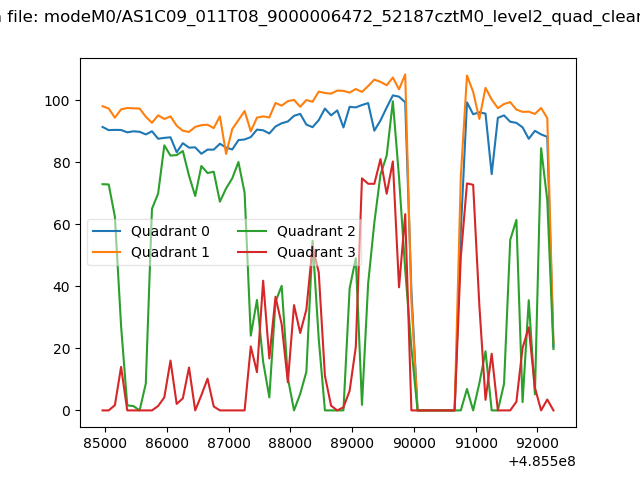 |
|
| Module-wise count rates for Quadrant A Data is divided into 100 sec bins |
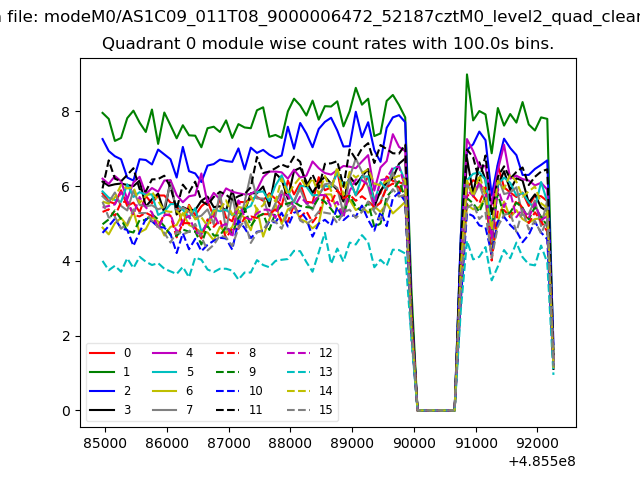 |
 |
| Module-wise count rates for Quadrant B Data is divided into 100 sec bins |
 |
 |
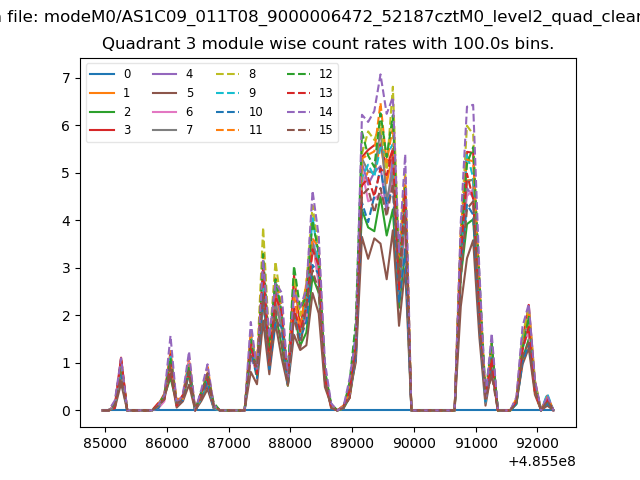
| Module-wise count rates for Quadrant C Data is divided into 100 sec bins |
 |
 |
| Module-wise count rates for Quadrant D Data is divided into 100 sec bins |
 |
 |
| Parameter | Plot |
|---|---|
| CZT HV Monitor | 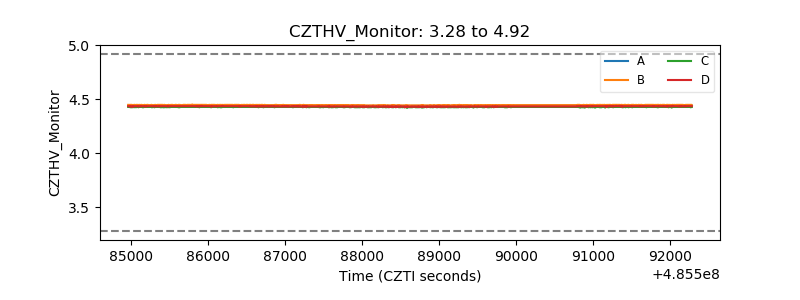 |
| D_VDD | 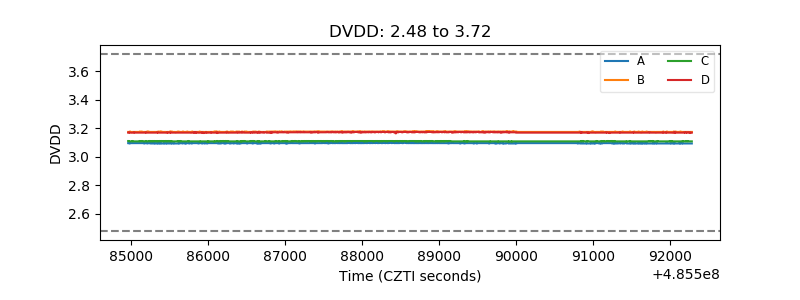 |
| Temperature 1 | 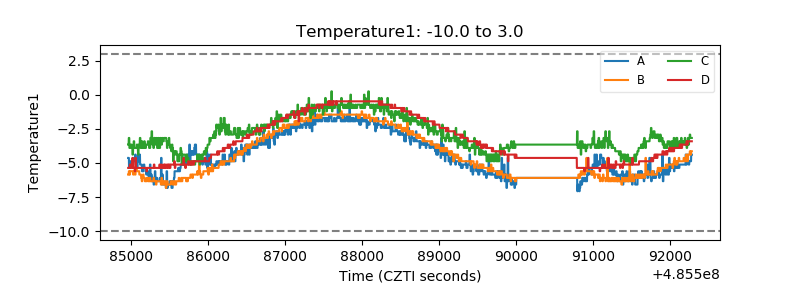 |
| Veto HV Monitor | 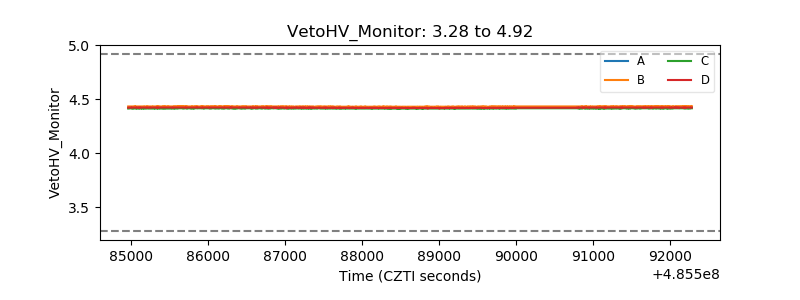 |
| Veto LLD | 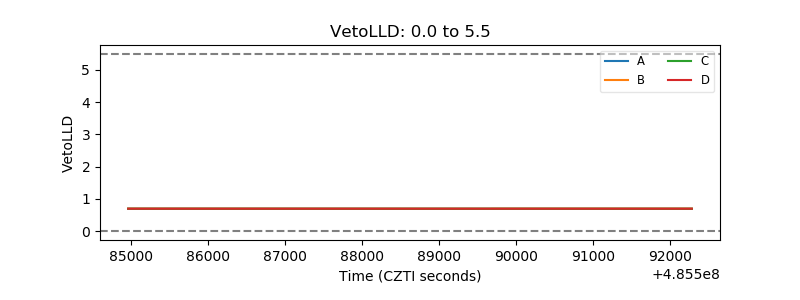 |
| Alpha Counter | 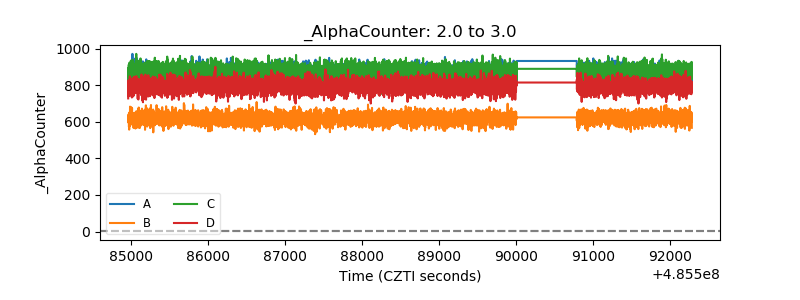 |
| _CPM_Rate | 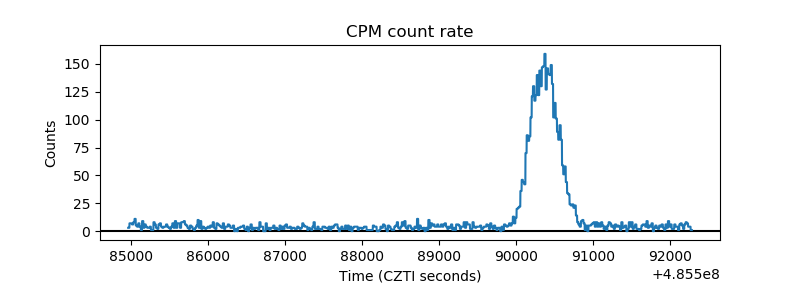 |
| CZT Counter | 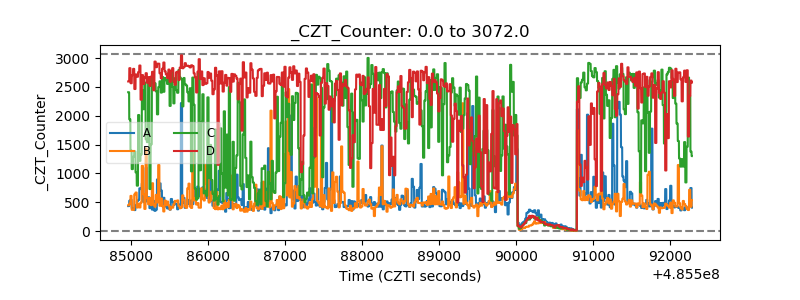 |
| +2.5 Volts monitor |  |
| +5 Volts monitor |  |
| _ROLL_ROT | 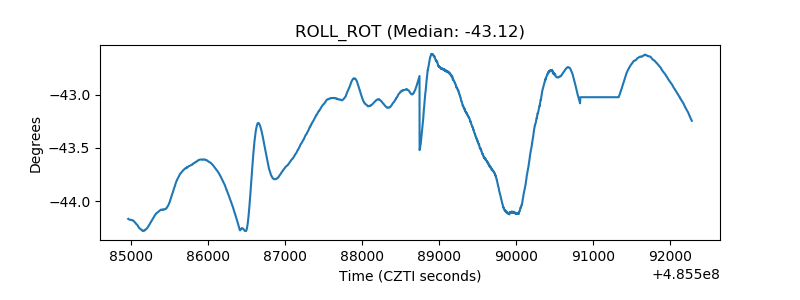 |
| _Roll_DEC | 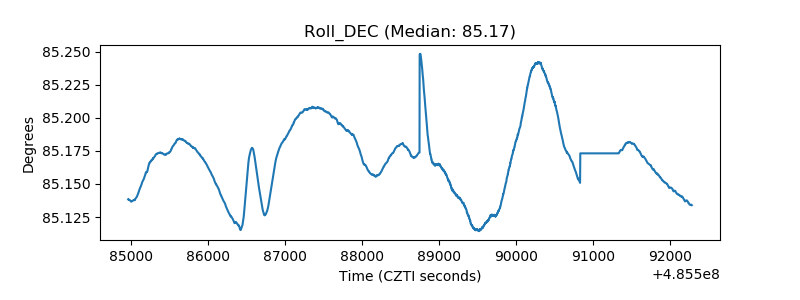 |
| _Roll_RA | 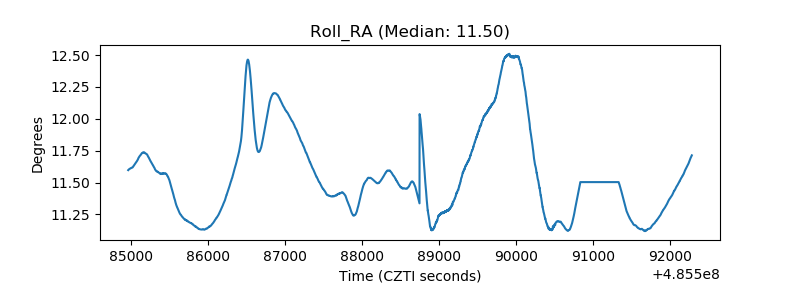 |
| Veto Counter | 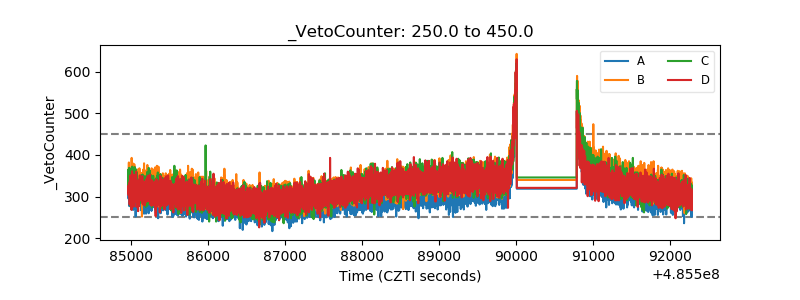 |