| Param | Original file | Final file |
|---|---|---|
| Filename | modeM0/AS1C09_011T08_9000006472_52217cztM0_level2.fits | modeM0/AS1C09_011T08_9000006472_52217cztM0_level2_quad_clean.evt |
| Size (bytes) | 841,406,400 | 74,168,640 |
| Size | 802.4 MB | 70.7 MB |
| Events in quadrant A | 4,585,324 | 565,285 |
| Events in quadrant B | 5,356,708 | 597,221 |
| Events in quadrant C | 6,877,644 | 479,642 |
| Events in quadrant D | 13,843,112 | 166,438 |
| Mode M0 | |||
|---|---|---|---|
| Quadrant | BADHDUFLAG | Total packets | Discarded packets |
| A | 0 | 17976 | 1 |
| B | 0 | 20178 | 1 |
| C | 0 | 24737 | 2 |
| D | 0 | 45462 | 1 |
| Mode M9 | |||
|---|---|---|---|
| Quadrant | BADHDUFLAG | Total packets | Discarded packets |
| A | 0 | 9 | 0 |
| B | 0 | 9 | 0 |
| C | 0 | 9 | 0 |
| D | 0 | 9 | 0 |
| Mode SS | |||
|---|---|---|---|
| Quadrant | BADHDUFLAG | Total packets | Discarded packets |
| A | 0 | 128 | 0 |
| B | 0 | 128 | 0 |
| C | 0 | 128 | 0 |
| D | 0 | 128 | 0 |
| Quadrant | Total seconds | Saturated seconds | Saturation percentage |
|---|---|---|---|
| A | 6251 | 296 | 4.735242% |
| B | 6252 | 438 | 7.005758% |
| C | 6251 | 1156 | 18.493041% |
| D | 6251 | 4542 | 72.660374% |
Noise dominated data is calculated using 1-second bins in cleaned event files. If a bin has >2000 counts, and if more than 50% of those come from <1% of pixels, then it is considered to be noise-dominated and hence unusable.
| Quadrant | # 1 sec bins | Bins with >0 counts | Bins with >2000 counts | High rate bins dominated by noise | Noise dominated (total time) | Noise dominated (detector-on time) | Marked lightcurve |
|---|---|---|---|---|---|---|---|
| A | 7176 | 6252 | 238 | 238 | 3.32% | 3.81% | 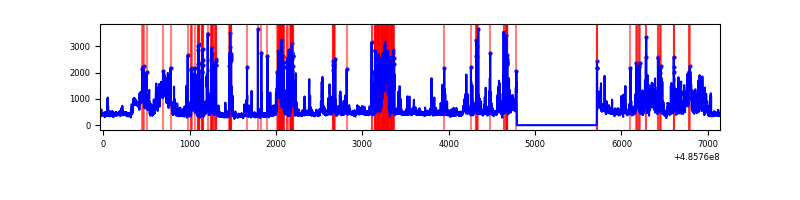 |
| B | 7177 | 6252 | 312 | 312 | 4.35% | 4.99% | 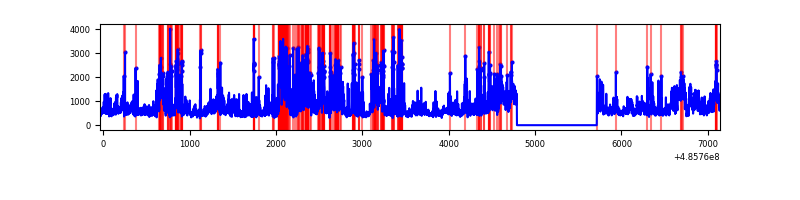 |
| C | 7175 | 6251 | 990 | 990 | 13.80% | 15.84% | 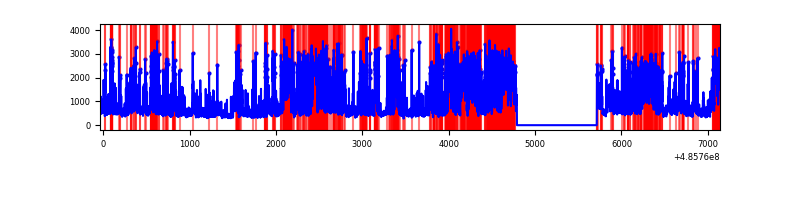 |
| D | 7176 | 6251 | 4378 | 4378 | 61.01% | 70.04% | 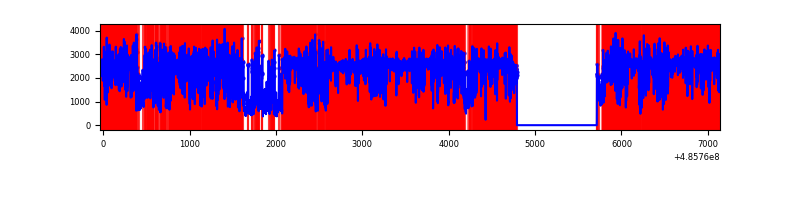 |
Top three noisy pixels from each quadrant. If the there are fewer than three noisy pixels in the level2.evt file, extra rows are filled as -1
| Pixel properties | Quadrant properties | ||||||
|---|---|---|---|---|---|---|---|
| Quadrant | DetID | PixID | Counts | Sigma | Mean | Median | Sigma |
| A | 12 | 3 | 716399 | 4398.17 | 644 | 626 | 162.7 |
| A | 14 | 254 | 550952 | 3381.55 | 644 | 626 | 162.7 |
| A | 4 | 158 | 163548 | 1001.1 | 644 | 626 | 162.7 |
| B | 10 | 254 | 1296730 | 9770.16 | 629 | 610 | 132.7 |
| B | 5 | 32 | 729950 | 5497.77 | 629 | 610 | 132.7 |
| B | 10 | 44 | 323164 | 2431.41 | 629 | 610 | 132.7 |
| C | 15 | 224 | 2495351 | 15425.51 | 583 | 579 | 161.7 |
| C | 15 | 231 | 1207393 | 7461.89 | 583 | 579 | 161.7 |
| C | 13 | 3 | 274806 | 1695.58 | 583 | 579 | 161.7 |
| D | 6 | 42 | 7667537 | 65319.42 | 397 | 378 | 117.4 |
| D | 15 | 93 | 3096432 | 26376.45 | 397 | 378 | 117.4 |
| D | 8 | 176 | 606339 | 5162.41 | 397 | 378 | 117.4 |
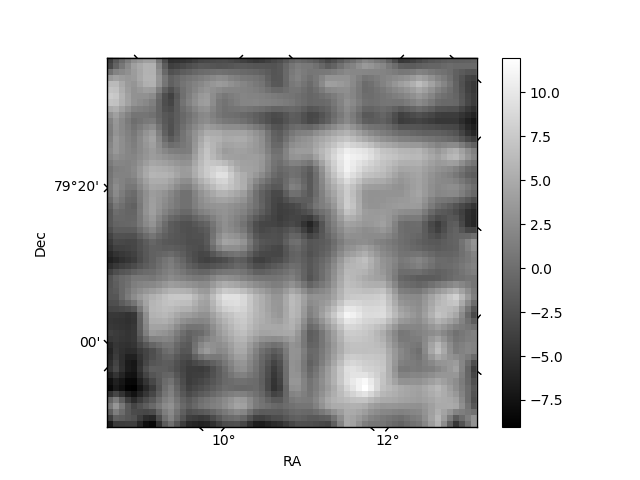
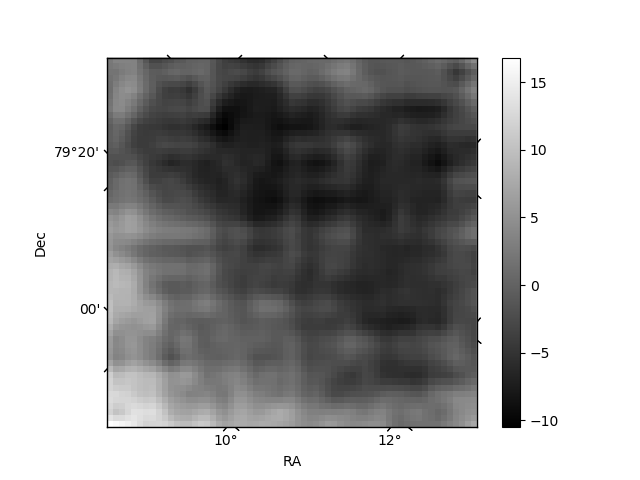
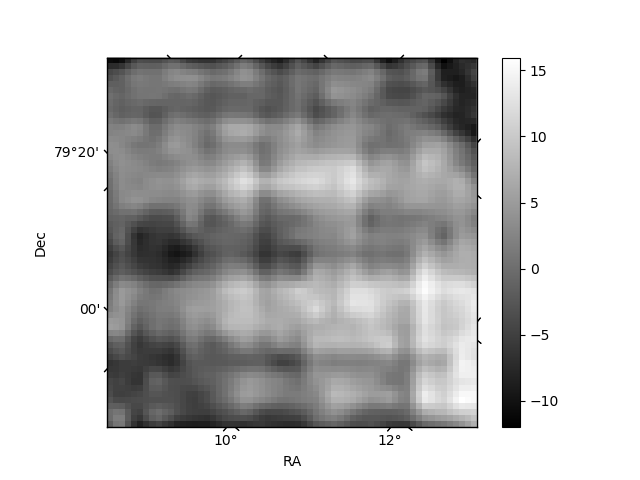
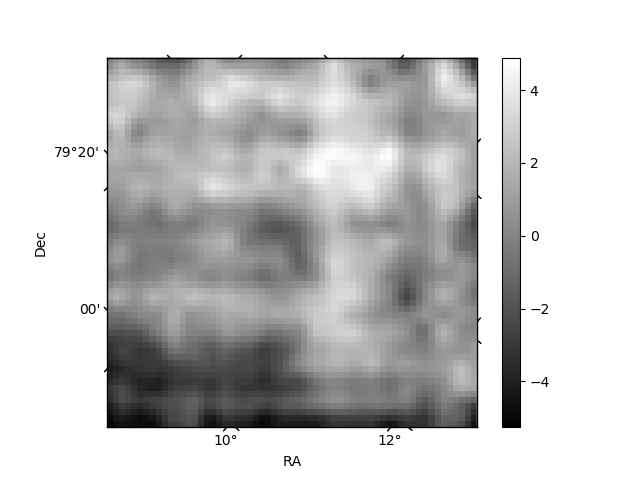
Histogram calculated using DETX and DETY for each event in the final _common_clean file
| Quadrant A | 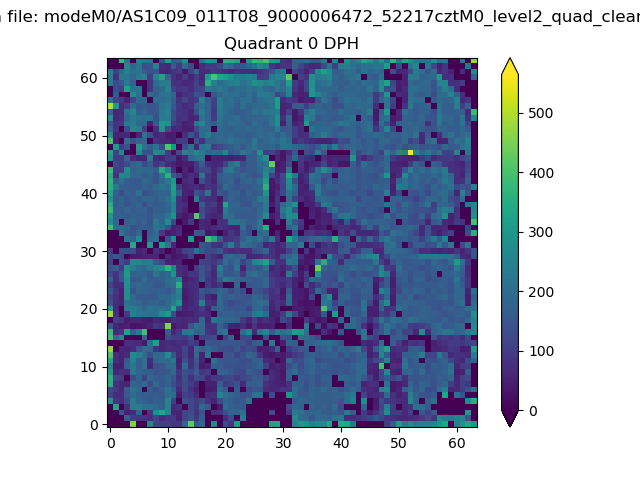 |
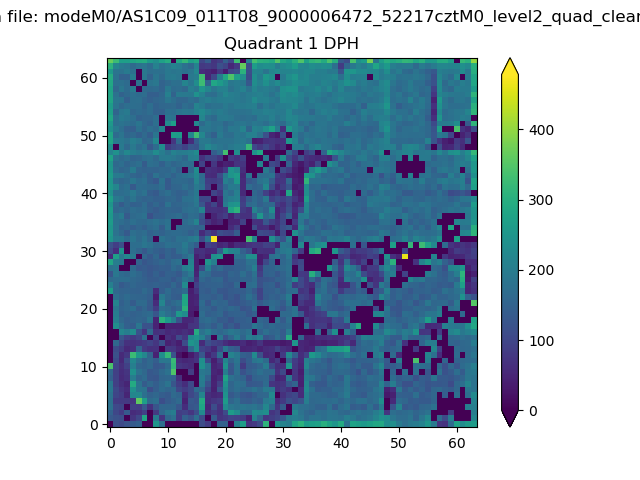 |
Quadrant B |
|---|---|---|---|
| Quadrant D | 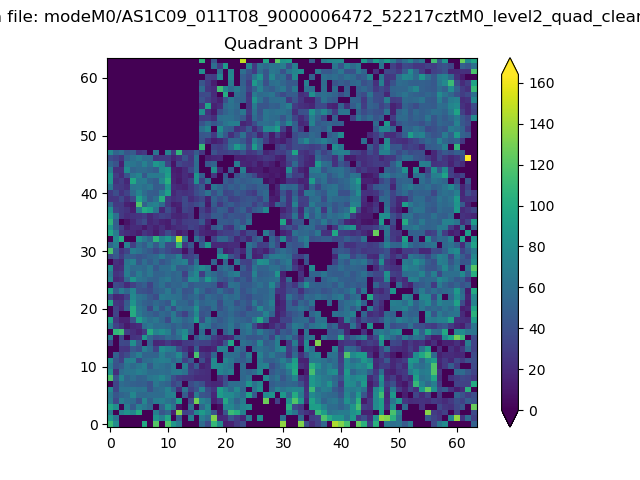 |
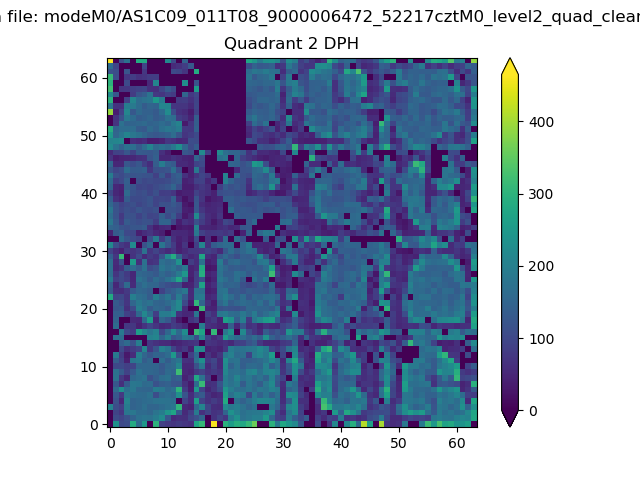 |
Quadrant C |
| Plot type | Count rate plots | Images |
|---|---|---|
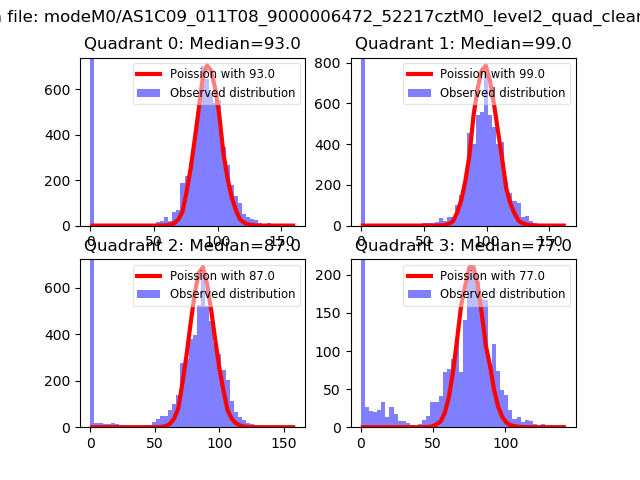
| Comparison with Poisson distribution Blue bars denote a histogram of data divided into 1 sec bins. Red curve is a Poisson curve with rate = median count rate of data. |
 |
 |
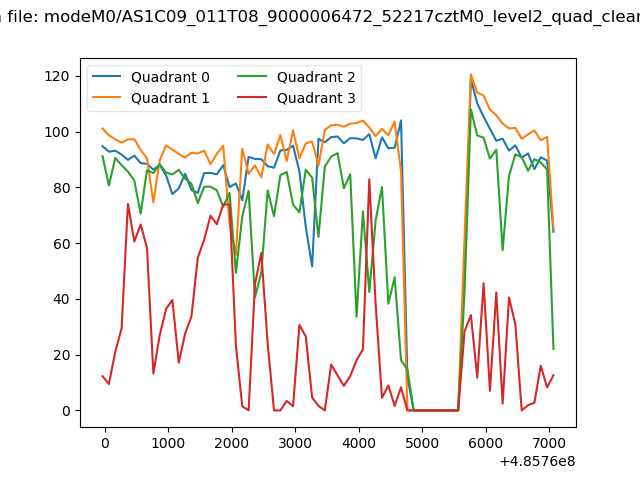
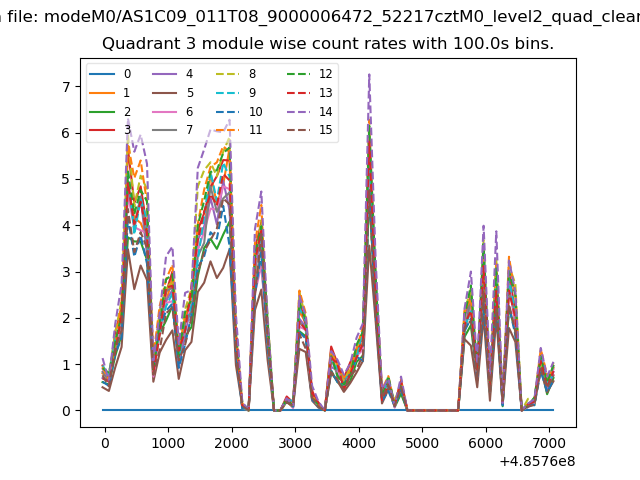
| Quadrant-wise count rates Data is divided into 100 sec bins |
 |
|
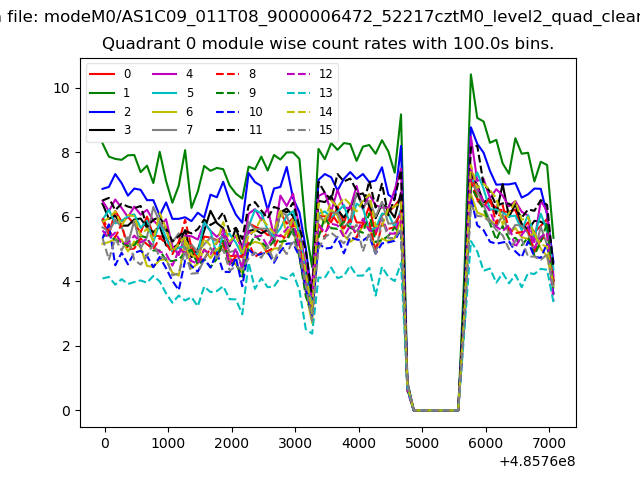
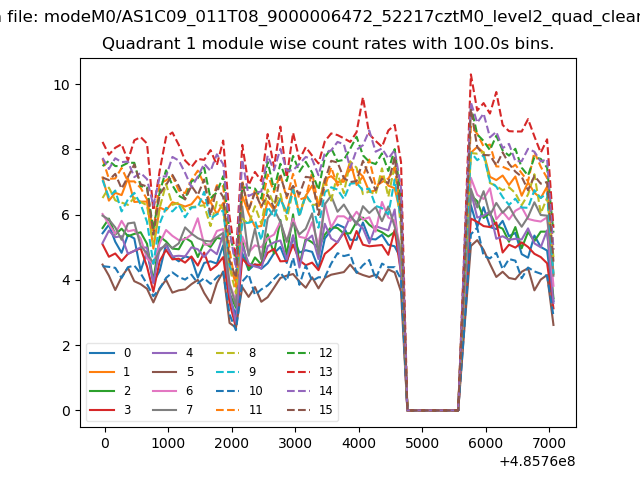
| Module-wise count rates for Quadrant A Data is divided into 100 sec bins |
 |
 |
| Module-wise count rates for Quadrant B Data is divided into 100 sec bins |
 |
 |
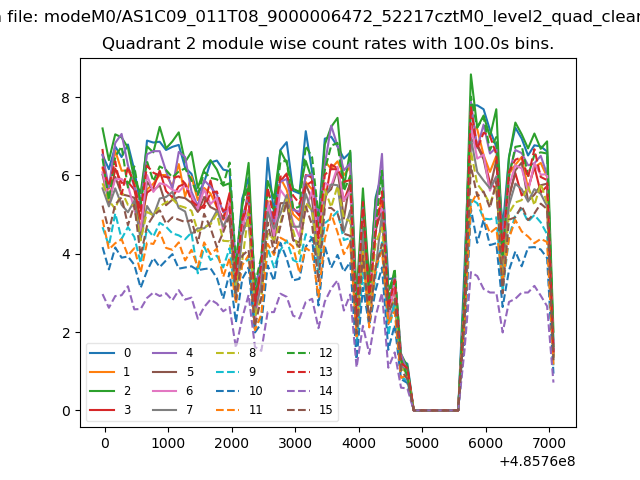
| Module-wise count rates for Quadrant C Data is divided into 100 sec bins |
 |
 |
| Module-wise count rates for Quadrant D Data is divided into 100 sec bins |
 |
 |
| Parameter | Plot |
|---|---|
| CZT HV Monitor | 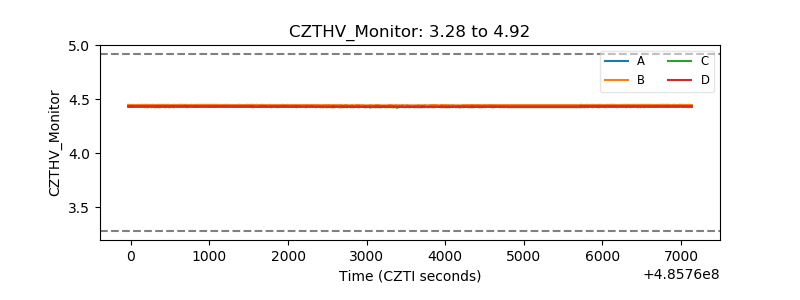 |
| D_VDD | 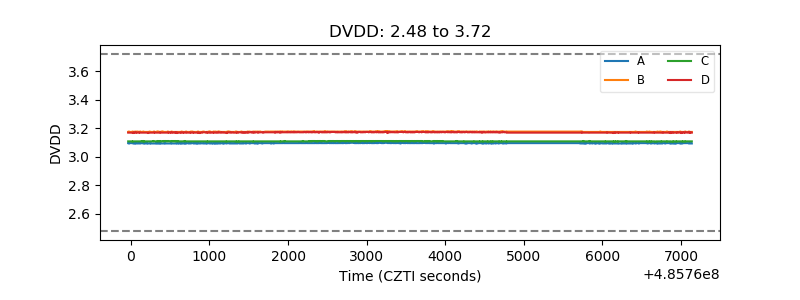 |
| Temperature 1 | 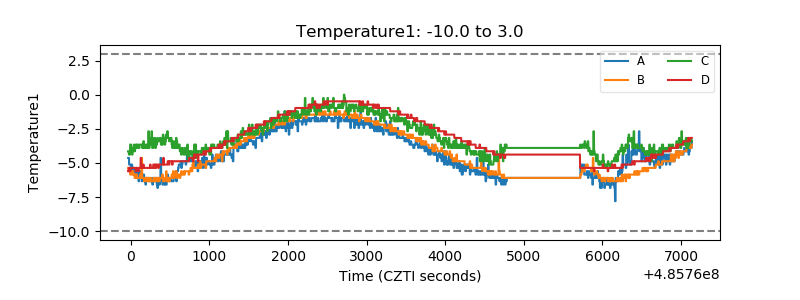 |
| Veto HV Monitor | 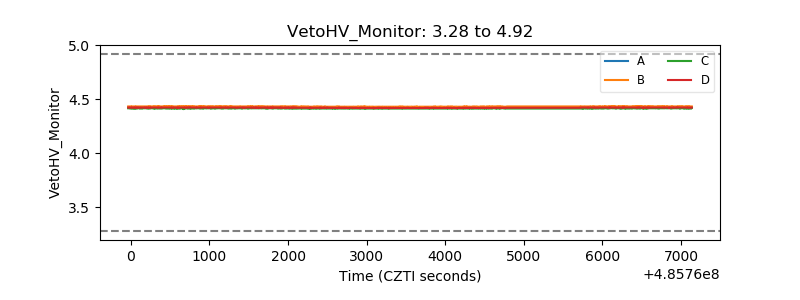 |
| Veto LLD | 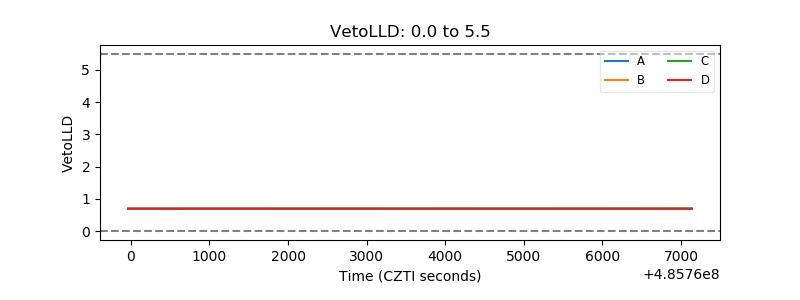 |
| Alpha Counter | 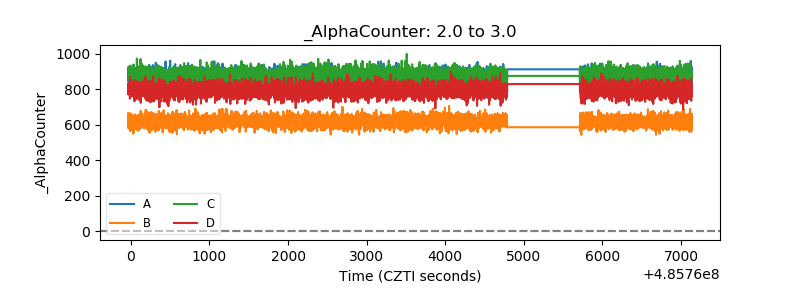 |
| _CPM_Rate | 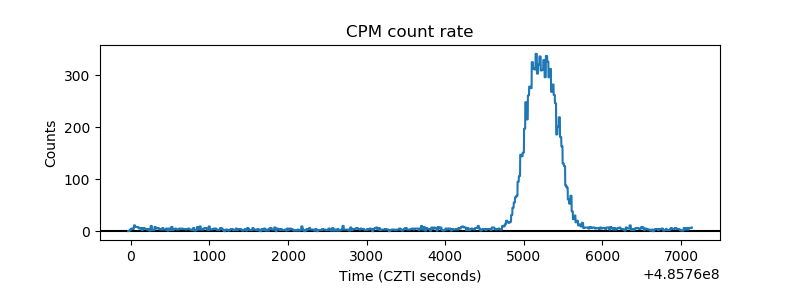 |
| CZT Counter | 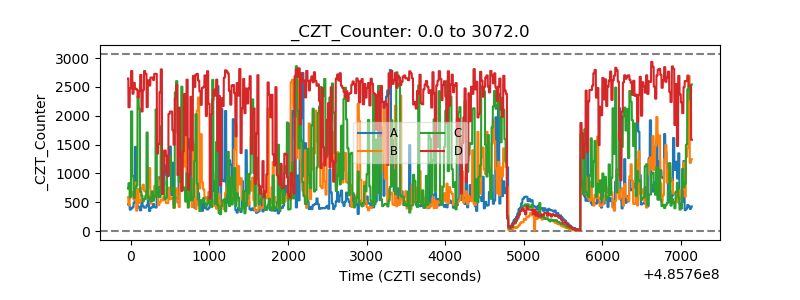 |
| +2.5 Volts monitor |  |
| +5 Volts monitor |  |
| _ROLL_ROT | 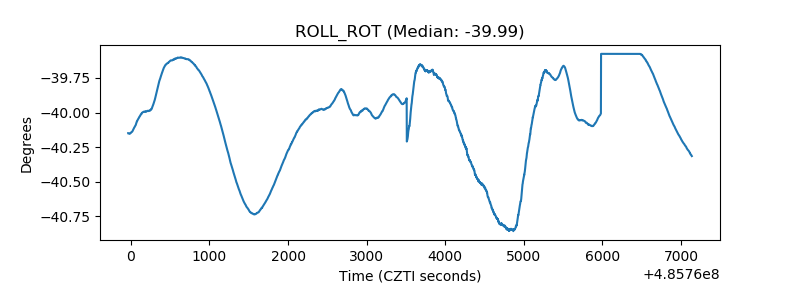 |
| _Roll_DEC | 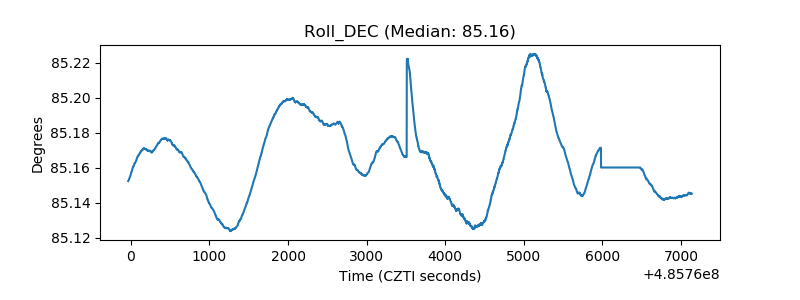 |
| _Roll_RA | 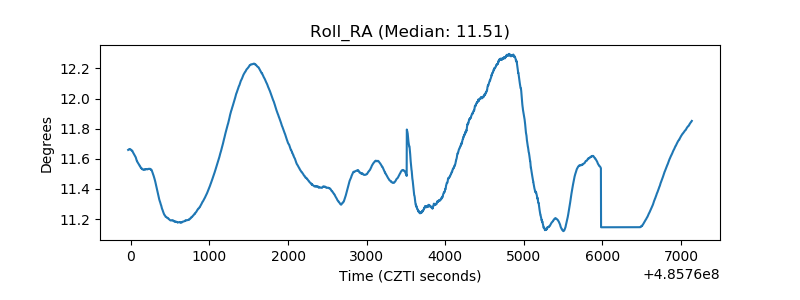 |
| Veto Counter | 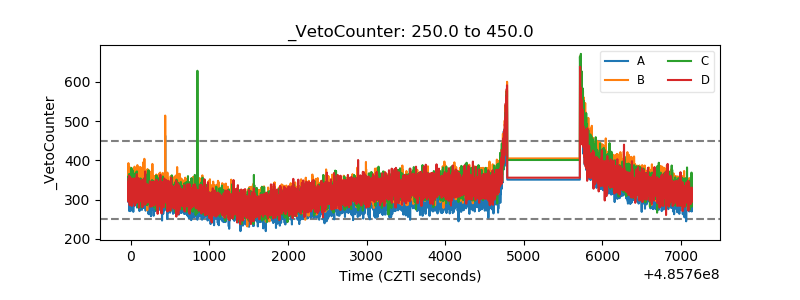 |