| Param | Original file | Final file |
|---|---|---|
| Filename | modeM0/AS1A13_037T01_9000006476_52422cztM0_level2.fits | modeM0/AS1A13_037T01_9000006476_52422cztM0_level2_quad_clean.evt |
| Size (bytes) | 850,481,280 | 67,708,800 |
| Size | 811.1 MB | 64.6 MB |
| Events in quadrant A | 3,295,503 | 615,360 |
| Events in quadrant B | 3,290,508 | 660,160 |
| Events in quadrant C | 12,047,034 | 318,919 |
| Events in quadrant D | 12,342,474 | 1,542 |
| Mode M9 | |||
|---|---|---|---|
| Quadrant | BADHDUFLAG | Total packets | Discarded packets |
| A | 0 | 12 | 0 |
| B | 0 | 13 | 0 |
| C | 0 | 13 | 0 |
| D | 0 | 13 | 0 |
| Mode M0 | |||
|---|---|---|---|
| Quadrant | BADHDUFLAG | Total packets | Discarded packets |
| A | 0 | 14782 | 2 |
| B | 0 | 14723 | 2 |
| C | 0 | 40267 | 9 |
| D | 0 | 41163 | 2 |
| Mode SS | |||
|---|---|---|---|
| Quadrant | BADHDUFLAG | Total packets | Discarded packets |
| A | 0 | 130 | 0 |
| B | 0 | 130 | 0 |
| C | 0 | 130 | 0 |
| D | 0 | 130 | 0 |
| Quadrant | Total seconds | Saturated seconds | Saturation percentage |
|---|---|---|---|
| A | 6514 | 95 | 1.458397% |
| B | 6514 | 113 | 1.734725% |
| C | 6513 | 3230 | 49.593121% |
| D | 6513 | 6502 | 99.831107% |
Noise dominated data is calculated using 1-second bins in cleaned event files. If a bin has >2000 counts, and if more than 50% of those come from <1% of pixels, then it is considered to be noise-dominated and hence unusable.
| Quadrant | # 1 sec bins | Bins with >0 counts | Bins with >2000 counts | High rate bins dominated by noise | Noise dominated (total time) | Noise dominated (detector-on time) | Marked lightcurve |
|---|---|---|---|---|---|---|---|
| A | 7573 | 6513 | 62 | 62 | 0.82% | 0.95% | 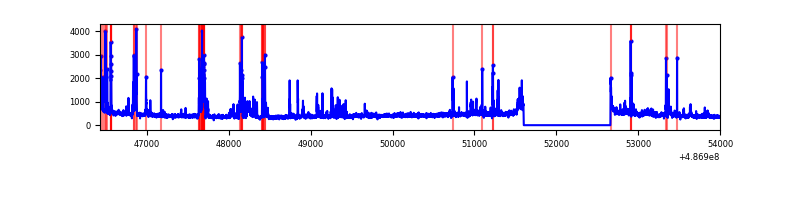 |
| B | 7573 | 6513 | 34 | 34 | 0.45% | 0.52% | 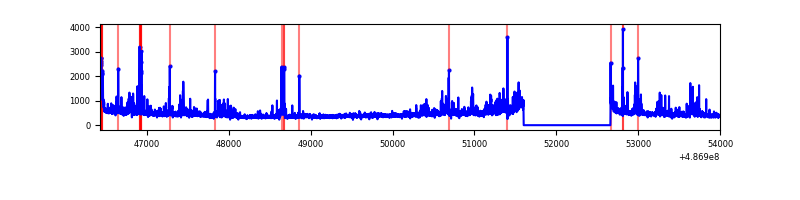 |
| C | 7572 | 6511 | 2963 | 2963 | 39.13% | 45.51% | 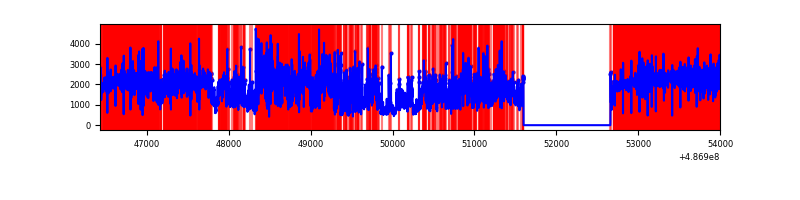 |
| D | 7571 | 6510 | 2541 | 2541 | 33.56% | 39.03% | 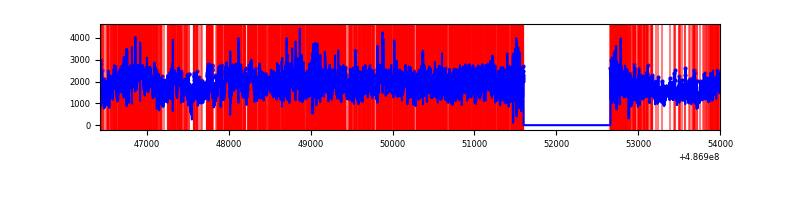 |
Top three noisy pixels from each quadrant. If the there are fewer than three noisy pixels in the level2.evt file, extra rows are filled as -1
| Pixel properties | Quadrant properties | ||||||
|---|---|---|---|---|---|---|---|
| Quadrant | DetID | PixID | Counts | Sigma | Mean | Median | Sigma |
| A | 8 | 25 | 311483 | 1868.91 | 669 | 653 | 166.3 |
| A | 13 | 248 | 78875 | 470.32 | 669 | 653 | 166.3 |
| A | 12 | 3 | 58443 | 347.47 | 669 | 653 | 166.3 |
| B | 4 | 171 | 225199 | 1553.87 | 670 | 646 | 144.5 |
| B | 4 | 81 | 70426 | 482.87 | 670 | 646 | 144.5 |
| B | 10 | 247 | 58586 | 400.93 | 670 | 646 | 144.5 |
| C | 9 | 38 | 4173269 | 29690.58 | 505 | 501 | 140.5 |
| C | 1 | 45 | 2065236 | 14691.25 | 505 | 501 | 140.5 |
| C | 1 | 46 | 884887 | 6292.69 | 505 | 501 | 140.5 |
| D | 12 | 18 | 9904758 | 470534.38 | 65 | 61 | 21.0 |
| D | 12 | 17 | 1612305 | 76591.56 | 65 | 61 | 21.0 |
| D | 12 | 6 | 181861 | 8636.62 | 65 | 61 | 21.0 |
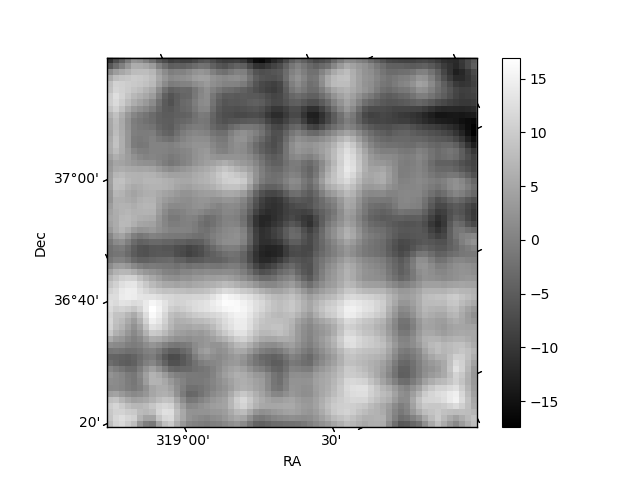
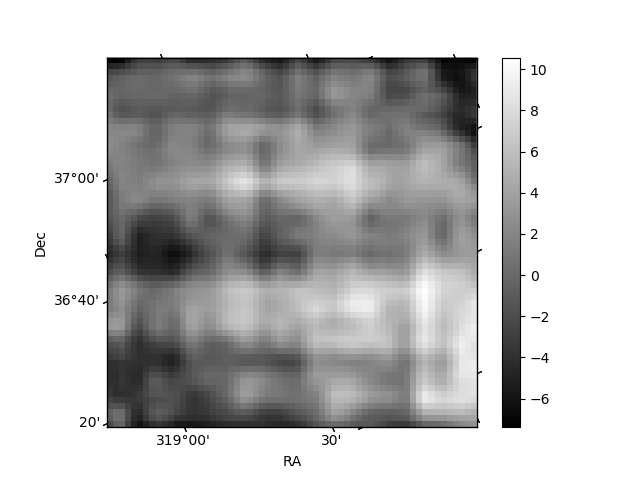
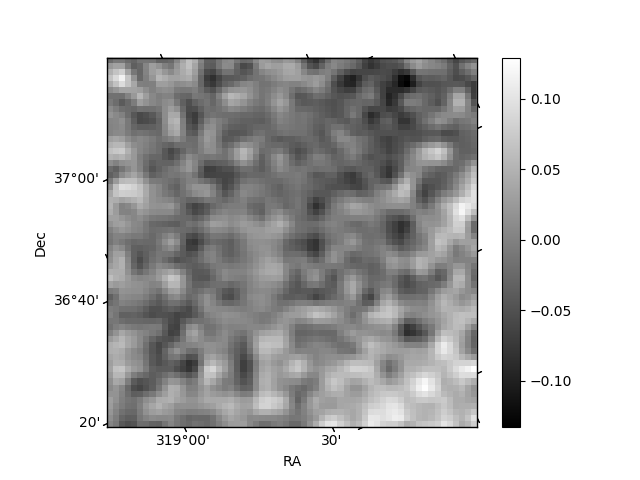
Histogram calculated using DETX and DETY for each event in the final _common_clean file
| Quadrant A | 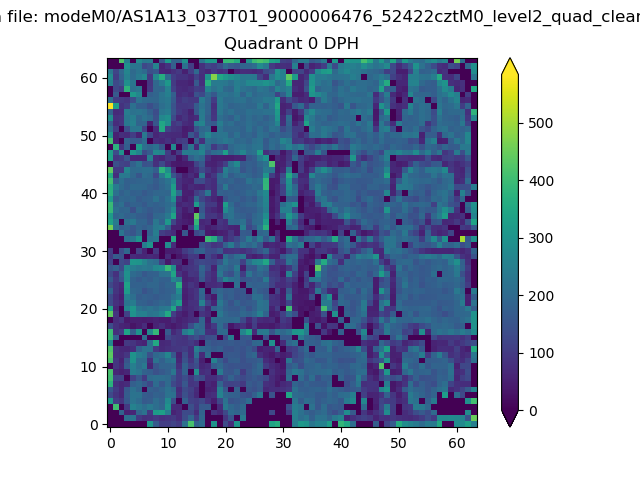 |
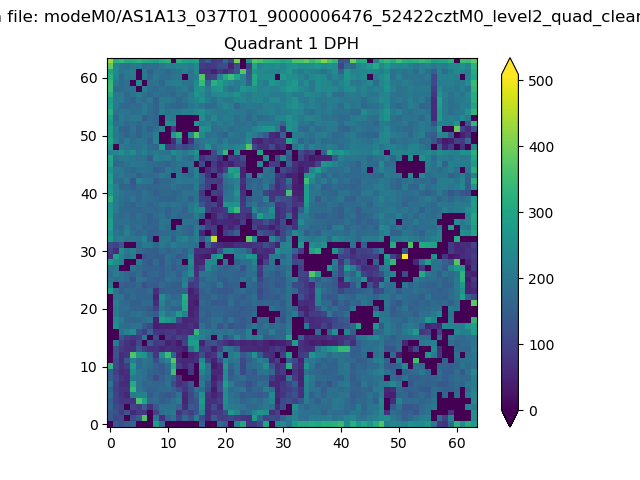 |
Quadrant B |
|---|---|---|---|
| Quadrant D | 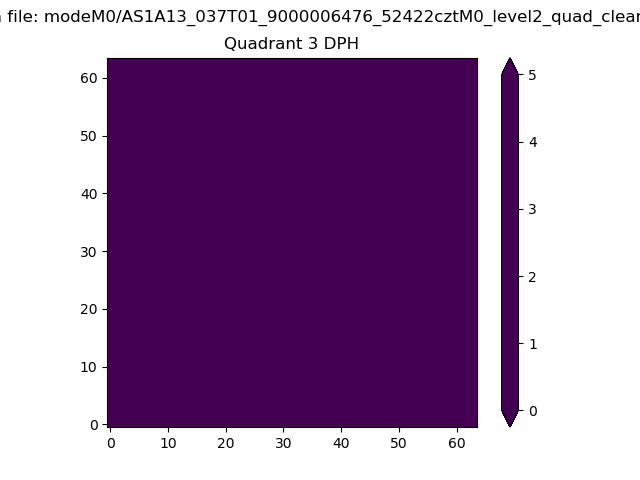 |
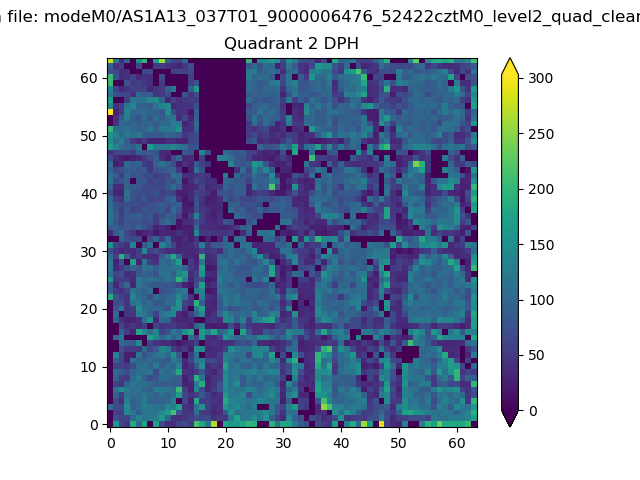 |
Quadrant C |
| Plot type | Count rate plots | Images |
|---|---|---|
| Comparison with Poisson distribution Blue bars denote a histogram of data divided into 1 sec bins. Red curve is a Poisson curve with rate = median count rate of data. |
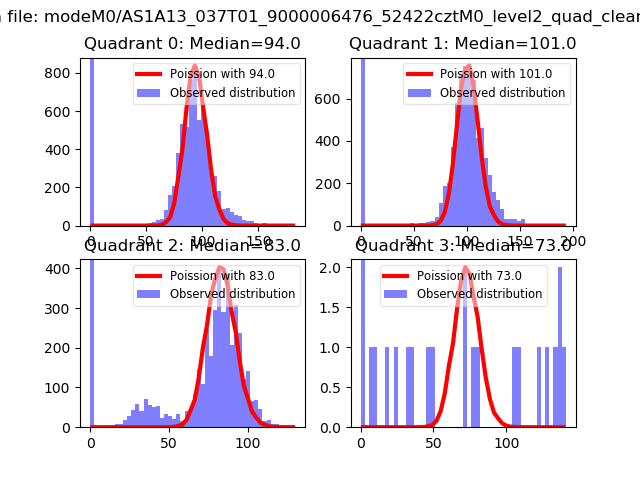 |
 |
| Quadrant-wise count rates Data is divided into 100 sec bins |
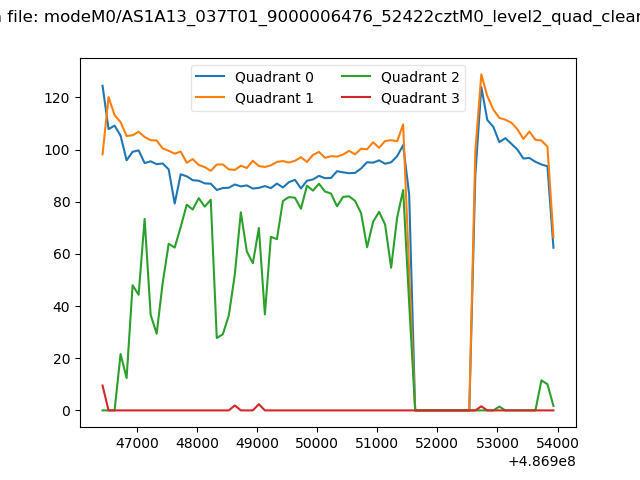 |
|
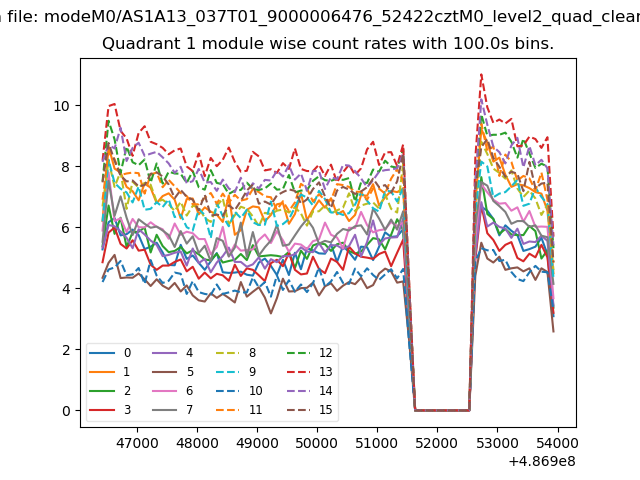
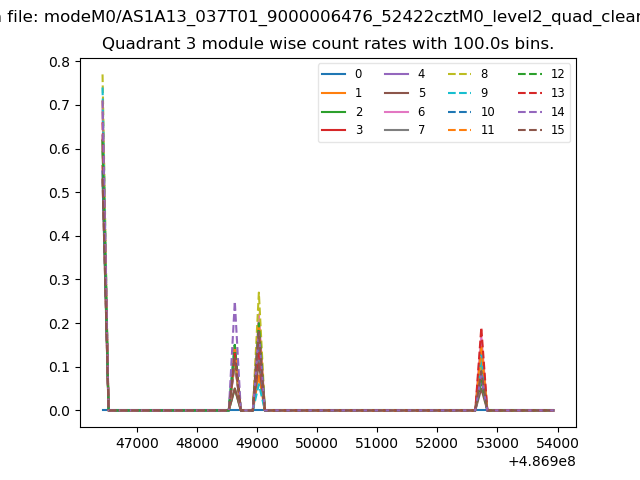
| Module-wise count rates for Quadrant A Data is divided into 100 sec bins |
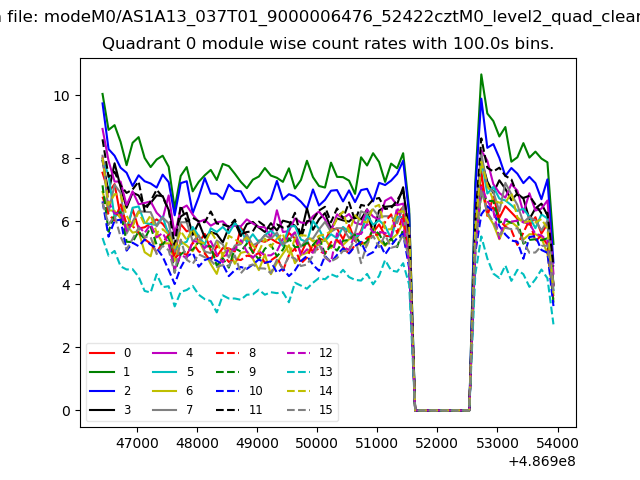 |
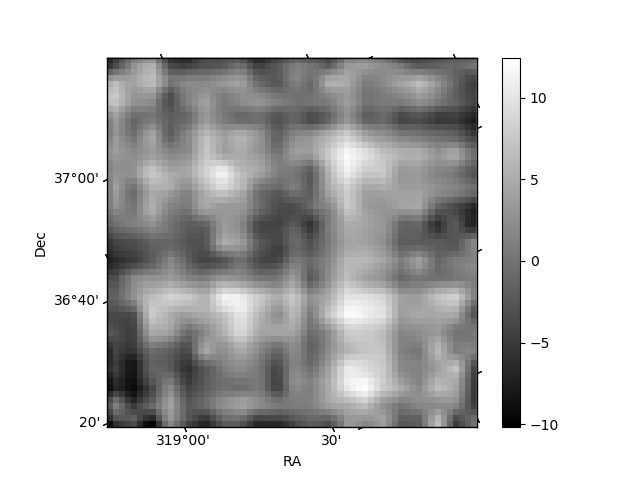 |
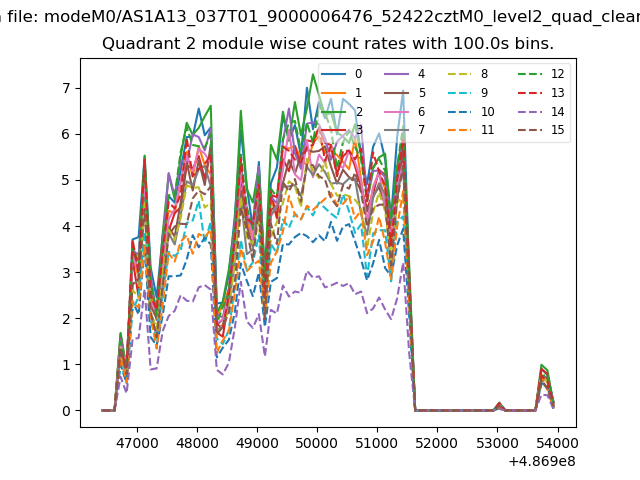
| Module-wise count rates for Quadrant B Data is divided into 100 sec bins |
 |
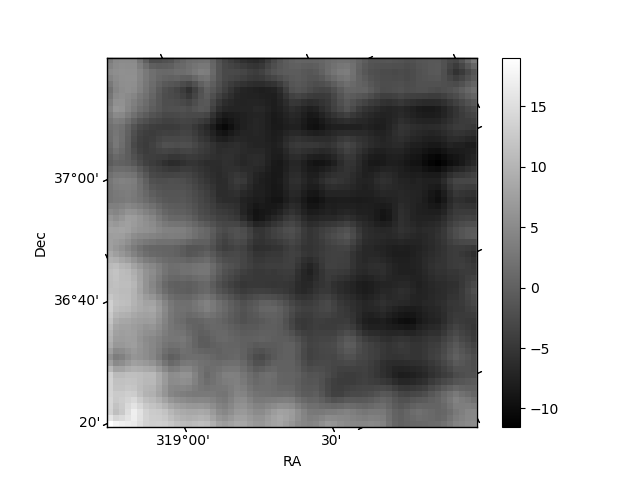 |
| Module-wise count rates for Quadrant C Data is divided into 100 sec bins |
 |
 |
| Module-wise count rates for Quadrant D Data is divided into 100 sec bins |
 |
 |
| Parameter | Plot |
|---|---|
| CZT HV Monitor | 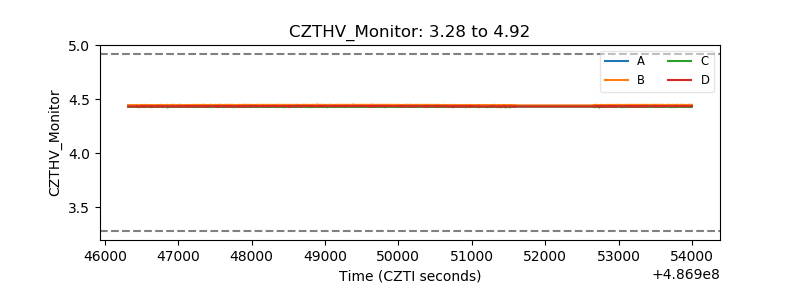 |
| D_VDD | 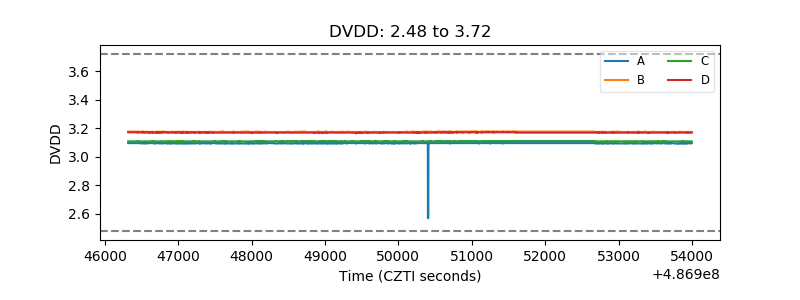 |
| Temperature 1 | 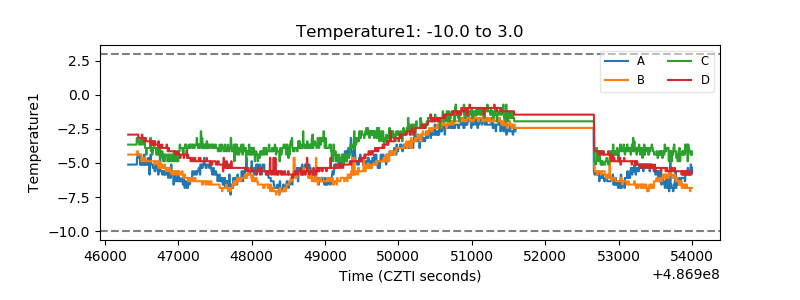 |
| Veto HV Monitor | 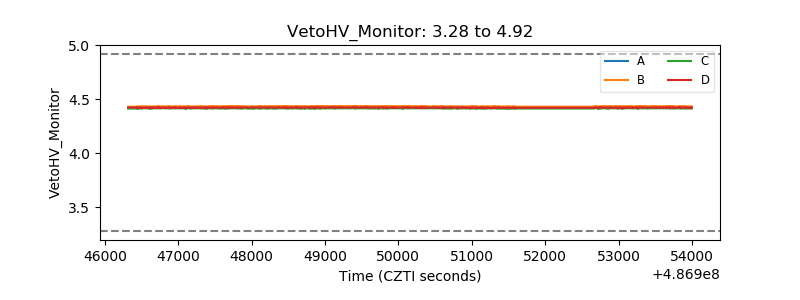 |
| Veto LLD | 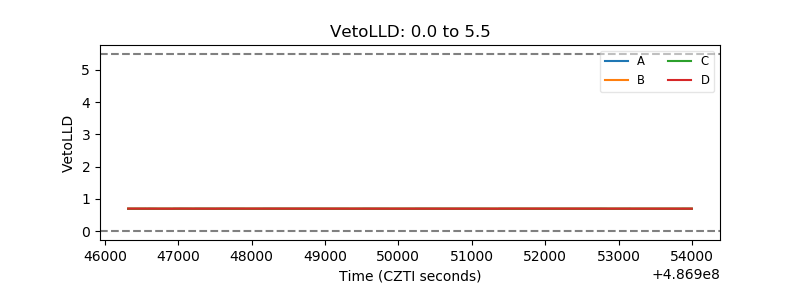 |
| Alpha Counter | 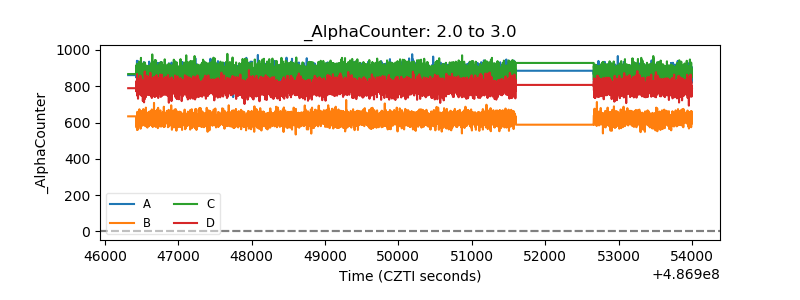 |
| _CPM_Rate | 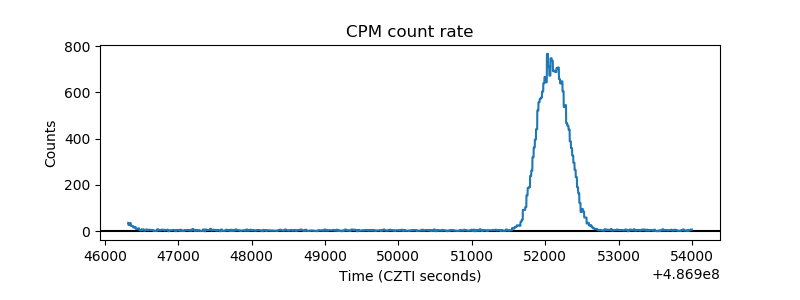 |
| CZT Counter | 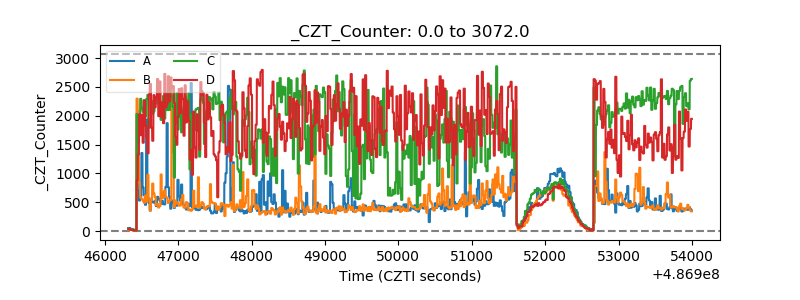 |
| +2.5 Volts monitor |  |
| +5 Volts monitor |  |
| _ROLL_ROT | 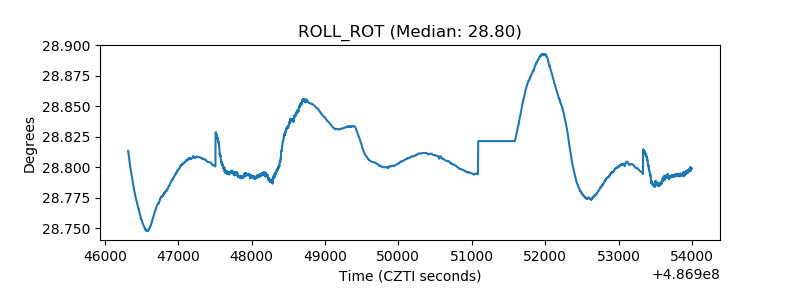 |
| _Roll_DEC | 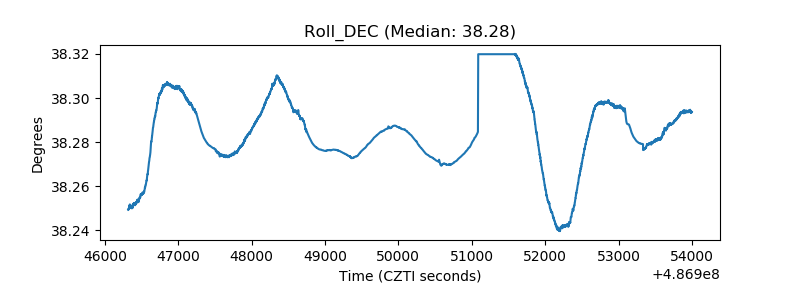 |
| _Roll_RA | 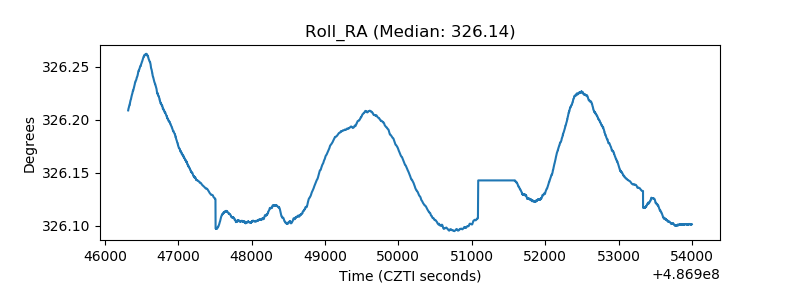 |
| Veto Counter | 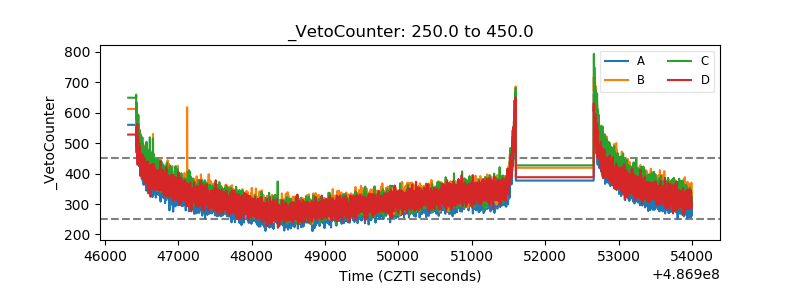 |