| Param | Original file | Final file |
|---|---|---|
| Filename | modeM0/AS1A13_037T01_9000006476_52445cztM0_level2.fits | modeM0/AS1A13_037T01_9000006476_52445cztM0_level2_quad_clean.evt |
| Size (bytes) | 976,792,320 | 89,280,000 |
| Size | 931.5 MB | 85.1 MB |
| Events in quadrant A | 3,887,963 | 696,374 |
| Events in quadrant B | 5,781,569 | 723,858 |
| Events in quadrant C | 11,110,465 | 458,413 |
| Events in quadrant D | 14,790,920 | 295,587 |
| Mode M0 | |||
|---|---|---|---|
| Quadrant | BADHDUFLAG | Total packets | Discarded packets |
| A | 0 | 17180 | 2 |
| B | 0 | 22502 | 0 |
| C | 0 | 38295 | 0 |
| D | 0 | 49199 | 0 |
| Mode SS | |||
|---|---|---|---|
| Quadrant | BADHDUFLAG | Total packets | Discarded packets |
| A | 0 | 152 | 0 |
| B | 0 | 152 | 0 |
| C | 0 | 152 | 0 |
| D | 0 | 152 | 0 |
| Quadrant | Total seconds | Saturated seconds | Saturation percentage |
|---|---|---|---|
| A | 7598 | 123 | 1.618847% |
| B | 7599 | 434 | 5.711278% |
| C | 7599 | 2442 | 32.135807% |
| D | 7599 | 4276 | 56.270562% |
Noise dominated data is calculated using 1-second bins in cleaned event files. If a bin has >2000 counts, and if more than 50% of those come from <1% of pixels, then it is considered to be noise-dominated and hence unusable.
| Quadrant | # 1 sec bins | Bins with >0 counts | Bins with >2000 counts | High rate bins dominated by noise | Noise dominated (total time) | Noise dominated (detector-on time) | Marked lightcurve |
|---|---|---|---|---|---|---|---|
| A | 7598 | 7598 | 84 | 84 | 1.11% | 1.11% | 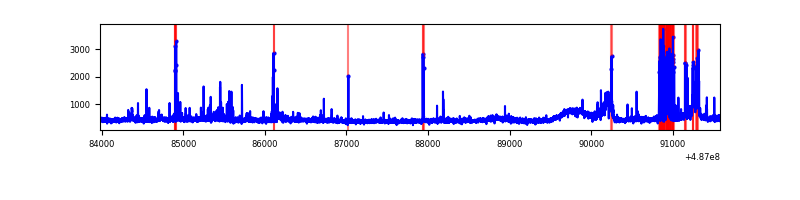 |
| B | 7599 | 7599 | 195 | 195 | 2.57% | 2.57% | 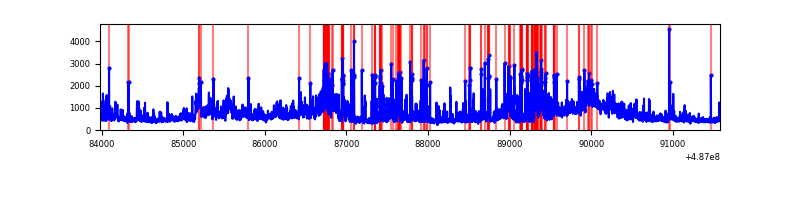 |
| C | 7598 | 7598 | 2356 | 2356 | 31.01% | 31.01% | 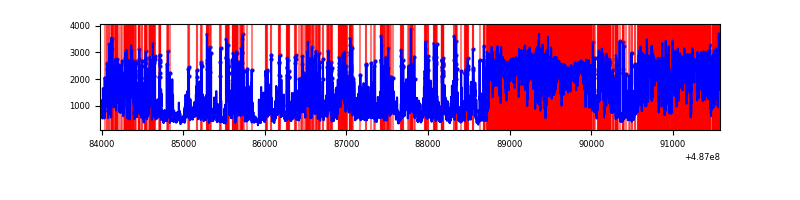 |
| D | 7599 | 7599 | 4103 | 4103 | 53.99% | 53.99% | 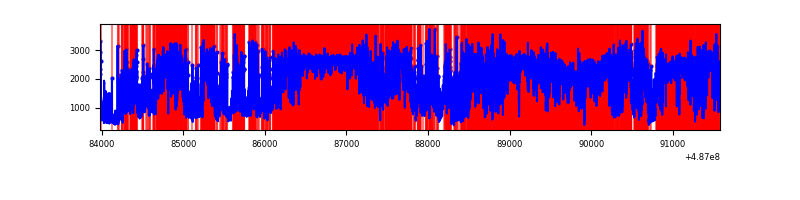 |
Top three noisy pixels from each quadrant. If the there are fewer than three noisy pixels in the level2.evt file, extra rows are filled as -1
| Pixel properties | Quadrant properties | ||||||
|---|---|---|---|---|---|---|---|
| Quadrant | DetID | PixID | Counts | Sigma | Mean | Median | Sigma |
| A | 4 | 61 | 259437 | 1309.93 | 805 | 784 | 197.5 |
| A | 12 | 80 | 210932 | 1064.28 | 805 | 784 | 197.5 |
| A | 4 | 3 | 65846 | 329.5 | 805 | 784 | 197.5 |
| B | 12 | 32 | 825444 | 4821.37 | 785 | 756 | 171.0 |
| B | 7 | 0 | 799761 | 4671.22 | 785 | 756 | 171.0 |
| B | 10 | 254 | 615550 | 3594.27 | 785 | 756 | 171.0 |
| C | 15 | 231 | 3617513 | 20459.32 | 641 | 635 | 176.8 |
| C | 15 | 224 | 1974290 | 11164.22 | 641 | 635 | 176.8 |
| C | 2 | 12 | 1093280 | 6180.68 | 641 | 635 | 176.8 |
| D | 6 | 42 | 6244809 | 39857.02 | 544 | 518 | 156.7 |
| D | 15 | 174 | 1844107 | 11767.54 | 544 | 518 | 156.7 |
| D | 12 | 17 | 1474505 | 9408.39 | 544 | 518 | 156.7 |
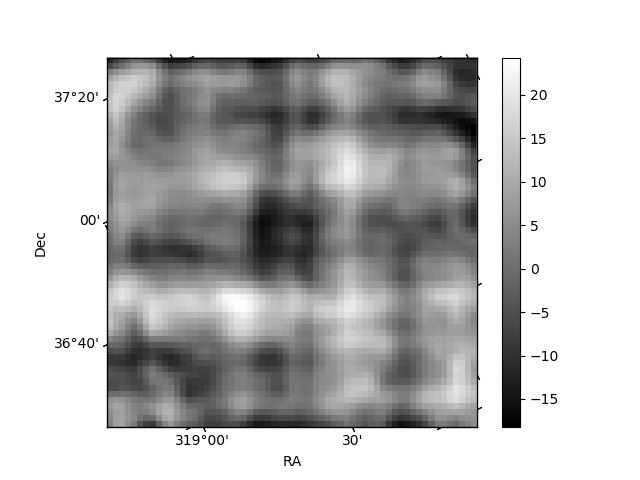
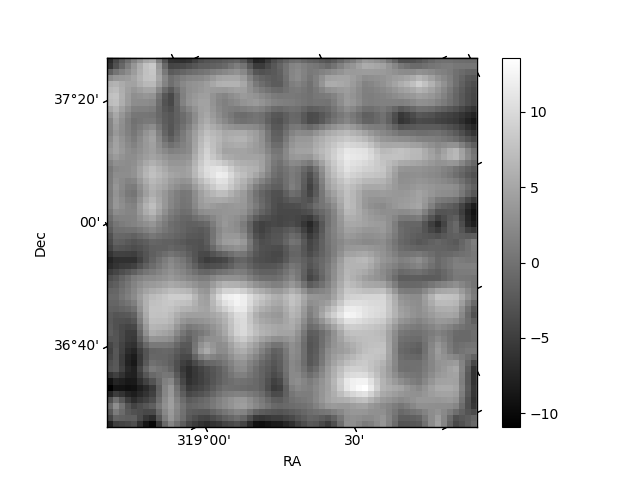
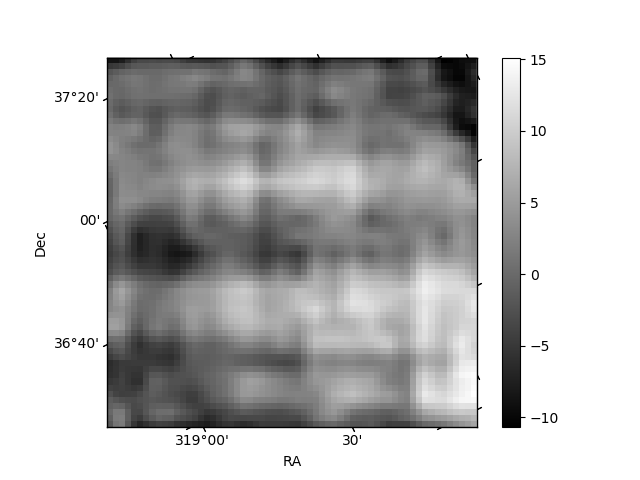
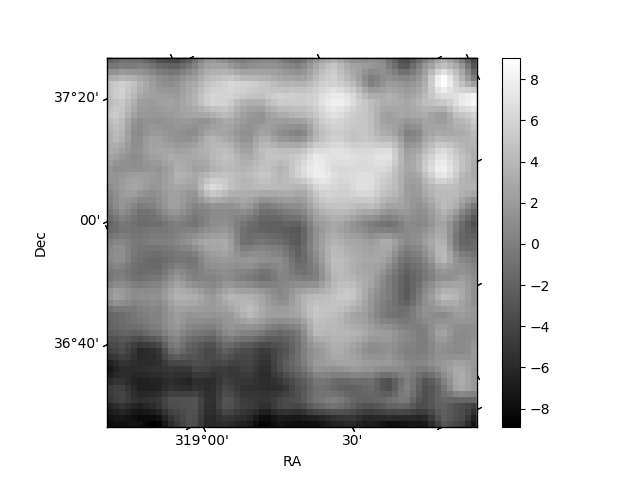
Histogram calculated using DETX and DETY for each event in the final _common_clean file
| Quadrant A | 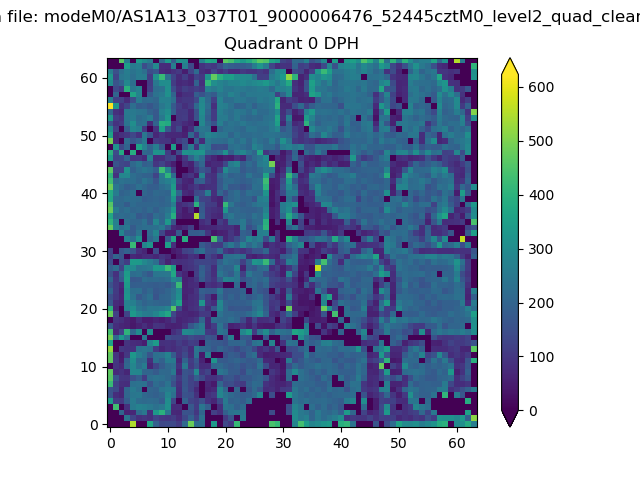 |
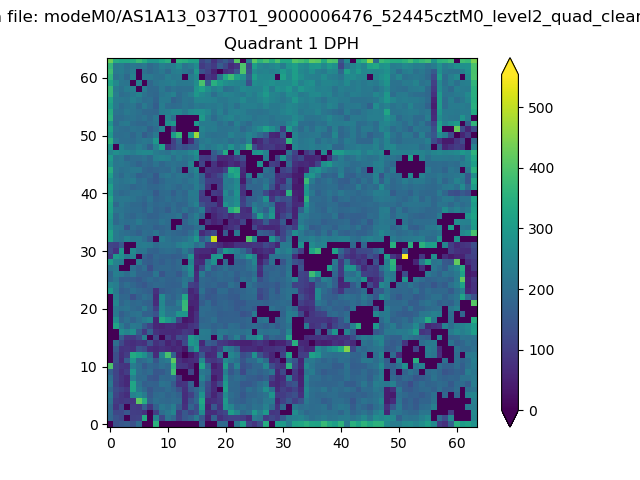 |
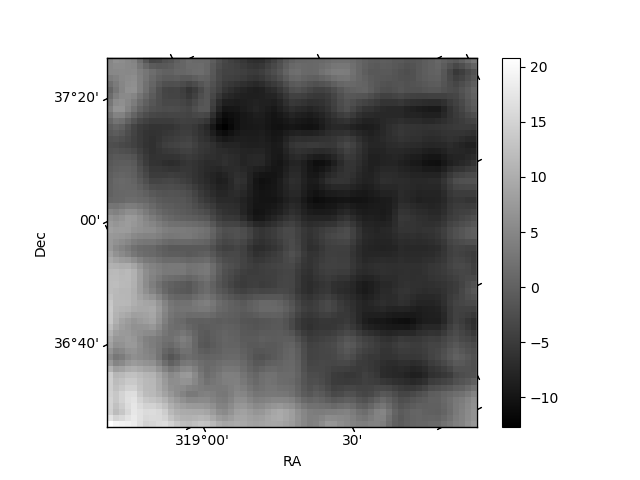
Quadrant B |
|---|---|---|---|
| Quadrant D | 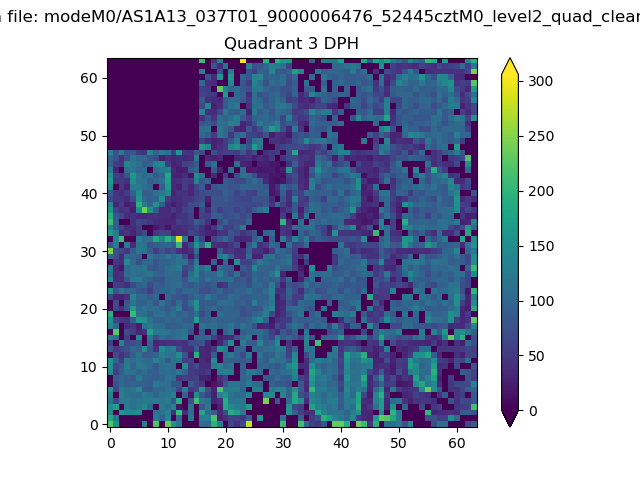 |
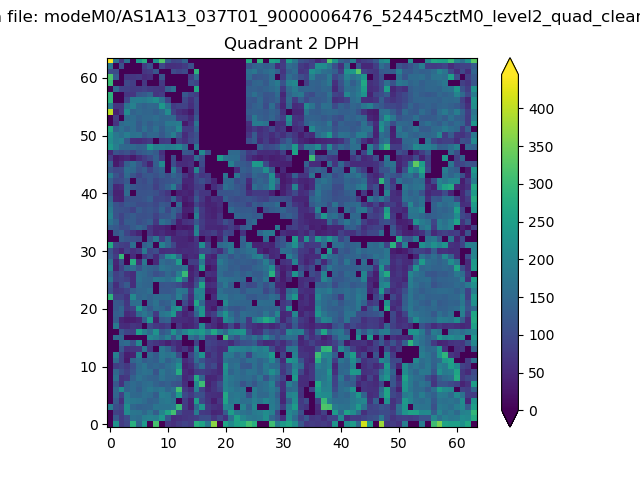 |
Quadrant C |
| Plot type | Count rate plots | Images |
|---|---|---|
| Comparison with Poisson distribution Blue bars denote a histogram of data divided into 1 sec bins. Red curve is a Poisson curve with rate = median count rate of data. |
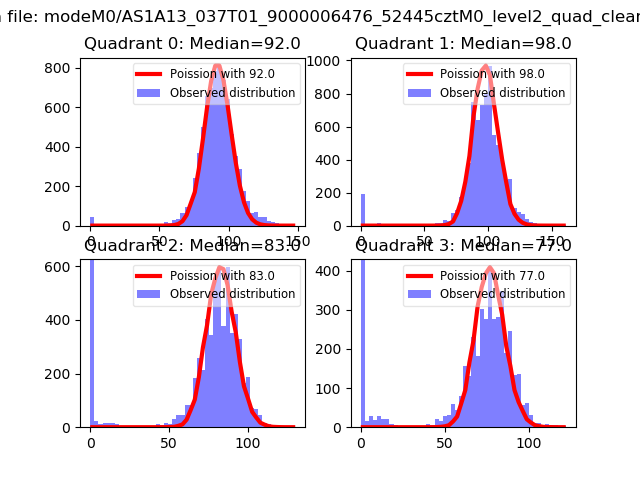 |
 |
| Quadrant-wise count rates Data is divided into 100 sec bins |
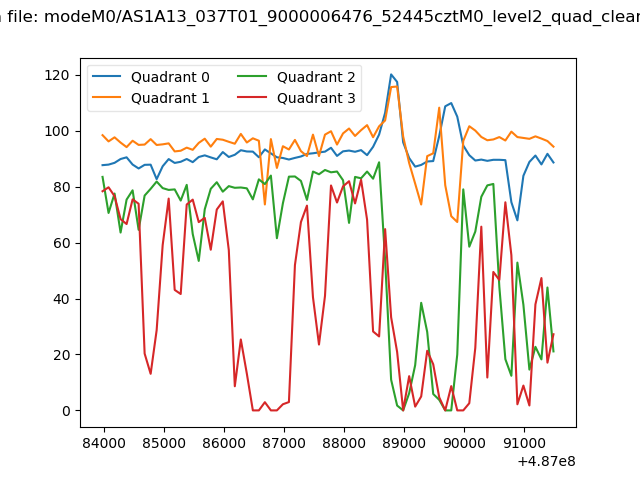 |
|
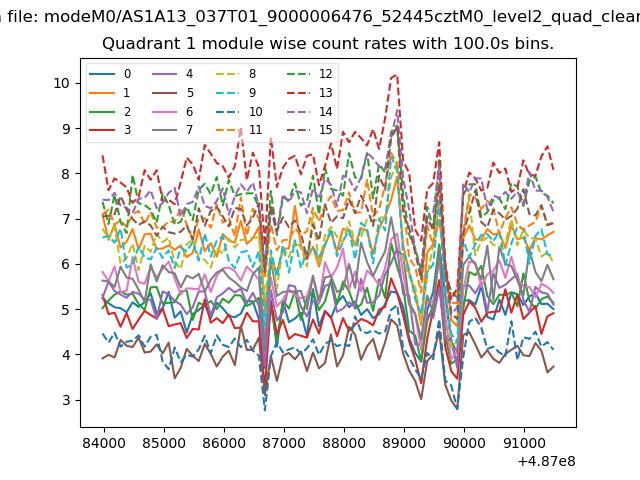
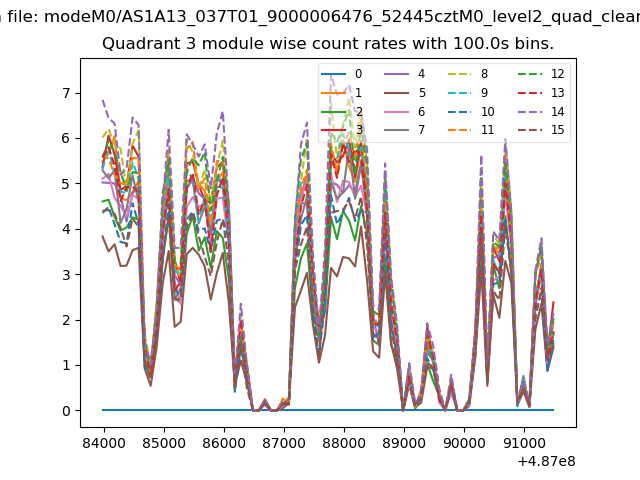
| Module-wise count rates for Quadrant A Data is divided into 100 sec bins |
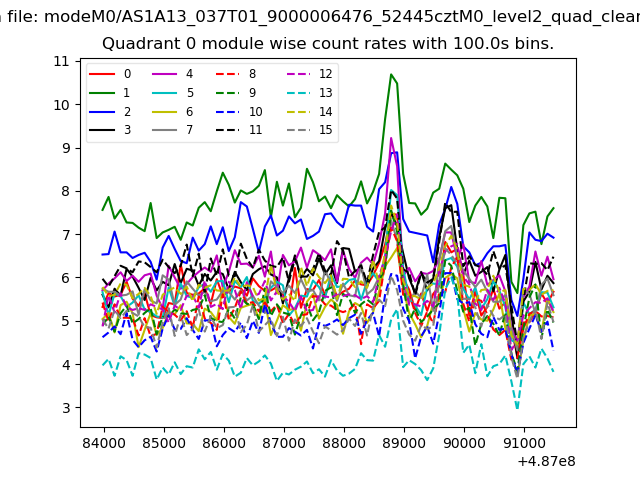 |
 |
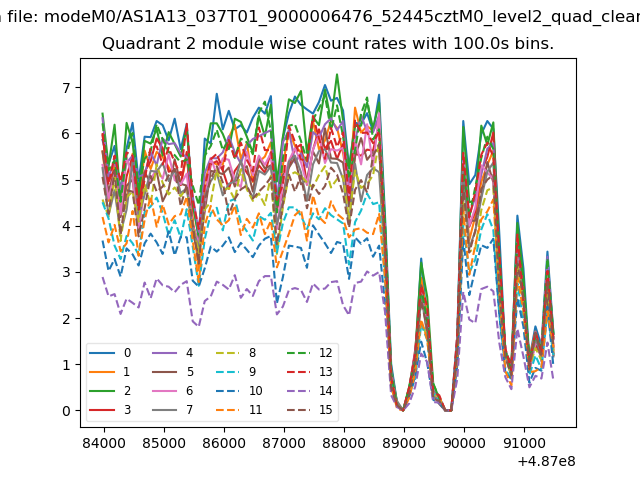
| Module-wise count rates for Quadrant B Data is divided into 100 sec bins |
 |
 |
| Module-wise count rates for Quadrant C Data is divided into 100 sec bins |
 |
 |
| Module-wise count rates for Quadrant D Data is divided into 100 sec bins |
 |
 |
| Parameter | Plot |
|---|---|
| CZT HV Monitor | 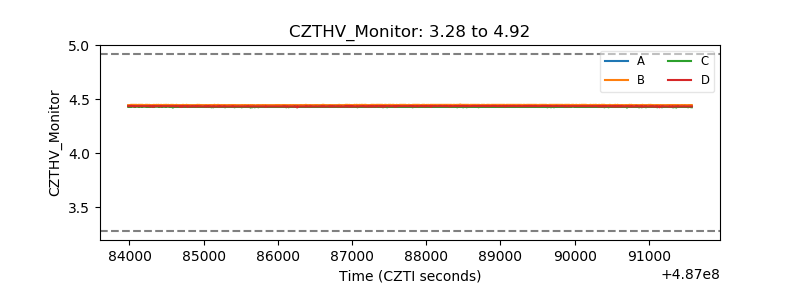 |
| D_VDD | 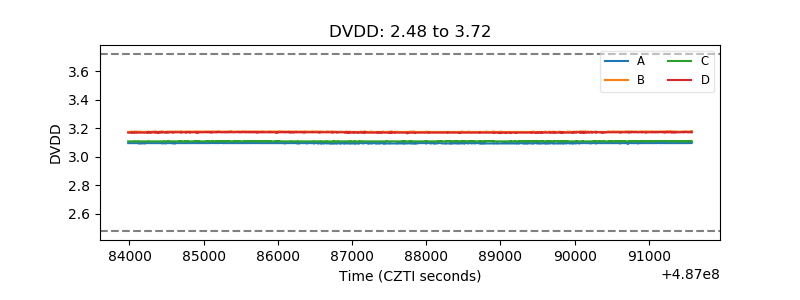 |
| Temperature 1 | 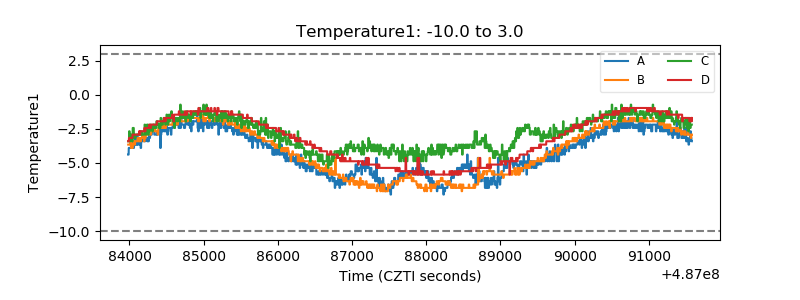 |
| Veto HV Monitor | 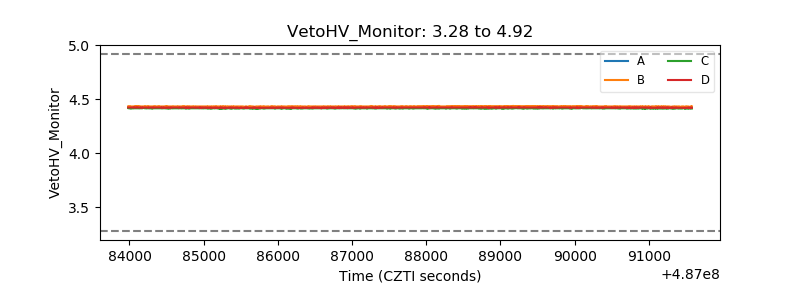 |
| Veto LLD | 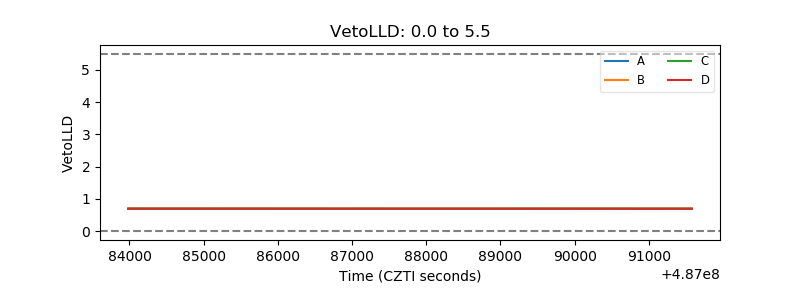 |
| Alpha Counter | 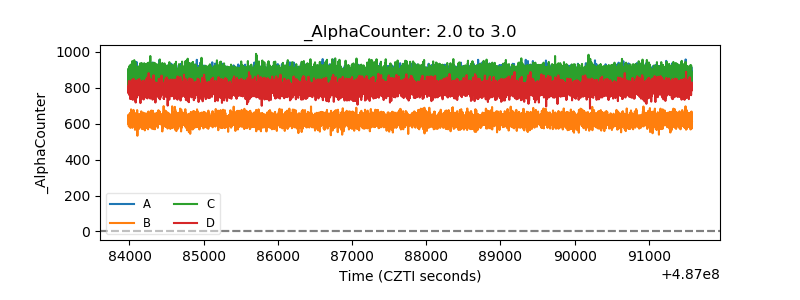 |
| _CPM_Rate | 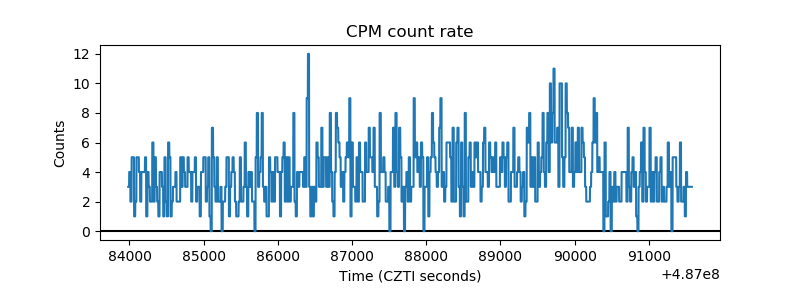 |
| CZT Counter | 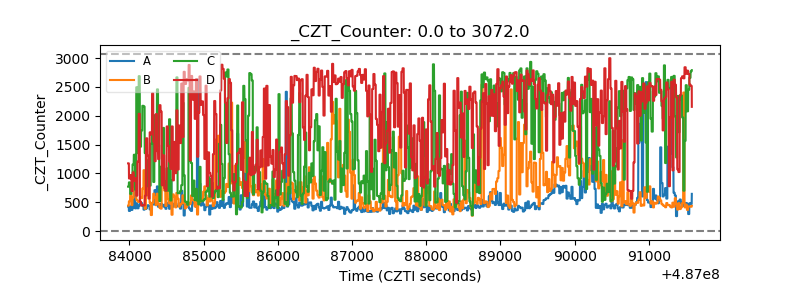 |
| +2.5 Volts monitor |  |
| +5 Volts monitor |  |
| _ROLL_ROT | 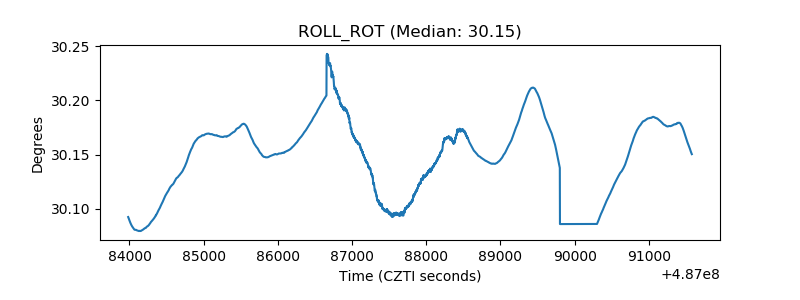 |
| _Roll_DEC | 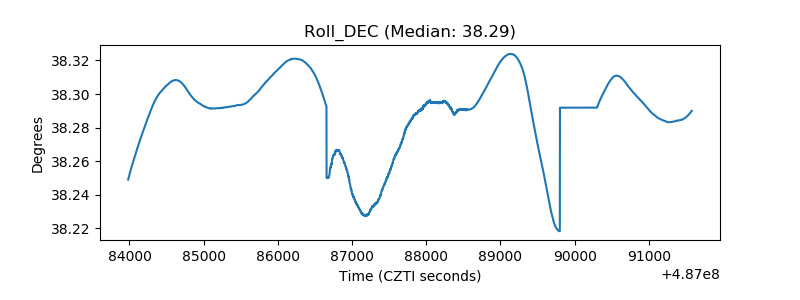 |
| _Roll_RA | 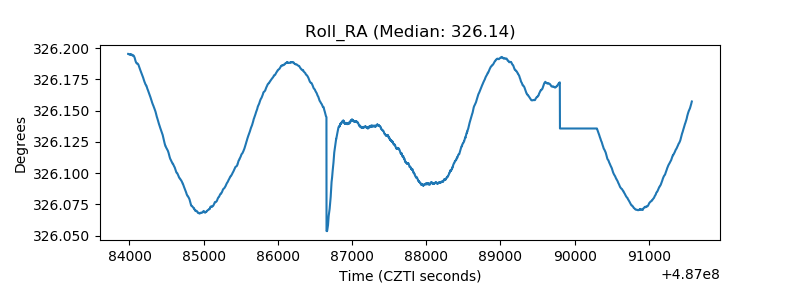 |
| Veto Counter | 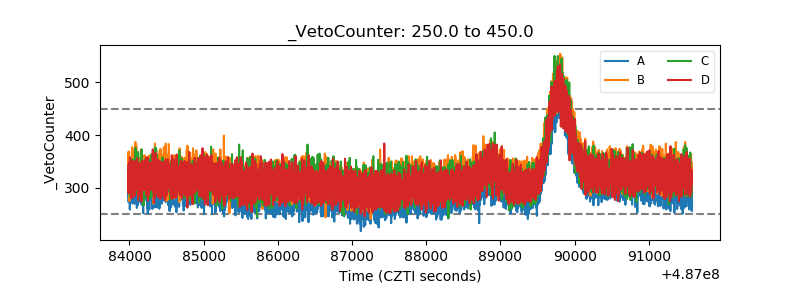 |