| Param | Original file | Final file |
|---|---|---|
| Filename | modeM0/AS1A13_037T01_9000006476_52480cztM0_level2.fits | modeM0/AS1A13_037T01_9000006476_52480cztM0_level2_quad_clean.evt |
| Size (bytes) | 820,085,760 | 78,073,920 |
| Size | 782.1 MB | 74.5 MB |
| Events in quadrant A | 3,184,615 | 650,513 |
| Events in quadrant B | 5,222,762 | 687,660 |
| Events in quadrant C | 4,703,606 | 566,926 |
| Events in quadrant D | 16,735,729 | 697 |
| Mode M9 | |||
|---|---|---|---|
| Quadrant | BADHDUFLAG | Total packets | Discarded packets |
| A | 0 | 11 | 0 |
| B | 0 | 12 | 0 |
| C | 0 | 12 | 0 |
| D | 0 | 12 | 0 |
| Mode M0 | |||
|---|---|---|---|
| Quadrant | BADHDUFLAG | Total packets | Discarded packets |
| A | 0 | 14229 | 2 |
| B | 0 | 20004 | 2 |
| C | 0 | 18839 | 8 |
| D | 0 | 54248 | 2 |
| Mode SS | |||
|---|---|---|---|
| Quadrant | BADHDUFLAG | Total packets | Discarded packets |
| A | 0 | 134 | 0 |
| B | 0 | 134 | 0 |
| C | 0 | 134 | 0 |
| D | 0 | 134 | 0 |
| Quadrant | Total seconds | Saturated seconds | Saturation percentage |
|---|---|---|---|
| A | 6568 | 62 | 0.943971% |
| B | 6568 | 251 | 3.821559% |
| C | 6567 | 595 | 9.060454% |
| D | 6567 | 6562 | 99.923862% |
Noise dominated data is calculated using 1-second bins in cleaned event files. If a bin has >2000 counts, and if more than 50% of those come from <1% of pixels, then it is considered to be noise-dominated and hence unusable.
| Quadrant | # 1 sec bins | Bins with >0 counts | Bins with >2000 counts | High rate bins dominated by noise | Noise dominated (total time) | Noise dominated (detector-on time) | Marked lightcurve |
|---|---|---|---|---|---|---|---|
| A | 7623 | 6569 | 9 | 9 | 0.12% | 0.14% | 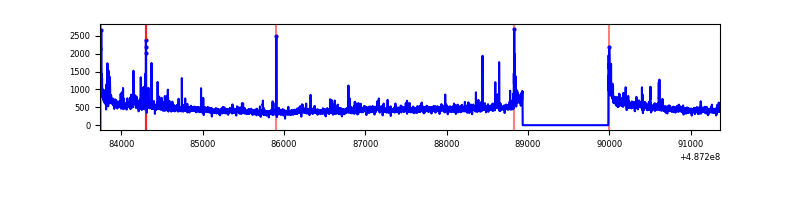 |
| B | 7623 | 6569 | 152 | 152 | 1.99% | 2.31% | 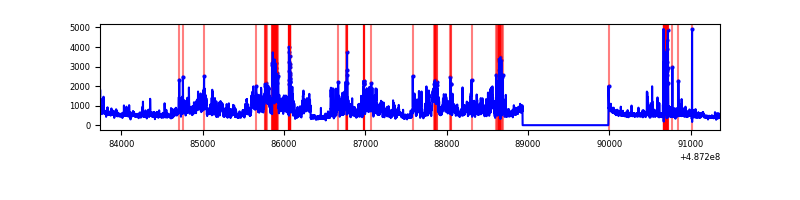 |
| C | 7622 | 6568 | 420 | 420 | 5.51% | 6.39% | 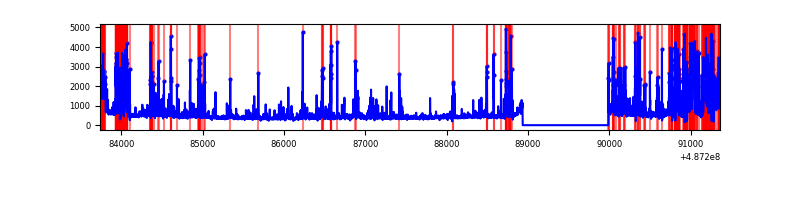 |
| D | 7621 | 6566 | 6238 | 6238 | 81.85% | 95.00% | 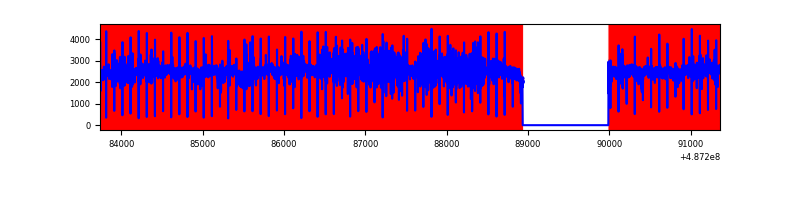 |
Top three noisy pixels from each quadrant. If the there are fewer than three noisy pixels in the level2.evt file, extra rows are filled as -1
| Pixel properties | Quadrant properties | ||||||
|---|---|---|---|---|---|---|---|
| Quadrant | DetID | PixID | Counts | Sigma | Mean | Median | Sigma |
| A | 4 | 3 | 97023 | 537.62 | 716 | 699 | 179.2 |
| A | 8 | 249 | 96781 | 536.27 | 716 | 699 | 179.2 |
| A | 13 | 248 | 33597 | 183.62 | 716 | 699 | 179.2 |
| B | 10 | 254 | 1671356 | 10994.09 | 706 | 682 | 152.0 |
| B | 0 | 213 | 164317 | 1076.82 | 706 | 682 | 152.0 |
| B | 10 | 44 | 162146 | 1062.54 | 706 | 682 | 152.0 |
| C | 15 | 224 | 1060876 | 5814.31 | 668 | 663 | 182.3 |
| C | 13 | 3 | 361775 | 1980.37 | 668 | 663 | 182.3 |
| C | 2 | 12 | 146784 | 801.34 | 668 | 663 | 182.3 |
| D | 15 | 93 | 13254222 | 264721.48 | 168 | 161 | 50.1 |
| D | 6 | 42 | 2572041 | 51367.79 | 168 | 161 | 50.1 |
| D | 8 | 176 | 144797 | 2888.79 | 168 | 161 | 50.1 |
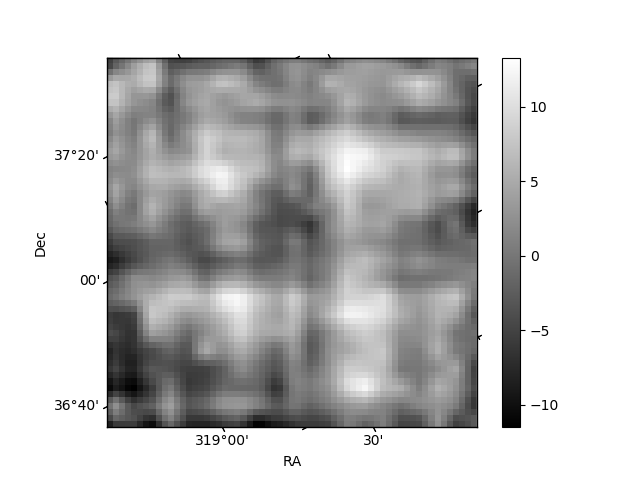
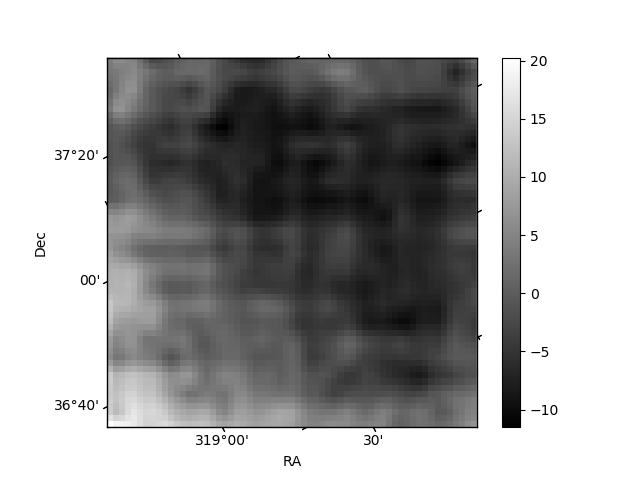
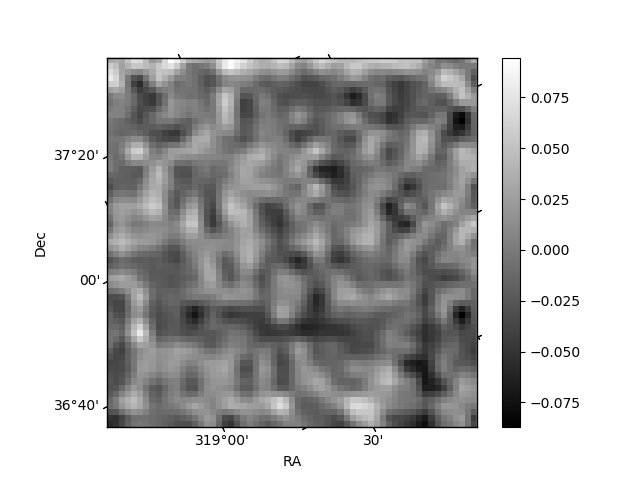
Histogram calculated using DETX and DETY for each event in the final _common_clean file
| Quadrant A | 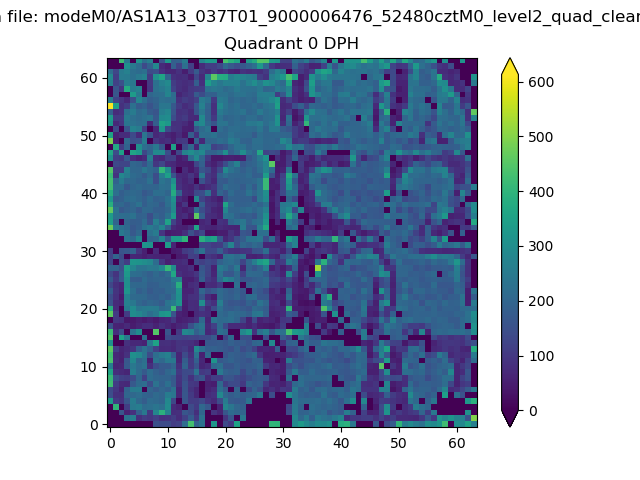 |
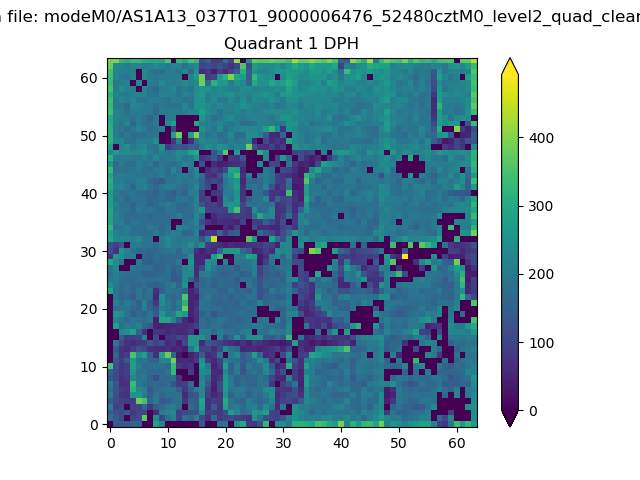 |
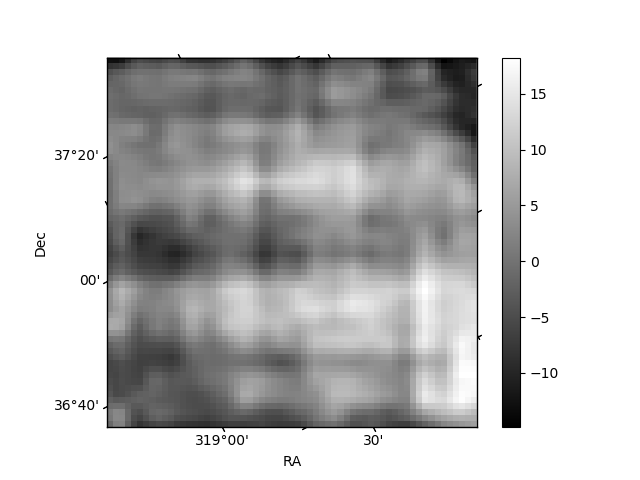
Quadrant B |
|---|---|---|---|
| Quadrant D |  |
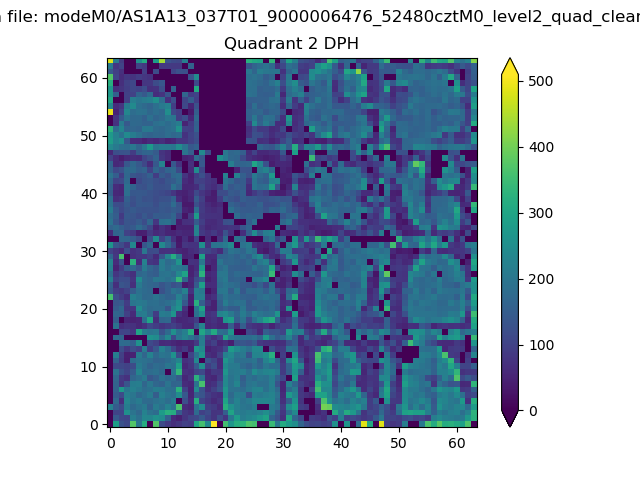 |
Quadrant C |
| Plot type | Count rate plots | Images |
|---|---|---|
| Comparison with Poisson distribution Blue bars denote a histogram of data divided into 1 sec bins. Red curve is a Poisson curve with rate = median count rate of data. |
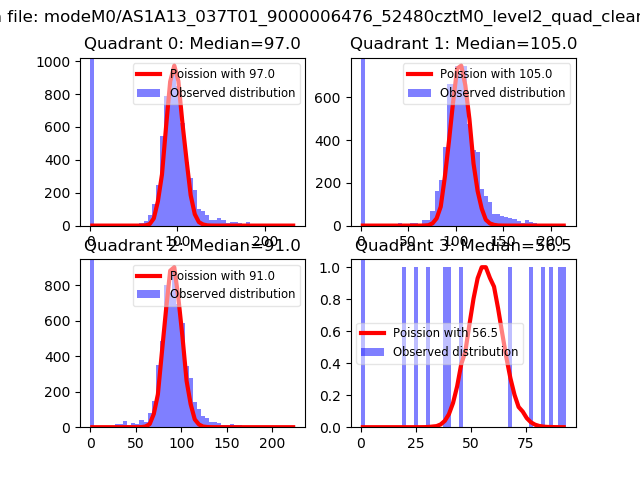 |
 |
| Quadrant-wise count rates Data is divided into 100 sec bins |
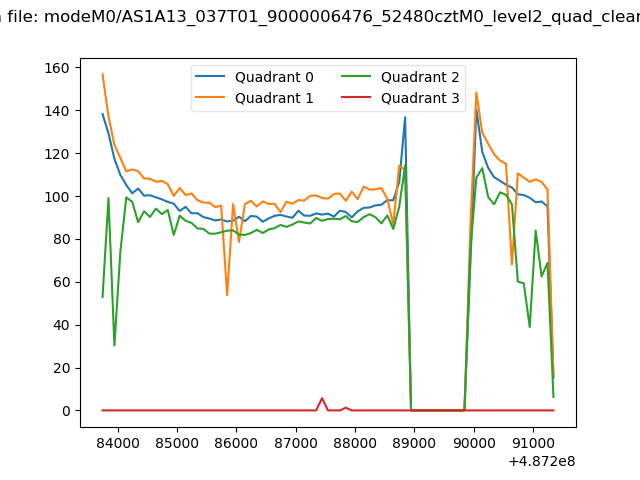 |
|
| Module-wise count rates for Quadrant A Data is divided into 100 sec bins |
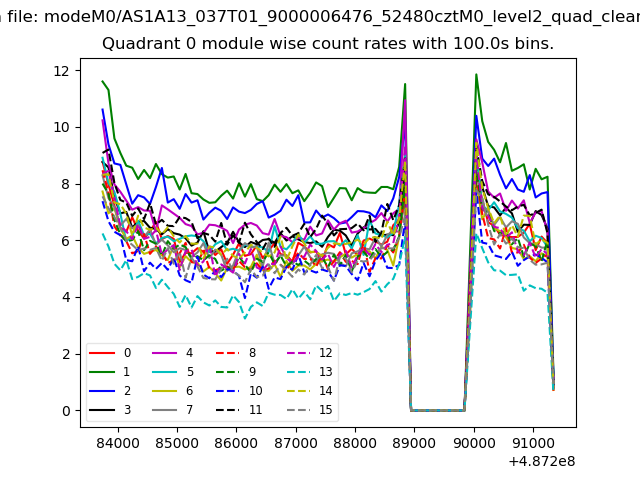 |
 |
| Module-wise count rates for Quadrant B Data is divided into 100 sec bins |
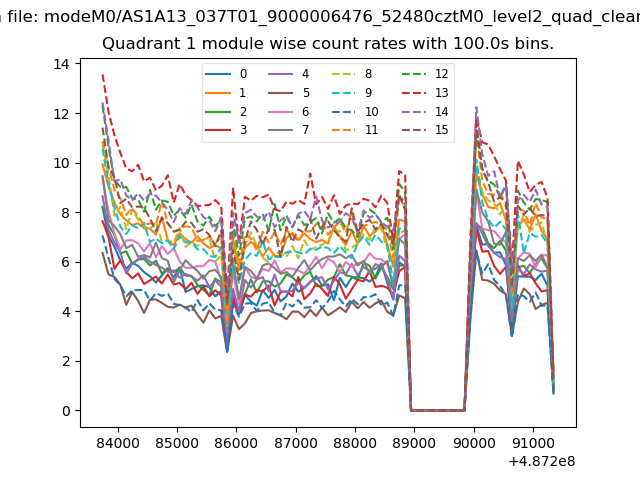 |
 |
| Module-wise count rates for Quadrant C Data is divided into 100 sec bins |
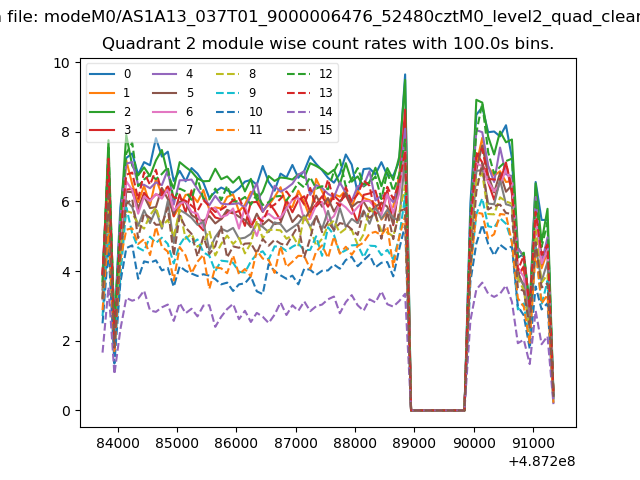 |
 |
| Module-wise count rates for Quadrant D Data is divided into 100 sec bins |
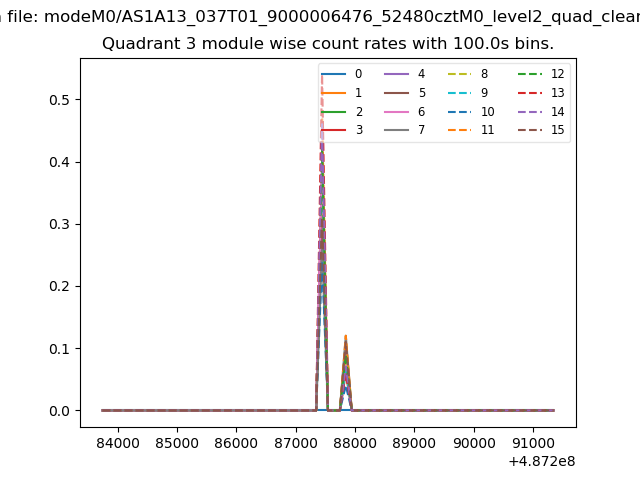 |
 |
| Parameter | Plot |
|---|---|
| CZT HV Monitor | 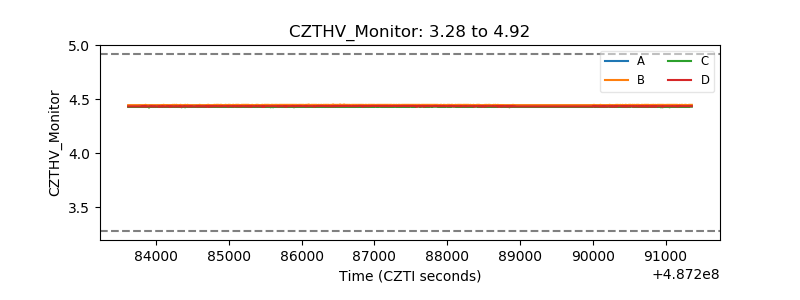 |
| D_VDD | 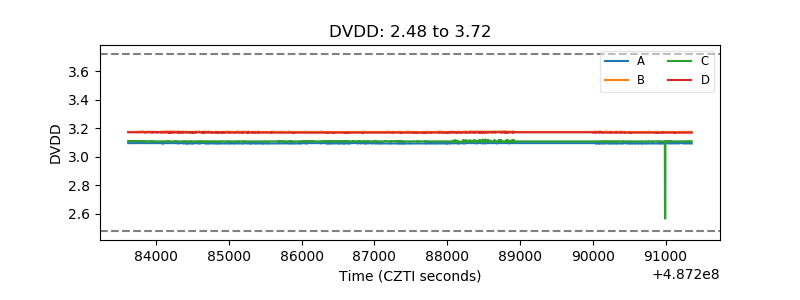 |
| Temperature 1 |  |
| Veto HV Monitor | 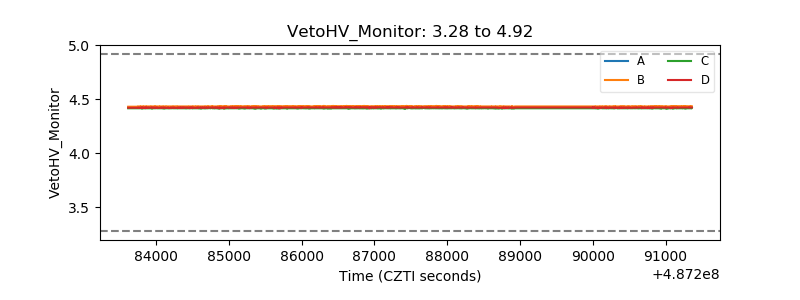 |
| Veto LLD | 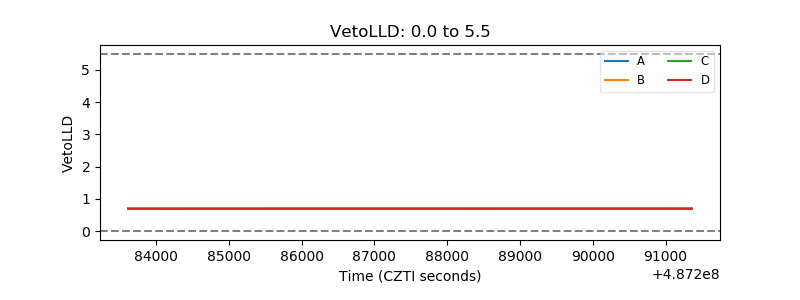 |
| Alpha Counter | 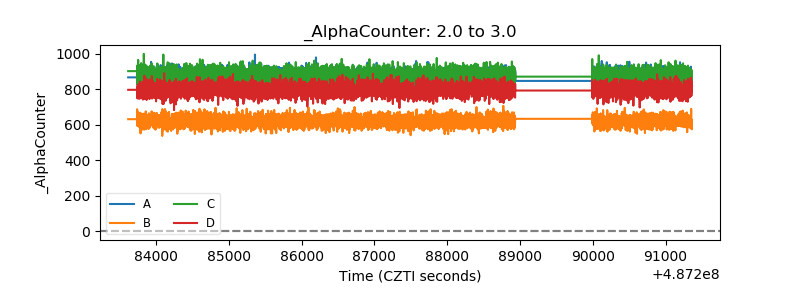 |
| _CPM_Rate | 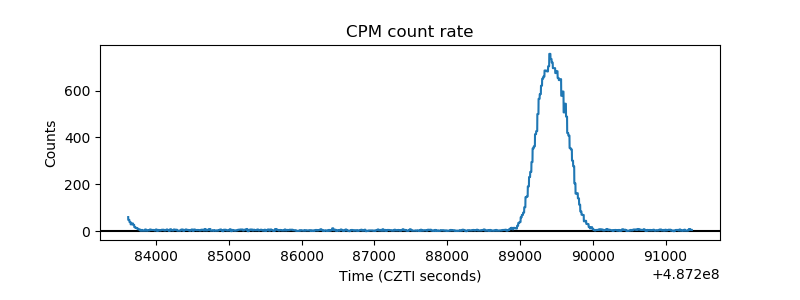 |
| CZT Counter | 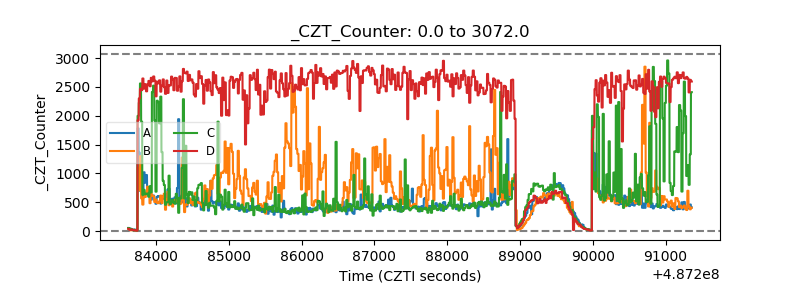 |
| +2.5 Volts monitor | 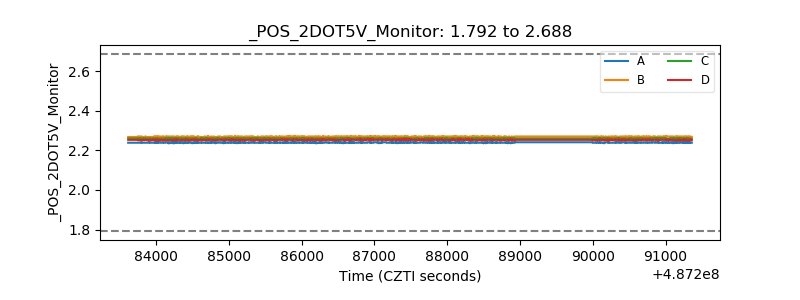 |
| +5 Volts monitor |  |
| _ROLL_ROT | 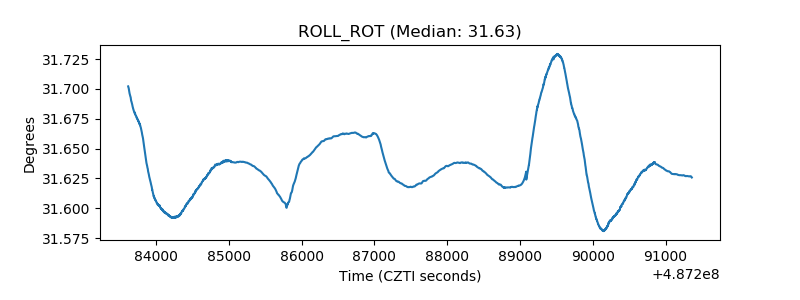 |
| _Roll_DEC | 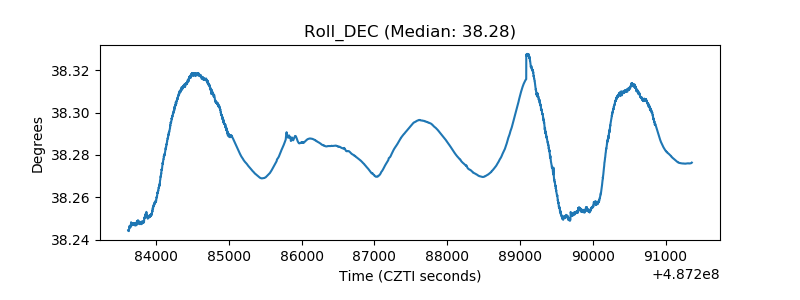 |
| _Roll_RA |  |
| Veto Counter | 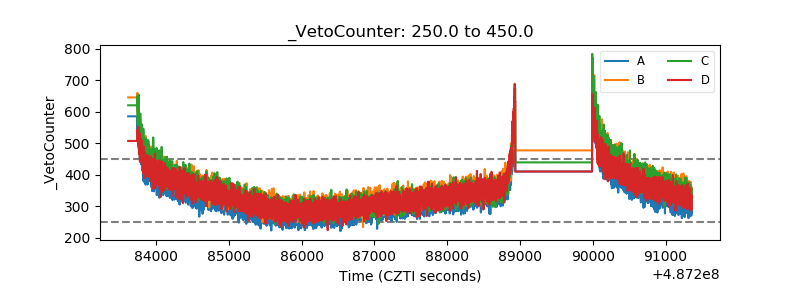 |